Monday, July 31, 2006

CBIP did a bullish breakout at RM2.90

CBIP is involved in the manufacture of palm oil mill equipment & related spare parts; provision of engineering support for commissioning & contracting works for palm oil mills; and designing, fabrication, erection & supply of plant and equipment for palm oil mills.

The current boom in the oil palm sector should benefit CBIP considerably. The financial performance of CBIP for the past 5 quarters is fairly good (see Table below).


The share has broken above the strong resistance of RM2.90 level at 9.30 a.m. this morning. At 4.00 p.m., the stock has also broken above the RM3.00 psychological level (see Chart 1 & 2 below). The breakout at RM2.90 is very bullish for CBIP as it represents the continuation of the prior uptrend. Measuring the low of the preceding continuation pattern i.e. RM2.40 and the breakout point of RM2.90, I believe that this current uptrend rally is likely to have a target objective of RM3.40 (RM2.90 + RM0.50).


Chart 1: CBIP's daily chart as at July 28


Chart 2: CBIP's weekly chart as at July 28

Updated on 8/1/2006

S&P's result report dated May 31, 2006 has forecasted that CBIP might record a net profit of RM26.4 mil on a turnover of RM240.0 mil for FYE2006. For FYE2007, net profit was forecasted to increase to RM38.3 mil while turnover would grow to RM308.1 mil. Based on this, EPS for 2006 would be about 19.8 sen (as compared to 14.9 sen for 2005). As such, CBIP (which closed at RM3.02 yesterday) is now trading at a PE of 15.3 times its current year's earning. Some may view the stock as fairly valued notwithstanding the net profit's high CAGR of 30-40% for the next 2 years.

From the Edge for w/e 8/6/06

From the current issue of the Edge, we have the following stories:

1. EON to face the reality of slowing sales & mounting inventories

From the 1H2006 results, we've learned that EON was only able to sell 60246 Proton cars, a drop of 20.7% from 75983 units sold in 1H2005. In fact, since the setting up of Proton Edar by Proton & the change of status for EON from Proton distributor to super dealer, EON's share of Proton cars sold in Malaysia has declined steadily from 50% of all Protons cars sold in 2003 to 40% in 2004, and 30% in 2005. Despite the declining sale, EON's inventories of Proton cars has risen steadily. At the end of 1H2006 (as at Mar 31, 2006), the inventories stood at RM618 mil, a 46%-increase from RM422 mil as at Dec 31, 2005. As a result of the decline in business volume, EON has now proposed to undertake a VSS involving 2500 of its employees (announced last week). There is also some market talk that Proton Edar & EON may have to be restructured because the dealers' network (189 for Proton Edar & 116 for EON as at end July 2005) and the branch network (34 for Proton Edar & 52 for EON as at end July 2005) of these 2 companies are too large to sustain the reduced sale volume. I expect continued weakness in the share of EON in the days ahead.

2. Proton's can of worms was opened for all to see.

The government, probably in reply to the many charges leveled against it by the former CEO of Proton, Tengku Mahalel & our former Prime Minister, has allowed a PricewaterhouseCooper report on Proton to be published. The report gives a damaging account of the mismanagement in Proton that was largely due to poor corporate governance. The Board of Proton was reduced to a mere rubberstamp and most executive powers were either vested in the office of the CEO or exercised collectively by its senior management (thru Management Committee Meetings). Mistakes in the acquistion of Lotus in 1996 and, subsequently, MV Augusta in 2005 were examined. And, many more. The report is very interesting and reminded me of the poor management of General Motor by its then Chairman, Roger Smith as potrayed in the book "Comeback". Billions after billions of dollar was spent by Roger Smith to build automated plants in order to catch up with Toyota. Those ill-conceived expansion & modernisation programs had reduced what was once an American icon into an embarassing example of American inefficiency.

3. OCBC to take Great Eastern Holdings private

This artcicle talks about the current offer of S$16 per share made by OCBC to the minority shareholders of Great Eastern. OCBC currently owns 83% of Great Eastern & hope to secure 90% acceptance from the remaining shareholders in order to compulsorily acquired Great Eastern under the provision of the Singapore Companies Act. Some of the minority shareholders are resisting the offer but they are faced with a tough choice of Great Eastern being de-listed if they do not accept the offer and OCBC somehow manages to secure 90% of the outstanding shares of Great Eastern i.e. an additional 7% shares. The offer will lapse on August 16 and it is the second time that OCBC is going down this path. It had tried to take Great Eastern private in 2004.

What makes this story interesting is that it may provide an inkling to the likelihood that Great Eastern's Malaysian operation may be injected into Pacificmas Bhd. The latter was first announced in 2004 but, until today, there is still no firm indication when the deal is going to be completed. The last news we heard was that the due diligence has yet to be completed (why so long?). The tenacity in which OCBC pursues Great Eastern across the Causeway made me believe that the Pacmas' proposed acquistion is a dead deal. I do not believe that OCBC, the majority shareholder of Great Eastern as well as the largest shareholder of Pacmas (owning 25% of its shares), would like to see any dilution of its interest in the Malaysian operation of Great Eastern. In any event, the coming liberalisation of financial services sector would mean that Great Eastern may not gain a huge advantage by localising its Malaysian operation.

4. MMC-Gamuda front-runner for railway job

The revival of the double tracking project may provide the catalyst for the re-rating of Gamuda. I have written earlier about the very nice techncial set-up for the Gamuda share. I believe that Gamuda is a good buy at RM3.50 or thereabout.

Friday, July 28, 2006

Linkfest

While surfing the net on a leisurely weekend, you are suddenly seized by a thought: "What does Alex read when he is not plotting charts?" Well, to answer your thought, I have provided here a small sampling of some of the recent articles that I have read:

1. If you like to know how to identify market bottoms and tops, you may learn a lot from this 2-part interview of the award-winning technician Paul Desmond (of Lowry's Reports) by Barry Ritholtz (of Big Picture). Go here for Part 1 and here for Part 2 of the interview.

2. Bill Gross of Pimco is always very entertaining & enlightenning even when he is talking about something as dry as bond yield & Fed funding rate. In his latest article, he explained how Pimco called "the end of a bond bear market and the peaking of Fed Funds".

3. James Picerno of Capital Spectator explained why he thinks the price of crude oil could fall sharply. He also explored the role played by big passive commodity investors, such as mutual funds & ETFs, in pushing up the price of crude oil.

Suiwah had a disappointing 4Q2006

Suiwah has just reported its results for 4Q2006. Its net profit dropped 42.6% y-o-y or 49.4% q-o-q to RM3.77 mil. Turnover has also declined by 17.0% y-o-y or 27.8% q-o-q to RM82.6 mil (see Table 1 below). The comparison with the immediately preceding quarter is not helpful because, being in the retail trade, the third quarter is normally the better quarter because of the many festivities during the year end plus the Chinese New Year.


Table 1: Suiwah's 4Q2006, 3Q2006 & 4Q2005

If we compare Suiwah's performance in FYE 2006 against its FYE 2005 (see table 2 below), we can see 2 reasons for the drop in the net profit. Firstly, turnover from retail trade has increased by 3.7% while operating profit has declined by 2.7%. This means the retail's profit margin has dropped due to competitive pressure. Secondly, the manufacturing division's operating profit has also dropped by 18.4%, which is in line with the 19.0%-drop in turnover. This division, which is carried on by the Qdos group that manufactures Flexible Printed Circuit Boards (FPCs), had experienced some disruption in output in the 3Q2006 & 4Q2006 due to the upgrading work carried out in its manufacturing facilities. The upgraded manufacturing facilities would enable Qdos to produce higher margin FPCs.

The main concern for Suiwah going forward is that the competition in the retail sector could only worsen due to recent government's decision to lift the freeze on the opening of hypermarket at the end of 2006, which is 2 years ahead of its original deadline.


Table 2: Suiwah's FYE 2006 & FYE 2005

Assuming that the manufacturing division bounces back & contributes more to Suiwah's bottomline i.e. more than enough to offset any drop in contribution from the retail division, than the earning of the group would not suffer. The EPS for 2006 amounts to 38.2 sen. With the tougher outlook for the retail sector & possible teething problems in the manufacturing division, we may want to adjust the 2007 EPS downward by 20% to 30.6 sen. Based on yesterday (July 27)'s closing price of RM2.01, the stock will be trading at 6.6 times our future earning. It is still not expensive and, given the nice technical set-up i.e. the share price is sitting on a very long-term uptrend line at RM2.00, I would keep my BUY call for Suiwah. I would still maintain that a stop loss of RM1.90 should also be set if you have bought this stock.

Market is at a crossroad

In the earlier post entitled " CI broke above 935", I have commented that the improvement in the CI was a broadbased recovery and not only due to the strong performance of the Plantation sector. Based on outdated statistics from the May 2004 issue of the Investors' Digest, the Main Board's overall market capitalisation were contributed mainly from 4 sectors i.e. Trading Services (38%), Finance (22%), Industrial Products (10%) & Consumer Products (9%).

From the daily charts of these 4 sectors (see Chart 1 to 4 below), we can see that all the 4 sectors have recovered substantially from their recent lows but are now coming up against either a strong horizontal resistance (in the case of the Finance sector) or their short-term downtrend (for the other 3 sectors). The big question is whether they can surpass these resistances. I believe that they may not be able to break above these resistances and consequently, the CI is likely to pull back to the congestion area of 920-935 levels.


Chart 1: Trading Services' daily chart as at July 27


Chart 2: Finance's daily chart as at July 27


Chart 3: Industrial's daily chart as at July 27


Chart 4: Consumer's daily chart as at July 27

CI broke above 935

The CI has broken above the heavily congested area between 920 & 935 levels against pretty strong odd (such as the uncertainties in the Middle East and a sharp selldown of speculative counters in the local bourse). Undoubtedly, the strong performance of the Plantation sector has helped the CI considerably but a closer study revealed that the improvement in the CI may be more broadbased than one may envision.

To re-cap, the CI has gained a total of 14.42 points in tha past 3 days to close at 936.76 yesterday. In the process, the CI has broken above the high of 928 recorded on July 13 as well as the strong horizontal resistance of 935 (which was the high recorded on June 5). The daily MACD has also hooked up to do a positive crossover, thereby giving a bullish sign (see Chart below).


Chart: CI's daily chart as at July 27

Thursday, July 27, 2006

APM testing a very strong support at RM2.20

APM is one of the major auto parts manufacturer in Malaysia. Its financial performance in the last quarter (QE 31/3/06) is probably reflective of the state of the Malaysian auto industry for the first half of 2006. Net profit dropped 3.8% q-o-q or 24.6% y-o-y to RM15.1 mil. Turnover at RM230.0 mil has dropped 3.8% q-o-q but was up 7.5% y-o-y. Cumulatively, the last 4 quarters' EPS amounts to 34.3 sen as compared to 31.0 sen in the preceding 4 quarters. As such, APM's PE is undemanding at 6.6 times based on yesterday (July 26) closing price of RM2.25.


Due to the above, APM's share price has also dropped back from its recent high of RM2.82 achieved on Apr 27. What's interesting is that the share price is now approaching the very strong horizontal support of RM2.20 (see Chart below). I believe this could present a trading or investment opportunity for those like to buy a fairly solid stock that can yield a return of 10% for a 6 months' holding period. At the time of writing this post (4.00 p.m.), the stock is at RM2.21.


Chart: APM's monthly chart as at July 26

Lion Industries poised for a breakout at RM0.92

The share price of Lion Industries ("Lion Ind") has corrected a lot since making a recent high of RM1.41 on May 11, after the announcement of the sale of Sabah Forest Industries for more than RM900 million by its subsidiary, Lion Forest Industries. Lion Ind's financial performance has been patchy due to the volatile prices of the major product of the group i.e. steel (see the Table below).


The chart shows that Lion Ind is in a medium-term uptrend with support at RM0.82. The stock closed the morning session at RM0.865, which is marginally above its 10-day MA. It will get very interesting if it can break above the RM0.92 level, which is the declining overhead short-term downtrend line. If a breakout happens, the stock's uptrend is likely to re-commence (see Chart below).


Chart: Lion Ind's daily chart as at July 26

Wednesday, July 26, 2006

Eksons- a second look

On July 21, I have called a BUY for Eksons as the stock has declined to its short-term uptrend line support of RM0.95. The BUY call was based on the nice technical set-up, which promises a good chance of a re-bounce. Also, the stock at the entry level of RM0.95 is very attractive priced at a PE of only 4.5 times. If you net off the capital repayment of RM0.20, you are buying a stock at RM0.75 that earns about 20 sen; giving a PE of 3.8 times.

On Monday (July 24), Eksons dropped below the RM0.95 uptrend line to close at RM0.91. Yesterday (July 25), it dropped another 1 sen to close at RM0.90 (see Chart 1 below). The stock dropped another 4 sen to close this morning session at RM0.86. In my earlier post, I've written that if this stock dropped below the RM0.90, the BUY call shall cease and any stock accumulated should be disposed off. This view shall remain.


Chart 1: Eksons' daily chart as at July 25

However, if you choose to hold the opposite view, I shall show you that the downside risk is not excessive. From Chart 2 below, you can see that the long-term uptrend line support is at RM0.85. If this also failed, the next support will be the horizontal support of RM0.80/0.83.


Chart 2: Eksons' weekly chart as at July 25

Airasia re-testing its low

On July 12, I've posted a stock alert calling a SELL on Airasia after the stock broke below its horizontal support of RM1.44/1.45. Todate, that is the only SELL recommendation that I have made. I would like to confine SELL calls to stocks that I've called a BUY earlier. Nonetheless, I made an exception for Airasia because there have been many inquiries on this stock from my clients.

Since the call was made, the stock has dropped to a low of RM1.28 before recovering to a high of RM1.40 on July 24. Thereafter, the stock has dropped again. This morning, it made a low of RM1.29 with the bulk of the trading done at the RM1.30/1.31 levels. Airasia appears to be doing a test of the low and, if the stock does not made a new low, we can expect the stock to recover from here. Some may like to buy into Airasia at this level but the safer entry level would be at RM1.40. The latter represents the downtrend line resistance for the stock. A break above that line would mean that a new trend (maybe, uptrend or sideway) will replace the current downtrend.


Chart: Airasia's daily chart as at July 25

Tuesday, July 25, 2006

Gamuda- an interesting long-term investment.

Gamuda's financial performance may have stabilised after 1 & 1/2 year of consolidation, which saw its net profit declining by 5.7 % in 2005 to RM265.8 mil on the back of a 10.4%-drop in turnover to RM1.54 billion (see Table 1 below).


Table 1: Gamuda's past 5 years' result

From the past 5 quarters' result, we can see that the decline in its net profit & turnover has been arrested (see table 2 below).


Table 2: Gamuda's last 5 quarterly results.

The long-term technical picture may start to improve in line with recovery in earning going forward as well as more contracts expected to be secured under the 9MP. From Chart 1 below, we can see that the downtrend in Gamuda's share price since Oct 2003 until today (with share price dropping from a high of RM8.00 to a low of RM3.00) is very similar to its downtrend during the Asian crisis (from Jan 1997 to Sep 1998), where the share price dropped from a high of RM5.60 to a low of only RM0.59. The share price recovery from the Asian crisis began after the followings were observed:

1. share price has broken above its then prevailing downtrend line;
2. share price has recovered above the 20-month MA; and
3. the monthly MACD has hooked up.

Today, we can see that Gamuda share price is in an advance stage of completing its bottoming process. It has broken above its recent downtrend line (which has commenced in Oct 2003) but it has yet to break above its 20-month MA. The monthly MACD has also not done a positive crossover.

Interestingly, the current bottoming process is likely to yield a double bottom reversal near the RM3.00 level (Note: This is not a done deal!). If so, this will be similar to the bottoming process of Sep 1998, which finished off with a double bottom reversal at the RM0.60 level.


Chart1: Gamuda's monthly chart as at July 24

To get a clearer indication of Gamuda's possible reversal, we shall now look at the weekly chart. The chart shows a downtrend that has yet to be broken. Breakout is at RM4.00. We can see a bullish divergence between the weekly MACD & the share price, hinting of exhaustion in the second selldown to the RM3.00 level. The weekly MACD is also about to do a positive crossover. At the current price of about RM3.50, Gamuda share price has just broken above the 20-week MA. I expect the stock to hold around this level before rallying upward to test the RM4.00 level.


Chart2: Gamuda's weekly chart as at July 24

Based on the foregoing, Gamuda looks like a good stock to invest in. You may like to accumulate the stock in stages; buy half between RM3.50 to 4.00 and the remaining above the RM4.00 level, if the stock is rising. If the stock cannot hold above the RM3.50 level, it may slide back to RM3.00 again (possibly, to do a triple bottom). In this event, you may want to accumulate half between RM3.50 to 3.00 and accumulate the remaining if the stock re-bounce strongly off the RM3.00 level. With the positive news flow from the 9MP, I view the second scenario as not likely.

Updated on 7/27/2006

I am unhappy with my comments regarding the breakout of the recent downtrend line on the monthly chart and the failure to do so on the weekly chart. On second look, the inconsistency was caused by the way the downtrend line was drawn on the weekly chart. I have re-drawn the downtrend line & posted it as Chart 3 below. From Chart 3, we can see that the share did a breakout of its downtrend line at the RM3.75 in the week ending Mar 17. After achieving a high of RM4.26 in the week ending May 12, the stock dropped sharply to a low of RM3.02 during the recent share selldown. The drop was so severe that the share price went below the downtrend line for 2 weeks before recovery.


Chart 3: Gamuda's weekly chart as at July 26

Plantation sector- How far can it go?

The Plantation index gained 39 points to close at 3455 yesterday (July 24). This is only 2 points shy of the high of 3457 recorded in Sep 1994 (see Chart 1 below). At 9.10 a.m. this morning, the Plantation index was at 3460 and may well be on its way to test its all-time high of 4044 recorded in the month of Jan 1994 (at the peak of the 1993 bull).


Chart 1: Plantation's monthly chart as at July 24

This morning, a few plantation stocks has surpassed their May highs, which in turn are their respective all-time highs. These stocks are PPB Oil, KL Kepong & IOI Corp. KL Kepong's parent i.e. Batu Kawan has also made a new high after surpassing its recent all-time high that was recorded in Feb this year. I have appended below their monthly charts for your viewing (see Chart 2, 3, 4 & 5).


Chart 2: PPB Oil's monthly chart as at July 24


Chart 3: KL Kepong's monthly chart as at July 24


Chart 4: IOI Corp's monthly chart as at July 24


Chart 5: B Kawan's monthly chart as at July 24

It is worth noting that most of the government-linked plantation companies such as G Hope, High & Low and K Gurthrie have yet to made a new high. So are some big plantation counters such as Asiatic & United Plantation. It would be interesting to see whether these counters would be able to break above their all-time high when the Plantation index finally tests the 4000 psychological level & its all-time high of 4044. At this moment, one stock that interests me is Rimbunan Sawit, a Sarawak-based plantation company that was listed last month. Its IPO price was RM1.00 and Kenanga has a fair value of RM1.50 for this stock. Based on the chart below (Chart 6), the stock has a recent high of RM1.37. This morning, it surpassed this high & momentarily touched a high of RM1.40. From a technical point of view, this stock looks very "tradable".


Chart 6: RSawit's daily chart as at July 24

Monday, July 24, 2006

PBB's technical picture looks interesting

PBB recently reported a very good set of result for 2Q2006. Its net profit increased 23.6% y-o-y to RM452.7 mil from RM366.2 mil recorded in 2Q2005. Topline also grew by 28.4% from RM1.415 billion to RM1.816 billion. When compared to the immediately preceding quarter (1Q2006), PBB's net profit has increased by 17.1% q-o-q from RM386.6 mil while the topline has increased by 6.7% q-o-q from RM1.702 billion.


PBB has been consolidating for the past 17 months i.e. after making a high of RM7.80 in the week ending Feb 18, 2005. The pattern of the share price consolidation takes the shape of a descending triangle, with the base at RM6.20. Since the 2Q 2006 result annoucement on July 20, the share price has broken above the declining overhead resistance at the RM6.55 level. If the share price can hold above the level for another day or so, the stock would have a bullish breakout (see Chart 1 below). You can see that the weekly MACD is also poised to do a positive crossover.


Chart 1: PBB's weekly chart as at July 20

I have also attached PBB's month chart (Chart 2 below) to show how the stock has performed in the past few years. The stock made a low of RM0.80 in August 1998 and since then, it has been on a steady uptrend until its Feb 2005 high of RM7.80. By plotting the 10- & 20-week MA, we can see that the current consolidation is nearing its completion.


Chart 2: PBB's monthly chart as at July 21

Finally, I would also like to point out that PBB has 2 quotations i.e. PBB and PBB-01; the former is a local share while the latter is a foreign share. Due to current poor sentiment, PBB & PBB-01 have been trading at about the same price. In fact, PBB & PBB-01 closed at RM6.60 & RM6.50 respectively, on Friday (July 21). In a bullish period, when foreign funds want to invest in PBB, they will only buy PBB-01 because their mandates require them to buy only stocks that give them a voting right i.e. PBB-01. During such period, they will bid aggressively for PBB-01. In the past, this has led to buyers offering a premium for the foreign shares, PBB-01. At the peak of the PBB share price over the past 5 years, the premium offered are RM0.40 for w/e Feb 28, 2005 [RM8.20 cf. RM7.80]; RM0.74 for w/e Jul 31, 2002 [RM5.12 cf. RM4.38]; and RM1.13 for w/e Feb 29, 2000 [RM5.76 cf. RM4.63]. The monthly chart for PBB-01 is shown below as Chart 3.

Based on the above, PBB looks like a BUY. I prefer PBB-01 to PBB for reason stated above.


Chart 3: PBB-01's monthly chart as at July 21

Market Outlook as at July 24 2006

Last Friday (July 21), the CI closed at 924.72, gaining 8.1 points. Gainers out-numbered losers 348 to 316. Volume of shares traded was 535 million units.

On Friday, I have posted a comment that if the CI can close above the 20-week MA (wrongly stated as 20-day MA) at the level of 923, we may consider the test of the low as successfully completed and a recovery may be at hand. With the Friday close at 924.72, this condition has been satisfied eventhough the volume of shares traded and the market breadth are not too convincing.

The market that will worry traders in the next week or so will be Mesdaq. A consolidation is underway after the Mesdaq index did a double top at 128 on July 13 (see the Chart below). I have noted in a post dated July 12 entitled "What's up with Mesdaq?" that the Mesdaq is about to do a double top & then, consolidate. To wit:

"My feeling is that the first attempt at the 128-130 levels, which may happen in the next 2 or 3 days, is unlikely to succeed. Why do I think so? I believe that Mesdaq's current rally at the present pace is unsustainable. The 128-130 levels would be a good point for Mesdaq to take a pause. The Mesdaq may pullback to the 120 horizontal support level or even to the 110 uptrend line support before re-testing the 128-130 levels later..."


Chart: Mesdaq's daily chart as at July 21

Since the 120 level was broken, Mesdaq is now on the way to test the supports of 111 (the low end of the gap-up that happened on June 22) and 108/109 levels (horizontal & uptrend line supports). A break below the 108/109 levels would mean that Mesdaq's consolidation would last much longer. It may drop to the 105 support level, which is the low recorded during the May/June correction. Thereafter, the next support level would be the strong psychological level of 100. Hopefully, the Mesdaq's consolidation would not be too bloody and does not break below the 108/109 level.

Friday, July 21, 2006

Eksons- a good buy at its uptrend line

Eksons is involved in the manufacture & sale of veneer, plywood & sawn timber. It is a profitable company with an EPS of about 21 sen (based on the cumulative EPS for the past 4 quarters). Based on its closing price today (July 21) of RM0.945, it is trading at a PE of only 4.5 times only (see Table below).

Eksons has recently proposed to carry out a capital repayment of 20 sen. In addition, it will be venturing into a new business i.e. property development via a JV company. The share price has dropped since these announcements, from a high of RM1.27 on June 29.

From the chart below, you can see that the stock is now at its short-term uptrend line. This would be a good entry level as the share is likely to re-bounce from the uptrend line support. If this support failed to hold, the next support will be at RM0.90. If that also failed, you should cut loss & move on.


Chart: Eksons' daily chart as at July 20

Courts- a takeover target in the making

Business Activities

Courts Mammoth Bhd (“Courts”) is involved in the retailing of electronics & electrical appliances and household furniture & furnishings. It operates in Malaysia & Indonesia.

Past Financial Performance


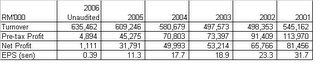
From the above, we can see that Courts’ net profit has been declining over the past 5 years. In 2006, Courts recorded a miniscule bottomline of only RM1.1 million. This is despite a recovery in turnover since 2004. The recovery in the topline is attributable to higher turnover from its Indonesian’s operation, which Courts had acquired in 2004 from its parent, Courts plc, (which had then run into financial difficulties). The Indonesian operation had contributed 14.0% and 9.7% of Courts’ turnover and operating profit, respectively in 2005. In 2006, the Indonesian operation had contributed 19.7% and 48.2% of Courts’ turnover and operating profit, respectively.

Current Financial Performance


If you compared the last 4 quarterly results with the preceding 4 quarterly results, you can see that turnover has increased by 4.3% from RM 609.1 mil to RM 635.5 mil. Unfortunately, net profit plunged 96.3% from RM30.2 mil to a mere RM 1.1 mil. EPS has similarly plummeted from 10.71 sen to 0.39 sen. The decline in profitability has been attributed to lower profit margin and higher provision for doubtful debts.

Courts- a target for takeover

The receiver [KPMG Corporate Finance (UK)] appointed to manage the affairs of Courts plc has invited bids to buyout its 50.1%-stake in Courts. A sale would automatically entail a mandatory offer by the buyer of all outstanding shares of Courts. The bids were received by the receiver in September 2005 and a decision is pending.

Valuation

Since the financial performance of Courts has shown little signs of a turnaround (except for the Indonesian operation), I think a buyer would value the company on a break-up basis.

Using the unaudited balance sheet as at 31/3/2006, I have discounted the various assets of Courts and arrived at a "fair value" of RM1.12 per share. I have discounted the assts as follows: 100% for goodwill, 50% for inventories, 25% for receivables, 10% for deferred tax & tax recoverable (see Table 1). Fixed Assets ("F.A.") has been discounted as follows: 100% for renovations, 60% for furniture & fittings, 40% for motor vehicles and 20% for properties. As no F.A. breakdown was given, I had assumed that the breakdown is proportionately similar to that of FYE 31/3/2005 (see Table 2). The "fair value" of RM1.12 is 42% lower than Courts' book value as at 31/3/2006.


Table 1: Computation of "Fair Price" per share.


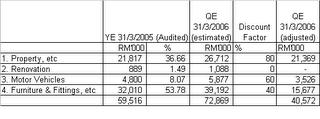
Table 2: Computation of F.A.'s fair value

Technical Outlook

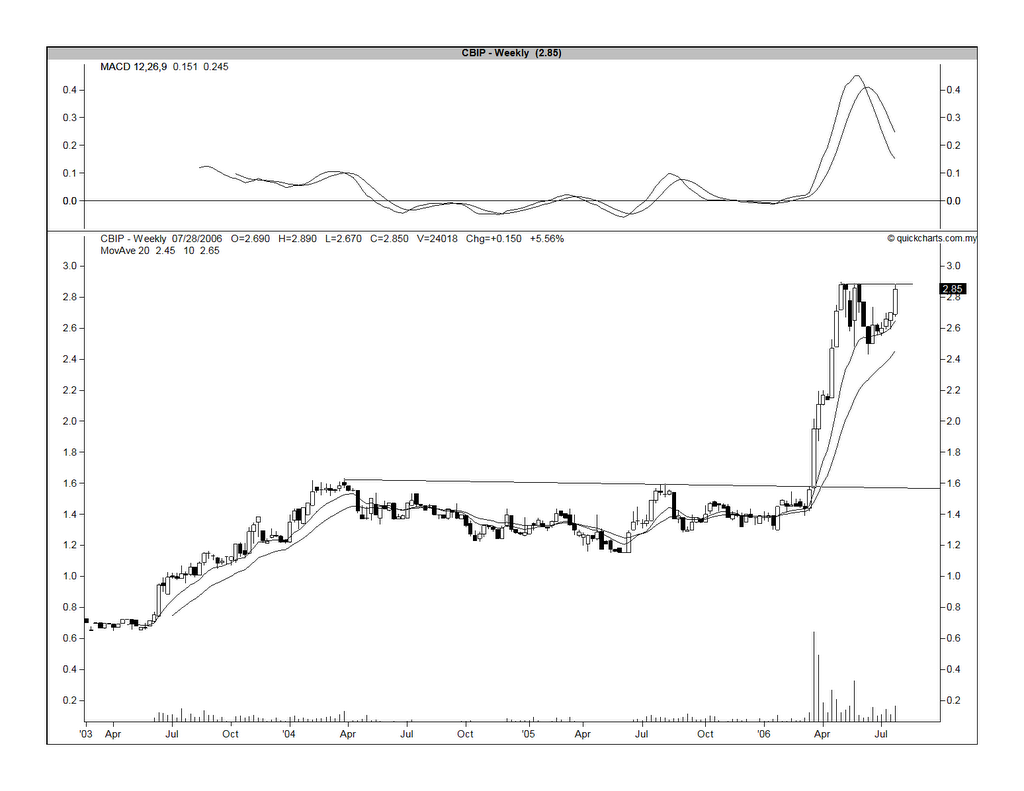
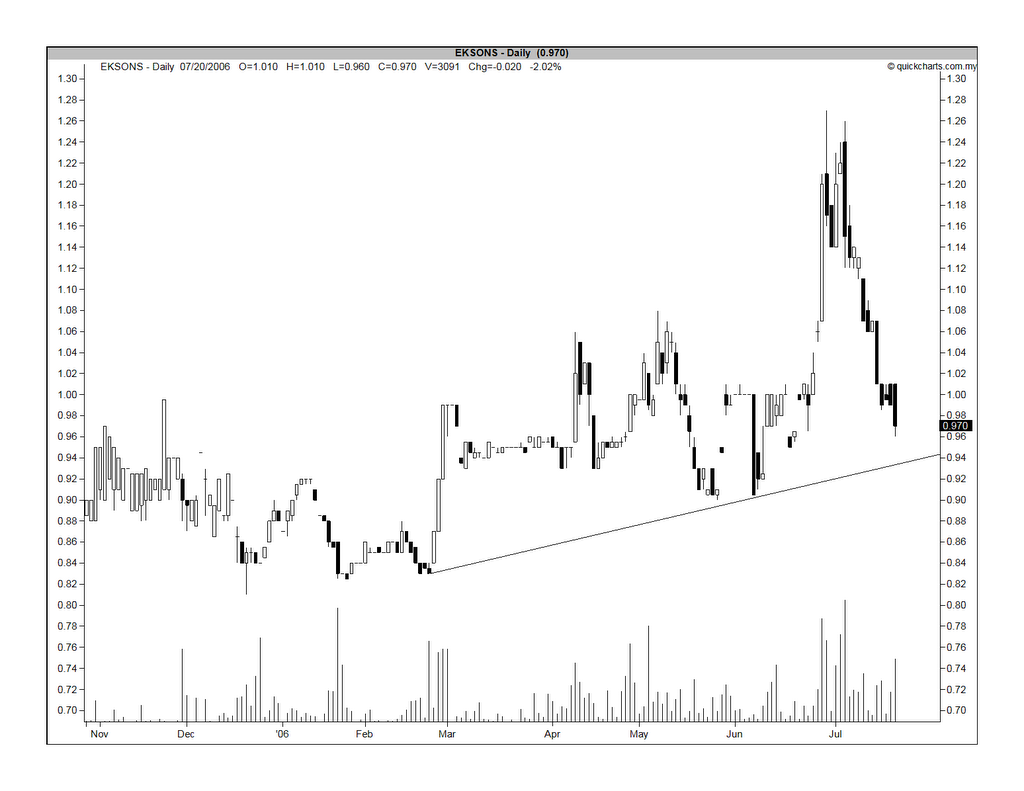
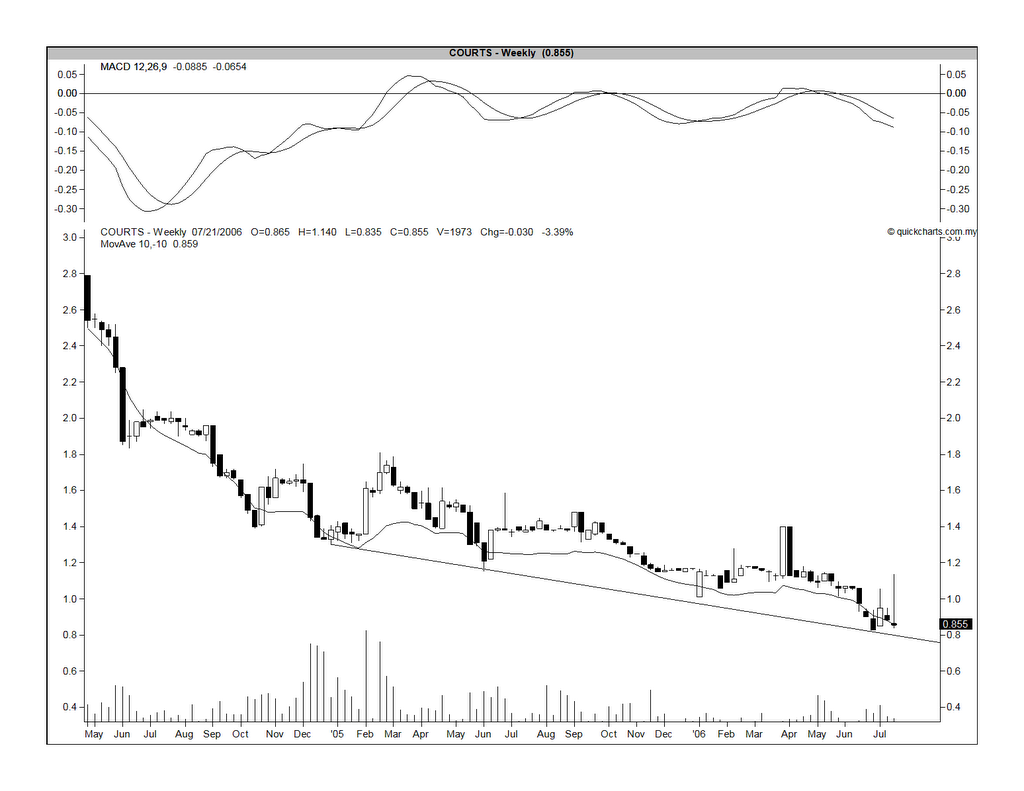
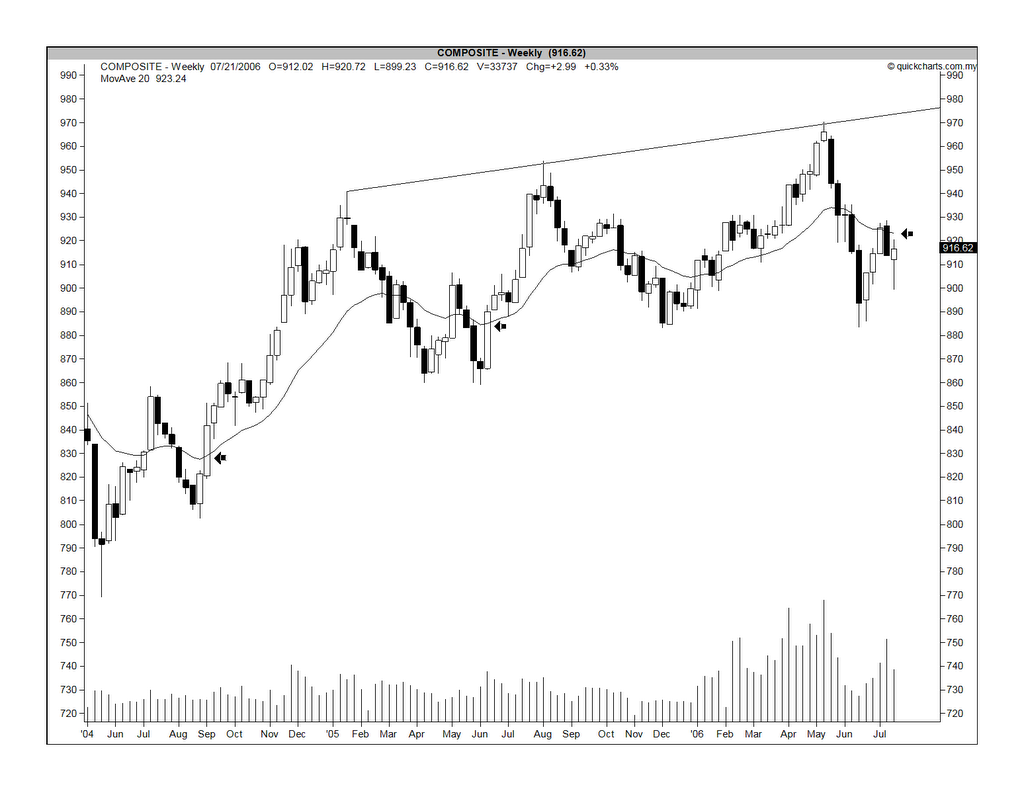
The chart below shows that the stock is in a downtrend. A line plotted against the troughes (since October 2004 up to today) indicates that the stock has some support at the RM0.80 level. A 20-day MA (shifted 10% downward) seems to also show that the RM0.80 level to be a good support level.


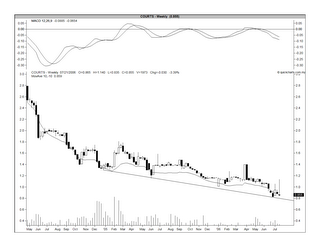
Chart: Courts' weekly chart as at July 20

Risks

No attempt has been made to calculate the cost of closing Courts' operation. The closure cost could be substantial. Similarly, no attempt was made to estimate the fair value of its profitable & fast-growing Indonesian operation. This business is very promising and could easily fetch a premium above its book value.

Recommendation

Based on the above, I believe Courts to be a good buy at the RM0.80 level. Assuming that the takeover price is set at RM1.12, your return would be about 40%. Timeframe is about 9 to 12 months.

UDA- an alternative to putting money in FDs

If you are tired of earning only 3.25% per annum from putting your money in FDs but you are not ready to take a plunge into the stock market due to the high volatility, I may have something for you to consider.

I would recommend that you take a look at a property stock named UDA, which Khazanah is taking private at RM3.00 per share. Since the proposal was announced on June 30, UDA has been trading at a range between RM2.81 and RM2.85 (see the Chart below). It closed at RM2.81 yesterday (July 20). I expect the entire privatization exercise to be completed within 6 months’ time. What kind of return are we looking at? Assuming that you manage to buy UDA at a price of RM2.81, then your gross return is about 6.76% (or net of 5.76%, after deducting 1% for brokerage, stamp duties & clearing fee). Since the holding period is only 6 months, your return is actually higher at 13.52% (gross) or 11.52% (net) per annum.


Chart: UDA's weekly chart as at July 20

The Test of the Low is nearing its successful completion

On July 17, I have posted a piece on the test of the low for our market. In it, I have written that I would considered a test of the low successfully completed when the index recovered above the 20-day MA i.e. when the CI surpasses the 920 level. On closer examination, that level is about 923 (see the Chart below). At 11.00 a.m. today, the CI touched a high of 922.77 mark. Losers outnumbered gainers 290 to 212 while volume of shares traded is about 227.5 million at 11.54 p.m.

We will see whether the CI will re-test the 923 level later and surpass it. If so, the market's current correction could be over.


Chart: CI's weekly chart as at July 20

Thursday, July 20, 2006

Digi's net profit jumped 77% in 2Q06

Digi posted a 77%-jump in net profit y-o-y to RM200.6 million in 2Q06 from RM113.49 million last year. The strong performance was due to a high subscriber growth, which contributed to a revenue growth of 31.75% y-o-y to RM903.69 million in 2Q06 from RM685.88 million in 2Q05. Its customer base rose 44% to 5.44 million in the 2Q06 from 3.77 million a year earlier. The increase in customer base for 2Q06 was a bit slower at 354,000 when compared to increases in previous quarters.

Digi's earnings per share for the six month period grew to 51.4 sen from 22.9 sen a year earlier. On an annualised basis, its earning will amount to 102.8 sen per share. Based on its closing price today (July 20) of RM11.50, its PE stands at only 11.2 times only.

In addition, Digi has also declared an interim gross dividend of 53.5 sen per share. This will be Digi's first dividend for the current financial year. The shareholders can also look forward to another big "payout" in the form of a second capital repayment of 60 sen per share. Digi has completed its first capital repayment of 75 sen in May this year.

With all these good news, I believe that Digi's share price is likely to rally further in the days ahead.

Note: I like to correct an error in my first post on Digi where I've mentioned that there were only 3 applicants in the tender for the wireless broadband spectrum known as WIMAX. Subsequent newspaper reports indicate that the total number of applicants were 17 and these include big names such as Maxis and Telekom Malaysia. In such a crowded field and with only 3 spectrum blocks up for grab, it may not be fair to assume that Digi is a frontrunner.

Digi makes an all-time new high!

One day after my article entitled "Digi caught in a bind", Digi makes an all-time new high. Before this, Digi's all-time high was at RM11.30 chalked on July 7, 2006 (see the Charts below). At 4.00 p.m., the stock is at RM11.50.

For technical analyst, a stock that makes a new high is a bullish stock. As a rule, you should consider buying such stocks and not selling them. This is contrary to my earlier post, which has suggested that you should consider paring down your position in Digi. How should we resolve this conflicting situation. I would suggest the following:

1. Ignore the technical buy signal. Do not buy into Digi.
2. Instead of selling into strength, hold back the selling of Digi until the share price has dropped below a pre-determined level. What should that level be? You may want to set that price at a certain amount, say RM1.00, below the preceding day's closing price. If you set this price too tightly (say at RM0.50 lower), chances are that you would be "stopped out" fairly early. If you set it too loosely (say at RM2.00 lower), you would be giving away too much profit.

After that, you need to monitor the share price closely to ensure that the stock has not broken down & triggered your pre-determined "stopped out" level. For those who has this stock, stay with it & ride it all the way. Good luck.


Chart 1: Digi's monthly chart as at July 19


Chart 2: Digi's daily chart as at July 19

Wednesday, July 19, 2006

Digi caught in a bind

Digi.com Bhd ("Digi"), the telecommunication company that has been a darling for investors, is now caught in a bind. The problem has arisen because its major shareholder i.e. Telenor ASA is required to pare down its stake in Digi by the end of the year from 61% to 49%.

Being a foreign-owned telco has also presented problem in a very strategic way. Some believe that its foreign-owned status could well be the reason that it was not successful in the second round of 3G license award completed earlier this year. The 2 new licenses were awarded to MITV and Time.com.

Yesterday, another surprise awaits Digi when the government cancelled the tender for the wireless broadband spectrum, known as WIMAX. The applicants in this tender were Digi, REDtone CNX Broadband Sdn Bhd (a subsidiary of REDtone International Bhd) and NasionCom Holdings Bhd. Again, Digi stood out when compared to the other 2 applicants and would appear to be a clear favorite. I believe that because of Digi's frontrunner position, the government may find it easier to cancel the tender than to refuse granting the license to Digi.

Where does that leave Digi? One possible solution which may solve Digi's problem of foreign-owned status as well as gaining a 3G license is to buy into Time.com. Digi has indicated that it does not agree to this but, given the present circumstances, does Digi has a choice? This uncertainty may translate into weaker share price for Digi. If Digi were to change its mind & buy over Time.com, the expected high price of Time.com may cause many foreign funds to unload their Digi shares. If nothing is done, Digi's strategic picture may become cloudier and, again, some funds may choose to take profit, especially since they are sitting on quite sizeable profit in this investment. So, for investors out there, it may be good time to pare down on your investment in Digi before the bigger fish gets nervous and rushes for the door.

Magnum looks promising

A few interesting things happened in Magnum lately. They are:

1. Magnum has cancelled 133 million treasury shares (equivalent to 8.42% of its share capital) last month;
2. It has also completed its disposal of a Hong Kong-based subsidiary which resulted in the settlement of a HK121.2 million inter-company loan last month; and
3. Its performance has also improved due to lower payout ratio and increased market share. The latter may be attributable to the introduction of mBox 4-D permutation game (see the Table below).


All these could well put this stock back into investors' radar screen. The cancellation of the treasury shares would be earning accretive while the settlement of the inter-co loan would finally put an end to the issue of corporate governance that had hobbled Magnum since the Asian crisis.

Magnum's share price movement yesterday (July 18) and this morning is very interesting. Yesterday, Magnum gained 4 sen to close at RM1.89 on a volume of 34806 lots (highest volume traded for the past 3 months). This morning, Magnum share price went as high as RM2.07 before closing at RM2.03 (gaining 14 sen). Volume traded up to 3.00 p.m. was about 71000 lots. The share price was weaker due to new development in the Middle East, which saw Isreali tanks entering Lebanon.

From the chart below, you can see that the share price has been tracing out a bottoming process that looks like a diamond formation. A break above RM2.06/2.07 could signal the end of the downtrend that begun in March 2004. If this stock were to recover over the next few days and surpass the rising overhead resistance, I would recommend that you buy this stock.


Chart: Magnum's weekly chart as at July 18

Tuesday, July 18, 2006

What is the Test of the Low?

What's a Test of the Low? How did it come about?

A test of the low is a phrase that describes one of the few ways in which the bottoming process is carried out. The completion of the bottoming process will often create a pattern, called the reversal pattern, that is easily recognisable, such as double bottom, triple bottom, rounding bottom, head & shoulder, diamond formation and V-spike. Of these reversal patterns, the double bottom is fairly common and it comes about because the market has dropped to its recent low and bounced back (which is a successful test of the low).

A test of the low is grounded on fairly sound psychological reasoning. After a market has bounced off a low, the market is still encumbered with a lot of "trapped" investors who are waiting for the market to go higher before disposing their shares. Some will sell their shares as the market inches upward while other will sell after the market has reached its apex and started dropping. The selling will gain momentum as recently acquired shares are also offered for sale. At this stage, fear will takeover and the market is well on its way to test its recent low.

On the other hand, there are also a group of potential investors who missed buying any shares when the market made its last low. These investors will begin to buy into the market when the prices started to drop closer to their desired entry level. At the recent low (or, somewhere near the recent low), these buyers and sellers will meet & their supply & demand will determine whether we have a successful test of the low or a failed test of the low.

Example of a Test of the Low

From the chart below, you can see that I have highlighted 2 recent tests of the low, other than the present test of the low. The first one was in August 2004 when the CI dropped to a low of 802, which is quite far from the preceding low of 769 recorded in May 2004. In this case, the buyers out-numbered the sellers & the prices recovered long before they reached their recent low. The next test of the low was in May 2005 when the CI dropped to a low of 860, which was the exact level of the preceding low in April 2005.

From this, we can say that the test of the low may not necessarily end at the preceding low before a re-bounce happens. It may recover before hitting the recent low and, in the case of a failed test of the low, it will surpass the recent low.

When is a Test of the Low successfully completed?

I would considered a test of the low successfully completed when the index recovered above the 20-day MA. If you want to be more stringent, you may want the index to surpass the preceding high. So in the example of the test of the low in August 2004, the 20-day MA is 828 while its preceding high was 858. For the test of the low in May 2005, the 20-day MA was at 885 while its preceding high was at 906. The current test of the low would be deemed successfully completed if the CI can surpass its 20-day MA at 920 level or its recent high of 928.

Can you buy at lower level before a Test of the Low has been successfully completed?

Yes, you may buy at (or, near) the recent low but you need to exercise good money management & "cut loss" if the index dropped below the recent low by a pre-determined percentage.


Chart: CI's weekly as at July 17

Market Outlook as at July 18 2006

As at 12.00 noon, the CI has jumped by 8.98 points to 911.68. Gainers out-numbered losers by 487 to 113. Volume of shares traded is 427.7 million units.

I view the current market action as a mere re-bounce since its short-term uptrend has already broken. You may also note that the MACD indicator has also done a negative crossover, which is a SELL signal. The immediate resistance is at 913, where the market may close the gap created yesterday (July 17). Thereafter, the next resistance will be at 919/920 levels (see Chart below). I believe this re-bounce is likely to run out of stream between the 913 & 920 levels. As such, I would recommend those who are overweight the market to sell into this rally.

Monday, July 17, 2006

Should we be afraid of Stagflation?

To the laymen, stagflation is what happens when you have little economic growth but a good bit of inflation. If that sounds a bit too vague, it is because there is no specific definition of stagflation, unlike recession or inflation. An article by Ticker Sense, a blog affiliated to Birinyi Associates, entitled "The Implications of Stagflation" has attempted to define what's stagflation; and to look at how long it normally lasts as well as how much it impacts the stock markets.

They define stagflation as "any period of two quarters or more in which y/y CPI was above the overall average since 1948 and y/y GDP growth was below its overall average since 1948".

The average stagflation lasts about 8 quarters with the shortest lasting about 4 quarters. To measure stock performance, the stagflationary period is divided into 2 halves. During the first half of a stagflationary period, stock performance is generally negative (-11%) while performance in the second half is generally positive, with an average gain of 21% (see the Chart).


The article, however, did not provide any statistics on the stock performance prior to the stagflationary period. The stock market, being a leading indicator, would have adjusted easily 2 or 3 quarters before stagflation set in. If we were to factor in the loss incurred prior to the stagflationary period, the overall loss would likely to exceed 11% and possibly surpassing the average gain of 21% recorded during the second half of the stagflationary period. Otherwise, why should investors fear stagflation?

Chartwatchers- a good source for technical outlook on US markets

One of my favorite link for technical outlook on the US markets is the Stockcharts Newsletters known as Chartwatchers ( a link is provided). You do not have to be a subscriber to take a peek into the market posture of some of the best minds in the field of technical analysis. The panel of experts includes such names like John Murphy, Carl Swenlin, Chip Anderson, Richard Rhodes and Arthur Hill. Twice a month, an extract of their articles would be posted on Chartwatchers and you could get a pretty good idea of how the markets are performing or what directions they may be heading.

For example, in the latest issue dated July 15, John Murphy has an article entitled "S&P 500 Tests Major Uptrend" where he wrote: "The S&P 500 is bearing down on a two-year support line that starts in the summer of 2004. A break of that important support line would signal a drop to last October's low at 1168. That would be the first double digit percentage loss since the bull market started more than three years ago. I think the odds are pretty good that it's going to happen."

In the same issue, you have an article entitled "Split Market" by Carl Swenlin, who feels that the S&P 500 remains in a bull market while he has no hesitation in saying that the Nasdaq has entered a bear market.

Go to here for the current issue of the Chartwatchers.

CI testing the 900 mark.

At 10.00 am, the CI was at 900.21 i.e. dropping 13.42 points from last Friday's close of 913.63. The 900 level is a strong psychological support level & I do not expect it to give way without a fight. However, I am not sure that this level would hold out for too long. I am working on the assumption that the market is now doing the test of the low and this means that the market may go near to the June low of 883 (see Chart 1).


Chart 1: CI's daily chart as at July 14

The Mesdaq has fallen by 4.39 points to 114.88 at 10.00 am. You can see that last Friday's sharp fall has broken the Mesdaq's short-term uptrend line at the 125 level. The next support for the Mesdaq is either at its medium-term uptrend line of 108/109 levels or the horizontal support of 111 level. The 111 level represents the lower end of the gap created on June 26 when Iris' designation was removed. This action sparked the sharp rally on the Mesdaq until last Friday.


Chart 1: Mesdaq's daily chart as at July 14