This is a personal weblog, reflecting my personal views and not the views of anyone or any organization, which I may be affiliated to. All information provided here, including recommendations (if any), should be treated for informational purposes only. The author should not be held liable for any informational errors, incompleteness, or delays, or for any actions taken in reliance on information contained herein.
Friday, March 30, 2007
Astino maintained its good performance
Astino is involved in the manufacture & sale of metal roof sheets & other building related products.
Recent Financial Results
Astino has just reported its quarterly result for QE31/1/2007, where its net profit increased 7.6% q-o-q or 193% y-o-y to RM5.3 million while its turnover increased by 14.2% q-o-q or 43.1% y-o-y to RM72.9 million. When we compared the last 4 quarters with the preceding 4 quarters, we can see that its net profit has increased by 94.5% from RM8.5 million to RM16.5 million while its turnover has increased by 36.7% from RM200 million to RM274 million.
Valuation
Based on the last 4 quarters' EPS of 13.1 sen & Astino's closing price of RM0.67 as at March 30, Astino is now trading at a PE of 5.1 times. This is an undemanding multiple for any stock, even a small-cap such as Astino.
Technical Outlook
Astino's technical picture has not been exciting for a long while until end of December last year. This was when the stock has finally broken above its long-term downtrend line at the RM0.53/55 level. After a sharp run-up in the share price to RM0.80, the share has corrected back to the RM0.50 level! For the past 1 month, the stock has been rising steadily, with support at RM0.64/65 & RM0.60. These could be good entry level for this stock
Chart: Astino's daily chart as at March 30
Conclusion
Astino is an attractive small-cap stock. Its technical outlook may have turned positive as its share price had finally broken above its downtrend line. Based on this, Astino is a good BUY for medium-term investment.
VS may chalk up a turnover of RM1.0 billion for FY2007
V.S. Industry Bhd ('VS') is integrated electronic manufacturing solutions provider for Original Equipment Manufacturer ('OEM') of office & household electrical & electronic products. The VS group, which includes an associate that is listed on the Main Board of the Hong Kong Stock Exchange, has manufacturing facilities in Malaysia, China & Indonesia that employ a workforce of 15,000.
Recent Financial results
VS has just reported its quarterly result for QE31/1/2007. For that quarter, its net profit increased 3.0% q-o-q or 204% y-o-y to RM16.6 million while its turnover increased by 8.7% q-o-q or 63.3% y-o-y to RM265 million. When we compared the last 4 quarters with the preceding 4 quarters, we can see that its net profit has increased by 138% from RM20.1 million to RM47.7 million while its turnover has increased by 35.6% from RM641 million to RM870 million.
If VS can maintain its 1H2007 performance for the rest of FY2007, VS may be able to report a net profit of RM65 million on a turnover of RM1.0 billion. Its EPS may hit a high of 47.5 sen.
Valuation
Based on the foregoing projected performance & today (March 30)'s closing price of RM2.32, VS is trading at a PE of 4.9 times. I believe that this PE multiple is low & VS could trade up to a PE multiple of 10 times or more.
Technical Outlook
VS is in a long-term uptrend since September 2005. The share price has however entered in a sharper uptrend since September last year. This latter uptrend (which is classified as a medium-term uptrend) will provide support for this stock at RM1.90. Its recent high was about RM2.33 at the end of January this year.
Chart: VS' daily chart as at March 30
Conclusion
Based on attractive valuation & bullish technical outlook, VS is a good stock for medium-term investment.
Thursday, March 29, 2007
3 new CWs to be listed on Tuesday- PBB-CB, Tenaga-CE & YTL-CB
As the new CWs were issued at a higher premium that the existing CWs, they are not likely to trade at a price higher than their IPO price, unless the underlying share price goes up significantly.
Don't cry for Shanghai
Chart 1: SSECI's intra-day chart as at 11.30 p.m. ET
What does this mean? From Chart 2 below, we can see that SSECI is trapped in a consolidating pattern (in the shape of an ascending wedge). A break above 3200 would signal the continuation of its prior uptrend, which has to be confirmed over the next few days to see whether this breakout is genuine or otherwise. Nevertheless, it is a humbling experience to see that the direction of a stock market cannot be changed or controlled by government's intervention, even one as omnipotent as the Chinese government.
Chart 2: SSECI's daily chart as at March 28
The Chinese government has been feeling very uneasy about the state of its economy & the many bubbles, including the stock market bubble. You can read more about this in a recent article by Stephen Roach of Morgan Stanley (here).
Wednesday, March 28, 2007
Nextnat reported steady growth in topline & bottomline
Nextnation Communication Bhd (“Nextnat”) is principally involved in the development & provision of engine/solution for mobile gaming as well as the provision of Internet and wireless technologies & related value-added services. The group has developed a full service mobile game engine for interactive mobile game development, hosting & worldwide deployment, which enables it to strengthen its foothold in this fast-growing field.
Note: I've posted on this stock in October last year, but the stock has not moved up much since the post (here).
Recent Development
In early March, Nextnat was in the news, in an unfavorable way. One of its subsidiaries, Nextnation Communication Berhad was penalized by the Malaysian Communications and Multimedia Commission ('MCMC') for spamming activity. Nextnat has explained that the spamming activity was the act of its partner content providers, as the subsidiary concerned is only a mobile application service provider. The infringement has since been rectified & Nextnat does not expect the incidence to have a material financial impact (go here for Nextnat's announcement on this matter).
Recent Financial results
Nextnat has just announced its result for QE31/1/2007. For that quarter, its net profit increased by 25.2% q-o-q or 48.2% y-o-y to RM6.4 mil while its turnover gained 4.2% q-o-q pr 60.4% y-o-y to RM28.2 mil (see Table 1 below).
Nextnat's past 3 years' performance has been very impressive. From Table 2 below, we can see that its turnover has increased by about 50% for the past 2 years while profit after tax has grown by about 33% fro the same periods. (Comparison for the latest FY2007 is based on an annualized 12 months period).
Valuation
Based on the last 4 quarters' results, Nextnat's full-year EPS is about 8.2 sen. At a closing price of RM0.58 (as at March 28), Nextnat is now trading at a PE of 7 times only. This is very attractive for a company with such a strong growth record. I think the fair PE multiple for this stock is of at least 12-15 times, which would place the target price for Nextnat at RM1.00-1.20 level.
Technical Outlook
Nextnat's share price does not, however, reflect its otherwise good financial performance. For the past 5 months, the share price has been in a downtrend with resistance at RM0.60. A break above RM0.60 could be the beginning of better times ahead for this stock. Or, is it another false move, like the false bullish breakout in mid-February, only to be followed by a false breakdown a few days later? I think we have to live with that risk & still proceed to act on a BUY signal if the share price were to break above RM0.60.
Chart: Nextnat's daily chart as at March 28
Conclusion
Nextnat is a very attractive stock, trading at a PE of 7 times. While the technical outlook is nothing to shout about, I believe the stock is worth track for slow accumulation now or for buying if it break above the RM0.60 level.
Adventa reported higher net profit for QE31/1/2007
Adventa Bhd ('Adventa') is involved in the production of disposable medical gloves.
Recent Financial Results
Adventa has just announced its results for QE 31/1/2007, which shows continued improvement in its financial performance.
For the QE 31/1/2007, its net profit jumped by 124% q-o-q or 41.0% y-o-y to RM5.7 mil while its turnover increased by 4.3% q-o-q or 74.1% y-o-y to RM47.9 mil. When you compare the last 4 quarters with the preceding 4 quarters, you can see that net profit has grown by 12.8% from RM13.6mil to RM15.3 mil while turnover has increased by 37.6% from RM126mil to RM174 mil.
Valuation
Based on the last 4 quarters' result, we see that Adventa has reported an EPS of 12.13 sen. At its closing price of RM0.84 as at March 28, Adventa is now trading at a PE of 7 times only. That's fairly attractive.
Technical Outlook
The technical picture of Adventa is however not exciting. The share price appears to be drifting down. If the share price can break above the 200-day SMA at 94 sen (also, its downtrend line), then the outlook may improve (see the chart below).
Chart: Adventa's daily chart as at March 28
Conclusion
Adventa is a relatively attractive stock, trading at an undemanding PE multiple of 7 times. Technically, the share price movement has yet to issue a BUY signal. For this to happen, it needs to surpass the RM0.95 level for reason given above.
KLCI dropped 17 points to 1230 at 4.00 p.m.
Chart 1: SSECI's intra-day chart for Mar 28
For our KLCI, the immediate uptrend line support at 1235/40 was broken. I see horizontal supports at 1220 & 1215 as well as at the important psychological 1200 level (see Chart 2 below).
Chart 2: KLCI's daily chart as at Mar 27
Tuesday, March 27, 2007
JTiasa enjoyed another good quarterly result
Jaya Tiasa Holdings Bhd ('JTiasa') is involved in the extraction of timber logs, downstream processing of timber products and the cultivation of oil palm. Its timber concession area, which measured 1.76 million acres, is located in Sarawak. Its timber processing division has annual capacity to produce 360,000 cu metre of plywood; 324,0000 cu metre of rotary veneer; 108,000 cu metre of sawntimber; 12,000 cu metre of blockboard; 6,000 cu metre of film overlay; and 6,000,000 square metre of sliced veneer. Its oil palm division has a total area of 83,480 hectares, of which only 12,000 hectares are planted & only a small portion of it is matured.
Recent Financial results
JTiasa has just reported its results for QE31/1/2007 last week. For that quarter, its net profit jumped by 14.6% q-o-q or 221% y-o-y to RM38.7 million while its turnover increased by 9.9% q-o-q or 14.3% y-o-y to RM227 million. The sharply higher net profit is attributable to higher selling prices for its timber products & logs.
When comparing the last 4 quarters' results with the preceding 4 quarters, we can see that JTiasa's net profit has jumped two folds from RM34.1 million to RM103.7 million on the back of a 27.7%-increase in turnover form RM653 million to RM835 million.
Valuation
If JTiasa's last 2 quarters' performance can sustain, it may report a full-year EPS of 56 sen. Base on this & its closing price as at March 26 of RM4.52, JTiasa is now trading at a PE of 8.1 times. At this multiple, JTiasa is deemed attractive with an upside target of RM5.60.
Technical Outlook
JTiasa's share price appears to move in an upward channel. The lower channel support is at RM3.80 while the upper channel resistance is at RM4.90. The share may drift back & find support at the middle channel at RM4.30. I believe that this would be a good entry level for JTiasa.
Chart: JTiasa's daily chart as at March 26
Conclusion
Based on attractive valuation & the share price's current uptrend move, JTiasa would be a good stock to invest in for the medium-term.
Monday, March 26, 2007
UMcca- a laggard amongst the plantation stocks
United Malacca Bhd ('UMcca') is involved mainly in the cultivation of oil palm & palm oil milling. In addition, it has a 20.9%-stake in another listed company, Pacificmas Bhd ('Pacmas') as well as a 25%-stake in a tile-maker, Niro Ceramic (M) Sdn Bhd. Pacmas is involved in the underwriting of general insurance; unit trust & asset management; leasing & hire purchase; property investment; and, investment holding.
As at the end of FYE2006, UMcca has a land bank of 4,251 acres; comprising 20,263 cres of matured trees and 3,988 acres of immatured palms.
Recent Financial Results
UMcca has just reported its results for QE31/1/2007. For that quarter, its net profit jumped by 61.1% q-o-q or 439% y-o-y to RM20.1 million while its turnover increased by 11.3% q-o-q or 44.2% y-o-y to RM38.7 million. The sharply higher net profit is attributable to an investment gain of RM6.8 million as well as better CPO prices.
When comparing the last 4 quarters' results with the preceding 4 quarters, we can see that UMcca's net profit has jumped 42% from RM31.7 million to RM45.0 million on the back of a 8.6%-increase in turnover form RM113.5 million to RM123.2 million.
Valuation
If UMcca can repeat its performance of the last 4 quarters (but excluding the investment gain of RM6.8 million), it may report a full-year EPS of 29 sen. Based on the closing price for the morning session of RM5.05 (for March 27), UMcca is now trading at a PE of 17.4 times. Fundamentally, this stock is fairly valued.
Technical Outlook
UMcca's share price appears to be in an uptrend line, with support at RM4.54/56 level.
Chart: UMcca's daily chart as at March 26, 2007
Conclusion
As the stock is fairly valued, the only opportunity is to buy when the stock pulls back to its uptrend line support at RM4.54/56. The reward is however not too terrific; maybe a 15-20% gain.
Thursday, March 22, 2007
KLCI to re-test the 1215/20 level
Chart 1: KLCI's daily chart as at March 21, 2007
Chart 2: S&P500's daily chart as at March 21, 2007
The S&P500 has broken below its medium-term uptrend line during the recent correction. The past few days' rally is driven by positive news, such as the neutral bias adopted by the FOMC overnight as well as positive technical development. In the latter category, the most important is the successful test of the lows whereby the market came to its recent low on March 5 and rebounded off that low. Since yesterday's close has breached the overhead resistance formed by the recent reaction peaks (marked in pink), I believe that the current rally in the US market may be more than a mere technical rebound. Nevertheless, I must emphasize again that the medium-term uptrend line has broken and the way forward for the US market will be quite tricky.
Tuesday, March 20, 2007
Scientx's good performance continued
Scientex Inc Bhd ("Scientex") is involved in the manufacture of pvc & pu leather sheeting; trading in building materials & textile products as well as investment holdings. One of its main subsidiaries is Scientex Packaging (a 61.37%-owned subsidiary), which is involved in the manufacture of stretch film; pp & pe woven bags & fabrics bags; flexible intermediate bulk containers as well as corrugated carton boxes.
Recent Financial Results
Scientx's financial performance continued to improve. For QE31/1/2007, its net profit increased by 31.2% q-o-q or 63.0% y-o-y to RM10.8 million. Its turnover has grown by 0.9% q-o-q or 7.6% y-o-y to RM 158 million.
When comparing its performance for the last 4 quarters with the preceding 4 quarters, we can see that its net profit has increased by 33.2% from RM25.7 million to RM34.2 million while its turnover has increased by 8.5% from RM561 million to RM609 million.
Valuation
Based on the past 4 quarters' EPS of 53.5 sen & its closing price of RM4.16 at the end of today (March 20)'s trading, Scientx is now trading at a PE of 7.8 times. I would consider this PE multiple to be inexpensive for a growth stock like Scientx.
Technical Outlook
Scientx has been consolidating for the past 2 months after making a high of RM4.78 in early February. If the stock can surpass the resistance of RM4.28/30 (marked in pink), it could be completing an inverse head-&-shoulder formation (see the chart below).
You may recall that I've called a BUY on Scientx (here) in October last year when it was poised to break above its then-prevailing resistance of RM3.00 (marked in blue).
Chart: Scientx's daily chart as at March 20
Conclusion
Based on steady growth, inexpensive valuation & potential bullish breakout (above the RM4.30 level), Scientx is a good stock to watch & to invest in.
Haio has 2 quarters of impressive results
Hai-O Enterprise Bhd ('Haio') is a well-known name in the field of Chinese medicines, medicated wines & healthcare products. In addition to retailing & wholeselling such products, Haio is also involved in multi-level marketing & the manufacture of pharmaceutical products.
Recent Financial Results
Haio's latest financial results for QE31/1/2007 shows that the group can sustain its improved performance as recorded in QE31/10/2006. For QE31/1/2007, Haio's net profit increased marginally by 0.6% q-o-q to RM5.0 million while its turnover grew by 22.8% q-o-q to RM51.4 million. When compared to the previous corresponding quarter, the net profit jumped by 90.5% while turnover also soared by 40.8%.
Valuation
If Haio can sustain this performance, its full-year EPS will amount to 30 sen. Based its closing price of RM1.92 as at today (March 20), Haio is now trading at a PE of 6.4 times. This means that Haio's valuation is currently undemanding.
Technical Outlook
The stock has been in a gradual uptrend for the past 14 months (see the chart below). A good entry level would be near its 100-day SMA of about RM1.70.
Chart: Haio's daily chart as at March 20, 2007
Conclusion
Based on inexpensive valuation & nice technical set-up, Haio is a good stock to invest in for the medium-term. However, we must note that Haio is a relatively quiet stock with thin daily trading volume.
Monday, March 19, 2007
3 new CWs to be listed on Wednesday- Bursa-CC, Maybank-CD & Maxis-CD
All these CWs were issued on March 7, which is fairly near to the recent market low on March 5. It is an indication of the weakness of the current market that the prices of these blue chips have dropped back almost to the earlier lows despite their recent recovery. As such, all three new CWs are priced at about 10% premium (basing on their IPO price) and, at these premium, they are less attractive than the existing CWs for the same underlying shares. The only possible exception is Bursa-CC, which is slightly cheaper than Bursa-CB but more expensive than Bursa-CA. The latter is however due to expire on April 13.
Based on the foregoing, I expect Bursa-CC to trade at a slight premium (or, gain) to its IPO price while Maybank-CD & Maxis-CD are likely to trade at a slight discount (or, loss) to their respective IPO prices.
Friday, March 16, 2007
MEMS has landed something big
MEMS Technology Bhd ('MEMS') is involved in the manufacture of micro-electromechanical systems ('mems') which are used in a wide variety of fields. MEMS' currents products include pressure sensors & thermopile arrays. The company is now venturing into silicon microphones. The commercial production of this range of products has been long-awaited by the market & today the company announced that it has finally secured 2 contracts for supply of silicon microphones & sensors, which will boost its turnover by the RM140 million a year (go here for more details). The first contract will start soon while the second contract will start in third quarter of this year.
Recent Financial Results
Its recent result has been fairly encouraging. When you compare its 4 latest quarters with the preceding 4 quarters, you will see that its net profit has increased by 14.3% from 13.6 million to RM15.5 million. Turnover for the same period has grown by 18.1% from RM47.3 million to RM55.8 million.
Projected results for FY2007
Assuming that the 2 new contracts contribute RM70 million to MEMS' topline, its topline will increase from RM55.8 million per annum (based on the figure for the 4 latest quarters) to RM125.8 million. Assuming net profit margin is about 27% (i.e. same as the 4 latest quarters' number), MEMS' net profit for FY2007 will be about RM34.0 million. As such, its EPS will be about 5.2 sen.
Valuation
Based on the above EPS of 5.2 sen & its closing price of RM0.655 for this morning session (MArch 16), MEMS is now trading at a PE of 12.6 times. While this may not look cheap, one must see the potential of more business flowing from these first 2 contracts for the silicon microphones. If more contracts can be secured, the financial performance will improve substantially.
In addition, you may note that Legg Mason has acquired a 5.4%-stake in MEMS on Wednesday (March 14) for an undisclosed price (go here for more details). Legg Mason, which is a very reputable fund manager, had also invested in another Mesdaq company, Green Packet 0n July 3, 2006. It bought a block of 12 million Green Packet shares for RM2.625 & that share closed at RM5.05 yesterday.
Technical Outlook
MEMS has recovered very well from its low of RM0.445 recorded in the recent sell-down (see Chart 1 below).
Chart 1: MEMS' daily chart as at Mar 15
MEMS is in a steady uptrend, although this was violated briefly last week due to heavy selling. The overhead resistance is at RM0.70 & RM0.78.
Chart 2: MEMS' weekly chart as at Mar 15
Note: I've called a BUY on MEMS based on technical consideration before (go here and here).
Conclusion
Based on the positive news, MEMS looks like a very good BUY for the medium-term. Good entry level will be about RM0.60, but this may not be likely anytime soon unless the market experiences another sell-off (which cannot be ruled out).
Wednesday, March 14, 2007
KESM's performance improved further
For QE31/1/2007, KESM's net profit has increased by 28.6% q-o-q or 51.5% y-o-y to RM4.6 million while its turnover has gained 7.7% q-o-q or 45.5% y-o-y to RM51.7 million. If you compared KESM's last 4 quarters with the preceding 4 quarters, you can see that its net profit has increased by 34.0% from RM12.3 million to RM16.5 million while turnover has increased by 21.0% from RM159 million to RM193 million. Its EPS has also increased 34.4% from 28.5 sen to 38.3 sen. Based on yesterday's closing price of RM1.80, KESM is now trading at a trailing PE of 4.7 times.
I've re-drawn KESM's downtrend line, with the downtrend remaining in tact. During the current weakness, I expect the stock to drift down to its strong horizontal support of RM1.65 or its recent low of RM1.50. These would be good entry levels for KESM.
Chart: KESM's weekly chart as at March 13
Monday, March 12, 2007
To buy or to sell?
“We are all at a wonderful ball where the champagne sparkles in every glass and soft laughter falls upon the summer air. We know, by the rules, that at some moment the Black Horsemen will come shattering through the great terrace doors, wreaking vengeance and scattering the survivors. Those who leave early are saved, but the ball is so splendid no one wants to leave while there is still time, so that everyone keeps asking, ``What time is it? What time is it?’’ but none of the clocks have hands.”
The article which deals with the ongoing market correction & I would recommend that you read it in its entirety (go here). I like to quote one passage from that article, which deals with the expected technical rebound & what to expect from this rebound. To wit:
“…we would expect some kind of throwback rally attempt today (last Wednesday). Regrettably, we think that rally attempt will fail, leading to a series of bottoming attempts at best as the markets attempt convulses, or at worst they take-out Tuesday’s lows and extend the correction.”
To be more specific, Jeffrey expects the throwback rally to last for “three- to five-session” to be followed by a pullback. The pullback “is when it will become more apparent if this is something more than just a 5% - 8% correction”. What's more than a 5%-8% correction? A bear market!
When you look through the charts of all the global equity markets (go here for the
For our KLCI, you will note that it has one of the sharpest correction when compared to other global market, whereby the index gave back 190 points when it retraced from the high of 1280 to its low of 1090. The 190-point decline represents a 66%-retracement of its prior advance from its breakout point of 990 level. You may recall that in any rally, the market can undergo a correction ranging from 33% to 66%. Anything more than 66% would raise serious doubt whether the market can return to its prior trend. So, our recent sharp correction still fall within the range of acceptable correction.
The other thing to note is that the KLCI has managed to climb above the previous uptrend line that was violated during the sharp correction. This operative uptrend line could now provide support for the KLCI in the event of any correction. That support would be at the 1150 level.
From Chart 1 below, we can see that the immediate resistance for the KLCI is at the 1215/20 level. If it can surpass this level, the next resistance will be at the 1250 level & thereafter the 1280 level (the KLCI's recent high).
Chart 1: KLCI's daily chart as at Mar 9
As noted before, I believe that most of the other equity markets are in a precarious technical position. Our KLCI is in a better technical position than many markets. We cannot however take comfort in that fine distinction because if the other markets were to go into a bear market, it is hard to see how our market can be spared. One less bearish scenario that may work in our favor would be if the other equity markets were to consolidate in a sideway manner, our KLCI could be spared. Even if the KLCI were to move in a similar sideway manner, I foresee that the second- & third-liners can still move upward, selectively. In fact, I believe that one sector that is already showing some potential is the Mesdaq stocks. From Chart 2 below, you can see that Mesdaq is in a very gradual uptrend. It was rallying up strongly prior to its recent correction and it has picked up pace again, yesterday.
Chart 2: Mesdaq's daily chart as at Mar 12
I've posted this without answering the question "To buy or to sell?". The general answer is to sell-on-strength (like now, with the KLCI at or above the 1200 level) and buy-on-weakness (when the KLCI pull back to the 1150 level or lower). This recommendation should apply for the next few weeks until we can see a clearer market direction going forward.
PPedana has made a new high
Putrajaya Perdana Bhd ('PPedana') is involved in the construction and property development sector. It was formed in 1998 as a joint venture between E&O Property Development Bhd and Putrajaya Holdings Bhd.
PPedana's property development activities mainly involve the development of Precinct 16 in Putrajaya. The precinct covers some 110 acres and is earmarked for commercial and residential development.
Upon the listing of PPedana, Eastern & Oriental Bhd will still hold a direct and indirect stake of about 50% in the company, making it the controlling shareholder.
Recent Financial Results
Since its listing in October 2006, PPedana has reported 2 quarterly results. Based on the latest result announcement for QE31/12/2006, PPedana's net profit has increased 24.1% q-o-q or 19.2% y-o-y to RM9.9 million. Its turnover has increased by 8.1% q-o-q or 126% y-o-y to RM144.7 million.
Valuation
Based on its last 2 quarterly EPS totaling 13.7 sen, PPedana's full year EPS may touch 27.4 sen. At this EPS and basing on the share price of RM2.06 at the close of today (March 12), PPedana is now trading at a PE of 7.5 times. This is a fair PE multiple for a medium-size constractor-cum-property developer.
Technical Outlook
For the past 4 months, PPedana's share price has been trading in a range between RM1.66 & RM1.82. It had broken above this range at the end of February but, due to the recent broad market correction, PPedana's share price has re-traced back into the range. On March 7, the PPedana has another rally that is more successful than the last one. This current rally has managed to break above the range as well as exceeding the high of RM2.01 recorded on its first day of listing. With this bullish breakout, I believe the stock may have more room to go before the rally begins to exhaust itself.
Chart: PPedana's daily chart as at Mar 9, 2007
Conclusion
PPedana is a reasonably priced constractor-cum-property developer as it trades at a PE of about 7.5 times. It is linked to E&O Group, which is a very successful property developer. In view of the bullish technical outlook for the stock, I would recommend a BUY on weakness, especially on retreat to RM2.00.
Thursday, March 08, 2007
Market Outlook as at March 9
Chart: KLCI's daily chart as at March 8
3 new CWs to be listed on Monday- BJToto-CB, Genting-CC & TM-CD
Since the fixing of the exercise price for this batch of CWs was done on February 26, one day before the market begun its sharp fall, their valuation is not in line with their underlying share price as reflected by their high premium (ranging from 18-25%) or fairly substantial negative intrinsic value. Unless their underlying share price rises substantially tomorrow (say, by 10%), this batch of CWs will likely to trade at prices below their IPO price, except for the first 5 minutes of trading. If you have "successfully' applied for them, you may do no better than selling them off at their IPO price, if that is possible.
Wednesday, March 07, 2007
New Strategy needed
Dow Jones Industrial Index.
London's FTSE Index.
Bombay's BSE Index.
Hang Seng index.
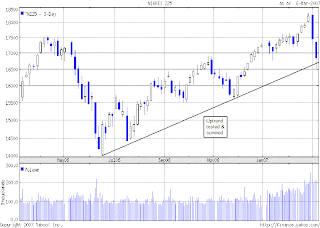
All the above indices have clearly broken below their uptrend line. The following indices are at their uptrend line or just tested & re-bounded from their uptrend line. This includes Shanghai's SSE Index (surprice?).
And, Nikkei 225 Index.
From the above, I believe that the worst in the global equity market may not be over yet. For those who have large position in the market, my recommendation is to reduce your position as the current re-bounce goes higher. For example, if you have a sizable position in Tenaga, you may want to use the current re-bounce to reduce your holding of Tenaga if its share price reaches RM11.70-12.00. If you manage to do so, you can buy back the same amount of Tenaga shares if its share price weakened back to its medium-term uptrend line support at RM10.20/30 (see the chart below).
Chart: Tenaga's daily chart as at March 6, 2007
Nobody is sure exactly where the market is at this moment. Here, an amusing look at one possible scenario of the next market direction.
via immobilienblasen
Tuesday, March 06, 2007
Tradesignum- How to identify good entry levels for buy candidates?
- Prepare a list of desired stocks. You can simply glance through the newspaper & highlight those stocks that interest you. Take note of their PE multiples (or, EPS), Price to Book multiples (or, NTA per share) and their Dividend Yield. Having done that, you may want to transfer these details onto a Excel spreadsheet.
- Go to Tradesignum (or, your preferred charting software program). I use Quickchart in the office as it is provided free by Kenanga to all its remisiers. At home, I use Tradesignum, which is a website that provides free basic charts for Malaysian stocks & indices. For this discussion, we shall see how we can make use of Tradesignum's basic charts.
- When you are at the 'PublicChart' page of Tradesignum, scroll down to the Chart Settings. Set the Price Overlay 1 & 2 to Simple Moving Average ('SMA') for 50 days & 100 days. If you like more price overlays, you can choose a faster SMA (say, 30-day SMA) or a slower SMA (say, 200-day SMA) or a different method of calculating the moving average (say, Exponential Moving Average or, EMA) or, even, Bollinger Bands. The more price overlays that you select (or use), the more crowded the chart would become.
- Then, set the 'date range' accordingly. I normally work with 6 months or 1 year of data but you can choose any period that works for you.
- Then proceed to key in the name of the stock in the space next to the word 'symbol'.
- A quick glance at the chart of any stock will give you a good feel about the direction of the price movement for that stock. Having started out with a shorter time period (say, 6 months or 1 year), then I would immediate switch to a longer time period (say, 2 or 5 years). For an example of how I studied the chart of MMC, I have attached the 6 months' daily chart (Chart 1) and the 2 years' daily chart (Chart 2). From Chart 1, you can see that MMC's medium-term uptrend line support is at RM4.50 while slightly below that is a horizontal support of RM4.25. The 100-day SMA is also around RM4.25. From Chart 2, you can see that MMC's long-term uptrend line support is at RM3.50 while a strong horizontal support is noted at the RM4.00 level. All the support levels (for uptrend line, horizontal line & SMA) should be noted down on the same excel spreadsheet.
Chart 1: MMC's daily chart for 6 months ending March 6, 2007
Chart 2: MMC's daily chart for 2 years ending March 6, 2007
Updated on March 7, 2007
In order to draw onto the chart, you need to copy the chart & paste it onto a Paint document.
Monday, March 05, 2007
Market Outlook as at March 6
I have also attached the charts for the 12-month period ended March 5, 2007 (Chart 2) as well as the 12-month period ended March 5, 1994 (Chart 3). A comparison between the 2 charts raises the interesting question of whether we are currently in a similar stage like January 1994, where the market had corrected sharply after the 1993 bull run and thereafter entered into a period of consolidation that lasted many months. During that period, the market traded in a range marked out by the 50-day SMA and 100-day SMA (or, between 1000 and 1150 level). If the same pattern were to repeat, we can expect a market to trade in the range between 1100 and 1200 for the next few months. You may take advantage of the range-bound market to accumulate near the 1100 level & to sell when it approaches the 1200 level.
Chart 1: KLCI's daily chart as at Mar 5
Chart 2: KLCI's daily chart for 12 months ending Mar 5, 2007
Chart 3: KLCI's daily chart for 12 months ending Mar 5, 1994
Friday, March 02, 2007
KLCI is likely to re-test the medium-term uptrend line
Chart: KLCI's daily chart as at March 1