On Monday (October 22), four new CWs were listed. They are CHCBC-C1, CHMERCH-C1, HKEX-C4 & ZIJIN-C1. These are all Non-collateralised American-style Cash-settled Call Warrants and they were issued by OSK.
The new CWs are highlighted in blue. The cheaper CWs (with premium of less than 4%) are highlighted in green while those with premium exceeding 10% are highlighted in pink. In particular, investors should be very careful with CHMERCH-C1, HKEX-C4 & ZIJIN-C1 as they are trading at premium approaching or exceeding 40%!
Readers should note that there was an adjustment to ANGANG-C1 due to a Rights Issue of 2.2 new shares for every existing 10 shares owned. As the list is getting longer & changes are made from time to time (such as ANGANG-C1), I would advise you all to verify the numbers for your own usage.
This is a personal weblog, reflecting my personal views and not the views of anyone or any organization, which I may be affiliated to. All information provided here, including recommendations (if any), should be treated for informational purposes only. The author should not be held liable for any informational errors, incompleteness, or delays, or for any actions taken in reliance on information contained herein.
Tuesday, October 30, 2007
CWs for Indices
Today, a new CW over the Hang Seng China Enterprises Index (‘HSCEI’) was listed. It is called HSCEI-C1. This adds to the existing 3 CWs over market indices, i.e. KLCI-CA, KLCI-CC & HSI-C1, which are European-style Cash-settled CWs over the Kuala Lumpur Composite Index (‘KLCI’) & the Hang Seng Index (‘HSI’), respectively. HSCEI is similarly a European-style Cash-settled CW.
As the name implied, HSCEI is made up of Mainland Chinese companies that are listed on the Hong Kong Exchange. Thus, it should not be a surprise to note that this index has risen substantially lately. In fact, a comparison between HSCEI and HSI shows that the former has outperformed the latter by a significant margin. For example, from the low recorded on August 17, HSCEI has risen by 97% to close at 20194.14, while the HSI has gained 62% to close at 31586.90. For closer tracking of these 2 induces, go to here & here.
The price of HSCEI-C1 as shown on the above table is the IPO price. As at 12.00 noon, this CW was trading at RM0.40, giving a gain of RM0.125. Based on the HSCEI of 20241 as at the same time, the HSCEI-C1 was trading at a premium of 14.4%. That is a pretty pricey premium to pay for any CW.
Monday, October 29, 2007
Market Outlook as at October 26
The KLCI gained 49.17 points to close at 1398.35 last week. With that impressive run, the KLCI has finally surpassed its recent high of 1392.18 recorded on July 24. At 12.00 noon today, the KLCI was at 1404, showing a gain of 6 points on traded volume of 1 billion units. If the KLCI can hold onto its breakout level of 1392 (preferably, 1400), the KLCI's medium-term outlook would turn very bullish. For those who had sold off ahead of the 20th anniversary of the Black October but have yet to rebuild your position in the market to the desire level, you are well advised to do so quickly. This could be the time that you need to "lose your cash".
Chart: KLCI's weekly chart as at October 26 (courtesy of Quickcharts)
Saturday, October 20, 2007
No update for the whole of next week
There will be no update for next week as I will be away for a holiday. With Dow dropping 367 points yesterday, this is one break that I am not looking forward to. If it is any consolation, I will say that the market has been anticipating this correction (why not? it's annual affair... now into its 20th anniversary) and, as such, one can also anticipate that those, who have shorted the market or who have reduced their position earlier, will be getting ready to add back their position or cover their shorts soon. I expect the Dow to find support at 13,200 and 13,000 level (see Chart 1).
Chart 1: DJIA's daily chart as at October 19 (courtesy of Yahoo Finance)
Yesterday, Digi.com and Topglove filed in their latest quarterly results. Both have reported very strong net profit that is pretty much within expectation. Digi.com has a 3rd net profit of RM273 million on the back of a turnover of RM1.11 billion. What surprised many was its huge interim dividend of RM1.00 per share. I expect the stock to test its all-time of RM25 shortly (see Chart 2 below).
Chart 2: Digi's daily chart as at Oct 19 (courtesy of Tradesignum.com)
Topglove has similarly reported a good net profit of RM26.8 million on a turnover of RM308 million for its 4th quarter. From Chart 3 below, we can see that the stock is trading very near its long-term uptrend line. Topglove could be a good BUY at RM5.80-6.00 level.
Chart 3: Topglove's daily chart as at Oct 19 (courtesy of Tradesignum.com)
Next week's trading will be very tricky. My biggest fear is that the Shanghai & Hong Kong stock markets may decide to take a break. After Wall Street and Bombay's recent sharp fall, that's the last thing we need. Scary thought but hopefully it is just that.
Thursday, October 18, 2007
TGuan- another laggard worths a BUY
Background
Thong Guan Industries bhd ('TGuan') is involved in manufacturing of plastic & paper products; plastic packaging products; and tea, coffee & other related consumer products. Its main production facilities are located in Sungai Petani, Kedah. The group has invested in China (with plants located in Jiangsu). The group is currently one of the biggest producer of stretch films in Asia Pacific.
Past 5-year Financial Performance
The group's turnover has been increasing steadily over the past 5 years. While its net profit track record has been good, it has declined a bit in the past 2 years. This year's net profit is expected to be weak as well. The group has attributed the poorer net profit to higher input cost, higher freight cost, higher interest cost, unfavorable forex movement & losses from its subsidiary in China.
Recent Financial Results
TGuan's net profit for QE30/6/2007 decreased by 25.4% q-o-q or 63.3% to RM2.5 million. This is despite a turnover, which has increased by 9.6% q-o-q or 11.8% y-o-y to RM126.6 million.
Current Financial Position
As at 30/6/2007, TGuan's financial position is deemed satisfactory. Its liquidity position is healthy as reflected by its current & quick ratio of 1.51 & 0.45 respectively. Gearing ratio is low at 0.35 times. In term of working capital management, one will note that the inventory's turnover period has increased slightly from 72 days as at 31/12/2006 to 80 days as at 31/6/2007 while debtors' turnover has declined from 67 days to 64 days during the same periods.
Valuation
Based on TGuan's closing price of RM1.15 as at yesterday, the stock is now trading at a trailing PE of 7.67 times (using its past 4 quarters' EPS of 14.6 sen) or 0.67 times its book value (using its NTA per share of RM1.72 as at 30/6/2007).
Technical Outlook
TGuan has been drifting lower since making a high of RM2.55 in June 2005. At this stage, the stock is in a medium-term downtrend, that is very much intact. Nevertheless, the stock is also in a long-term uptrend where the support is at RM1.10. A strong horizontal support at RM1.00 is also noted.
As the medium-term downtrend is still intact, this stock's upside will be capped. For an upleg to begin, the share price must break above RM1.40.
Chart 1: TGuan's monthly chart as at October 16 (courtesy of Quickcharts)
Conclusion
TGuan is now trading at attractive multiples of 7.67 times its trailing earning or 0.67 times its book value. In addition, the stock is very near its long-term uptrend line support of RM1.10 (with its strong horizontal support of RM1.00 as a back-up, if need be). While the stock's downside is fairly limited with these supports in place, it must be noted that the medium-term downtrend is still intact, thus capping the upside of any price rally.
Tuesday, October 16, 2007
WTHorse- a laggard that worths accumulating
Background
White Horse Bhd ('WTHorse') is involved in the manufacture & distribution of ceramic & homogeneous tiles. Its plants are located in Pasir Gudang Industrial Estate & Tanjung Langsat Industrial Complex; both situated in Pasir Gudang, Johore.
Past 5-year Financial Performance
From the table below, we can see that turnover has been flattish in the past 2 years despite the completion of the 3rd & 4th production line in the Tanjung Langsat Industrial Complex in the third quarter of 2006. These 2 new lines were originally projected to increase the group's output by 25%, but one can clearly see that the additional capacity has not boosted its turnover. This is probably due to a slowdown in the construction & property sectors in 2006.
Recent Financial Results
For QE30/6/2007, WTHorse's net profit increased by 33.4% q-o-q to RM10.5 million while turnover increased by 16.6% to RM104.6 million. When compared to the corresponding quarter last year, net profit declined by 9.9% on a the back of a 2.6% drop in turnover.
Current Financial Position
As at 30/6/2007, WTHorse's financial position is deemed satisfactory. Its liquidity position is healthy as reflected by its current & quick ratio of 1.36 & 0.60 respectively. Gearing ratio is low at 0.44 times its Shareholders' Funds. In term of working capital management, one will note that the inventory's turnover period has increased from 159 days as at 31/12/2006 to 172 days as at 31/6/2007 while debtors' turnover has declined from 98 days to 88 days during the same periods.
Valuation
Based on WTHorse's closing price of RM1.26 as at yesterday, the stock is now trading at a trailing PE of 6.33 times (using its past 4 quarters' EPS of 19.9 sen) or 0.6 times its book value (using its NTA per share of RM2.06 as at 30/6/2007). At these multiples, the stock is deemed inexpensive.
Technical Outlook
The stock made a high of RM2.65 in January 2005 (see Chart 1). Since then, the share price has been drifting lower. The stock has finally broken above that downtrend in either February or April this year (depending on how the downtrend line was drawn).
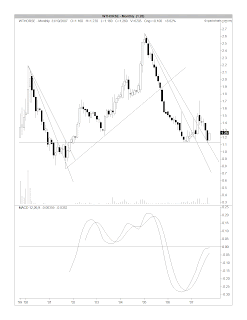
Chart 1: WTHorse's monthly chart as at October 16 (courtesy of Quickcharts)
After making a high of RM1.71 in May, the share begun to drift lower again. In the past week or so, the stock has tested the horizontal support at RM1.15 & rebounded (see Chart 2). In the rebound, the stock has broken above its short-term downtrend line at the RM1.22/23 level. WTHorse is now a fairly safe buy, though the uptrend has yet to commence.
Chart 2: WTHorse's daily chart as at October 16 (courtesy of Quickcharts)
Conclusion
Based on the improvement in the construction & property sector, I believe that WTHorse's financial performance will get better. WTHorse is now trading at undemanding multiples of 6.33 times its trailing earning or 0.6 times its book value. Technically speaking, the stock is also trading near its strong horizontal support of RM1.15, which means that the stock is a fairly safe BUY.
Crude Oil is definitely not going lower
Sometime, one can learn very quickly that one has made a wrong call. Such was my call that crude oil was about to trend lower a few days ago (go here). With the new high of USD86 per barrel just recorded yesterday, I expect the uptrend for crude oil to continue. This should be bullish for Oil & Gas stocks (such as Kencana, Sapcres etc) but likely to be negative on the overall equity market.
Chart: Crude Oil's daily chart as at October 12 (courtesy of Supercharts by Omega Research)
Friday, October 12, 2007
Tenaga is still standing
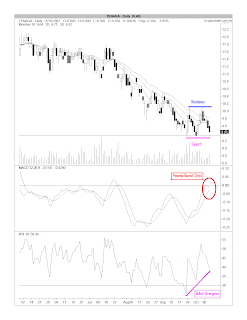
The latest news on Tenaga is that it has proposed to the Government that "(power) generators be allowed to raise tariffs to pass on higher natural gas costs caused by the gradual removal of subsidies (on natural gas)". This piece of "news" has caused the share price of Tenaga to tumble down to its recent lows of around RM9.30.
Technical analysts will be watching Tenaga closely to see whether the RM9.30 level can sustain. Here, we must bear in mind that a stock that refuses to go down after a barrage of bad news is signaling that it is in fact bottoming out & maybe poised to recover. If a recovery were to happen, Tenaga would have done a reversal known as a Triple Bottom. Thus, Tenaga could be a good Trading Buy at the RM9.30 level, with a STOP at RM8.90. Short-term target is RM10.00.
Chart : Tenaga's daily chart as at October 11 (courtesy of Quickcharts)
Airasia's uptrend may continue
After recording a high of RM2.15 on May 7, Airasia share price has been drifting lower. Yesterday, it broke above that short-term downtrend line at RM1.98. This breakout was accompanied by a pick-up in volume. With this breakout, the near term outlook for Airasia has turned bullish.
Chart : Airasia's daily chart as at October 11 (courtesy of Quickcharts)
Tuesday, October 09, 2007
Crude Oil is likely to trend lower
Crude Oil has broken its immediate uptrend line on September 25, but it staged a recovery to record a new high of USD83.70 on September 28. Thereafter, crude oil broke through the uptrend line again on October 1. Subsequent rebound did not bring the price above the uptrend line. In fact, the peak of this rebound was lower than the September 28 peak. Yesterday, crude oil recorded a lower 'low' than that chalked on October 2. The lower peak & the lower trough would satisfy the beginning of a short-term downtrend for crude oil (see Chart 1).
Chart 1: Crude Oil's October futures daily chart as at October 8 (courtesy of Barcharts.com)
The weekly chart (Chart 2) shows that crude oil should have good horizontal support at USD78, which is not very far off. A break of this level would likely follow by a test of the medium-term uptrend support at USD73.
Chart 2: Crude Oil's October futures weekly chart as at October 8 (courtesy of Barcharts.com)
The bearish outlook for crude oil may dampen the sentiment for Oil & Gas stocks, but I believe that the outlook would be generally positive for equity & bond if crude oil prices were to retreat further,thus lowering concern of inflation induced by high crude oil prices.
Basket CWs- ZA-OSKSB, ZB-CIMB & ZC-CIMB
Today, we have the listing of two new basket CWs, i.e. ZB-CIMB & ZC-CIMB. This is in addition to the present basket CW, ZA-OSKSB. The main difference between the existing ZA-OSKSB and the newer basket CWs are:
- ZA-OSKSB is a zero-strike CW, where the exercise price is a nominal sum of RM0.01;
- ZA-OSKSB is a Bermudian style CW, where it is exercisable quarterly as compared to the newer basket CWs which are European style CWs (where they are exercisable only on maturity); and
- ZA-OSKSB tries to track the top 20 stocks listed on the KLSE while the newer basket CWs allows sectoral exposure to the stock exchange companies in Malaysia, Singapore & Hong Kong (in the case of ZB-CIMB) or exposure to Oil & Gas stocks in Malaysia & China (in the case of ZC-CIMB).
Monday, October 08, 2007
Market Outlook as at October 8
The market began to correct as early as 9.15 am after the KLCI gained 10.39 points to record a high of 1382.78. At 3.30 pm, the KLCI hit a low of 1364.18, losing 8.21 points compared to Friday's close. Is this rally over?
From the chart below, we can see that the current upleg has been very steep, not unlike other markets around the region. With the steady rise in the volume traded in the past 2 weeks, the market appears to be in a hurry to test its recent high of 1392. Thus, a correction should not be unexpected & it could well bring the KLCI down to its short-term uptrend line support of 1350; or, its 10-day SMA support of 1347; or, even the support given by the gap-up on October 2 (at 1353-1359). So, as long as the 1350 level is not violated convincingly, I believe that this is merely a short-term correction from which the KLCI can then stage a strong re-bound.
Based on this, I believe that the current correction is an opportunity to accumulate stocks.
Chart : KLCI's daily chart as at October 8 (courtesy of Quickcharts)
Thursday, October 04, 2007
Sarawak may have a bullish breakout
Sarawak Energy Bhd ('Sarawak') is involved in the generation & transmission of electricity in the state of Sarawak. The stock has been 'bottoming' for 4 years & it finally broke above the strong horizontal resistance of RM1.45 in December 2006. Since then, it has been consolidating in the pattern of a wedge (albeit, a bearish wedge). A break above RM1.46/47 could signal the beginning of its next upleg move. Watch out for this breakout.
Chart 1: Sarawak's monthly chart as at October 4 (courtesy of Quickcharts)
Chart : Sarawak's weekly chart as at October 4 (courtesy of Quickcharts)
Chart 1: Sarawak's monthly chart as at October 4 (courtesy of Quickcharts)
Chart : Sarawak's weekly chart as at October 4 (courtesy of Quickcharts)
TA may be poised for a bullish breakout
TA has been consolidating since recording its recent high of RM2.29 on February 21. Yesterday, the stock gained 5 sen to close at RM1.65. A break above RM1.65 would mean that TA has broken to the upside of the overhead medium-term downtrend line (see Chart 1 below).
Chart 1: TA's daily chart as at October 4 (courtesy of Quickcharts)
An indication of the likelihood of a breakout in TA share price may be seemed from the chart of TA-WB (see below). That chart shows that TA-WB has broken to the upside of the overhead medium-term downtrend line at RM0.69-70.
Chart 2: TA's daily chart as at October 4 (courtesy of Quickcharts)
If TA can achieve a breakout with significant volume, the stock & the warrant would be a good trading BUY.
Wednesday, October 03, 2007
TChong may have a bullish breakout at RM1.50
In the month of August, the Total Industrial Volume (for the Automotive Industry) increased 5.9% m-o-m or 0.8% y-o-y to 47,585 units sold. This is the third month of monthly uptick, but the year-to-date sale volume is still down 7% when compared to the same period last year.
Most research houses are still neutral on the auto sector because of depressed profit margin due to under-recovery of overhead (because of low sale volume) and high advertising & promotional expenses to attract sale. I believe that some investors have begun to position themselves in this sector. One stock that may have benefited from this is TChong. In fact, TChong may have just broken above its medium-term downtrend line at RM1.50 yesterday. If this breakout can sustain, TChong may test its strong resistance levels, such RM1.80 & RM2.15.
Chart 1: TChong's weekly chart as at October 2 (courtesy of Quickcharts)
Chart 2: TChong's monthly chart as at October 2 (courtesy of Quickcharts)
Tuesday, October 02, 2007
Tenaga may find support at RM8.00-9.00
Tenaga broke below its uptrend line support (of RM11.00) in July. This was despite numerous research reports which valued Tenaga at RM14.00-15.00. The value given to Tenaga was due to anticipated strong growth in electricity demand going forward.
Now, we know what has spooked the Tenaga shareholders, which brought on a strong selldown in the stock. It is the same issue that has bedeviled this stock for the past few years, i.e. the revision in the subsidized price of natural gas from Petronas Gas.
OSK has a report entitled "Painful if No Remedy" dated September 24, which projected that an increase in the price of natural gas of 10-60% could reduce Tenaga's earning by 5-34%, if the electricity tariff remained unchanged. Based on this projected earnings, Tenaga's target price could be lowered to RM10.00-13.80. Nevertheless, OSK has maintained its existing BUY call on the stock with an unchanged target price of RM14.55 because no concrete figures have been unveiled. Kenanga has similarly maintained its BUY call on the stock (go here).
Looking at the chart below, we can see that Tenaga can find strong support at RM8.00-9.20. Given the strong selldown, I believe that the rumor could have been substantially factored into the price of Tenaga. As such, Tenaga at the present price level could well be a good BUY, either for a trade or for the long-term hold.
Chart : Tenaga's weekly chart as at October 1 (courtesy of Quickcharts)