Friday, November 30, 2007

MEMS' accounting irregularities

On November 27, MEMS announced that it was not able to issue its Audited Financial Statements by 30 November 2007, as the “external auditors have expressed concerns over certain transactions relating to revenue and property plant and equipment… the Board has resolved not to recognize revenue of RM19.72 million. As a result of this, the unaudited consolidated revenue for the financial year ended 31 July 2007 will be revised to RM53.7 million. This will consequently result in the unaudited profit after tax for the financial year ended 31 July 2007 to be reduced from RM21.47 million as announced on 27 September 2007, to RM13.45 million.” A special committee has been set up to look into this matter.

Before this announcement, the market was relying on MEMS' unaudited 4th quarter financial statement to assess the company's financial performance & position. Based on that statement, MEMS' net profit for FYE31/7/2007 has increased by 54% from RM14.0 million to RM21.5 million on the back of a 46%-increase in turnover from RM50.2 million to RM73.4 million. Now, this has to be revised down.


Based on the adjustment announced, it seems that MEMS' net profit for FYE31/7/2007 has actually declined by 3.7% (instead of a gain of 54%) while its turnover has only inched up by 7.0% (instead of 46%), when compared to the previous year's results. MEMS' EPS for FYE31/7/2007 will be lowered to 2.05 sen while its NTA per share would probably be adjusted from RM0.187 to RM0.175.

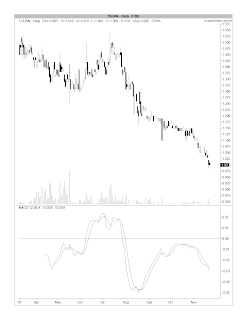
Chart: MEMS' weekly chart as at November 29 (courtesy of Quickcharts)

Since the announcement on November 27, MEMS share price has dropped by 46% from RM0.36 (at the close of November 27) to RM0.195 (at the close of November 29). This may appear to be disproportionate to the seriousness of the matter in hand. Here, we need to consider the following:

  1. Why were these "sales" booked in the accounts earlier?
  2. Are there any further accounting adjustment of a negative nature?
  3. What are the reasons for the slow growth in MEMS' turnover given that its products were reportedly cheaper than its competitors?
  4. Are the existing shareholders (such as Legg Mason) willing to overlook this serious accounting problem?
As noted in my previous update ( go here), Legg Mason has taken a 5.4%-stake in MEMS in March. This reputable fund manager has invested in MEMS because its products were on the verge of gaining global acceptance. Back then, MEMS was reported to have secured 2 contracts for supply of silicon microphones & sensors, which would boost its turnover by the RM140 million a year. Is MEMS encountering any problems in relation to the performance of these contracts?

With the above questions still unanswered, I believe that it is too early to make any call on MEMS.

The new Sime Darby (or, Synergy Drive) Theoretical Price

Based on the closing price of the various acquiree companies that will be merged to form the new Sime Darby (or, Synergy Drive) & the applicable Swap Ratio, the Theoretical Price of the new Sime Darby (or, Synergy Drive) can be computed (as shown below). For example, a shareholder of the original Sime Darby can choose to exchange his shares for the shares in the new Sime Darby (or, Synergy Drive) at a Swap Ratio of 1.23. The Swap Ratio is arrived at by dividing the original Sime Darby price as at the Offer Date with the Theoretical Price of the new Sime Darby (or, Synergy Drive). As the share prices of the various acquiree companies have appreciated, the Theoretical Price of the new Sime Darby (or, Synergy Drive) was bumped up.


We can compute the average Implied Theoretical Price of the new Sime Darby (or, Synergy Drive) to be RM8.81 as at October 17. Since then, the market has gone through a lot of changes. Two things could affect the price of the new Sime Darby (or, Synergy Drive). They are the injection of Bakun Dam into the group & the appreciation of the price of CPO (the main business of the group). Assuming that we exclude the Bakun Dam factor (because it was common knowledge that the government was planning to do so), the CPO factor must be accounted for. From October 17 to November 29, the Plantation index has gone from 6848 to 7239 (or 5.7%) and if we factor this rise into the price, the Fair Value of the new Sime Darby (or, Synergy Drive) could be about RM9.31.

Tuesday, November 27, 2007

Toyota-C1- an interesting CW

Today, we have the listing of 4 CWs from CIMB, i.e. Toyota-C1, Bursa-CH, TM-CG and CCCC-C5. I do not intend to cover the CWs of Bursa-listed companies nor the Hong Kong-listed CCCC, for now. I will instead look at Toyota-C1 only. The main terms are highlighted below.


Based on the morning closing price of this CW at RM0.47 & the Toyota Motor Corp (Stock Code: 7203) as at 14.27 Tokyo time of Y6080, this CW was trading at a premium of 12.64%. At this premium, the CW is not cheap but not at sky-high premium that we have witnessed earlier. Looking at the chart of this stock & its key statistics, a case can be made for buying Toyota at the present price as well as buying the new Toyota-C1.

Toyota is probably the world's largest auto maker (for more details from Wikipedia, go here). Its shares are traded in Tokyo Stock Exchange ('TSE') as well as on other exchanges such London Stock Exchange ('LSE') & New York Stock Exchange ('NYSE'). For the purpose of valuing of Toyota-C1, the share price as traded in TSE will be used (see Chart 1).


Chart 1: Toyota's monthly chart as at November 26 (courtesy of TSE)

From Chart 1, we can see that Toyota share price has been correcting for the past 1 year. On November 22, the share price hit a low of Y5750 before rebounding. On further weakness, the share price may find support at the tentative uptrend line support of Y5500 or the horizontal support at Y5400. However, you can see that the faster 5-mth MA is poised to cut below the 25-mth MA, which will be a bearish sign. A strong rebound is needed to negate this negative sign.

To get a second look at Toyota's share price, I have appended the price chart of its trading in USD on the NYSE (see Chart 2 below).


Chart 2: Toyota's daily chart as at November 26 (courtesy of Yahoo Finance)

This chart also shows that the stock is near its tentative uptrend line support at USD105/6 or its horizontal support of USD108/9. Like the earlier chart, we can see that the faster 200-d MA is also poised to cut below the slower 300-d MA. Again, a strong rebound is needed to negate this bearish sign.

Based on Key Statistics provided by Yahoo Finance ( an extract provided below), we can see that Toyota is trading at attractive multiple of about 10 times its earning.


Based on fairly attractive valuation & a potential rebound in the price of Toyota share, the Toyota-C1 could well-surprise many to the upside. A slow entry over the next one or two weeks' time might be a safer option as one would be able to see whether the Toyota share price would cease to threaten its uptrend line as well as seeing the end of the initial market-making activities that tend to hold the CW at an artificially high price. If the share price does not break any of the above-mentioned uptrend line, a good entry to Toyota-C1 would be around the RM0.40 level (paying a premium of 10%).

Tongher testing strong support of RM3.36-40

Tongher has just announced its results for QE30/9/2007 . Its net profit declined by 38% q-o-q or 26% y-o-y to RM15.2 million while its turnover of RM139 million is slightly lower than that recorded in QE30/6/2007 but 58% higher than that reported in the same quarter last year. The poor performance was attributed to lower demand for its products, which coupled with higher raw material costs, has resulted in a drop in its profit margin.


The share price has dropped back since making its high of RM4.53 recorded on October 1st. The sharp price run-up in September & October preceded the bonus issue of 1:3, which went ex on October 16. Since then, the share price has corrected back about 22% (based on yesterday's closing price of RM3.52). In this morning session, the share price dropped 12 sen to close at RM3.40. This is very near the strong horizontal support of RM3.36-40 level, where a rebound may happen. If this support is violated, then the share price may test its uptrend line support at RM3.06-10 level. The uptrend line support could be a entry level for this very well-managed company.

Based on the last 4 quarters' EPS of 61 sen, Tongher is now trading at a trailing PE of 5-6 times. We do not know what's Tongher's future EPS will be, but assuming that it is 30% lower than the last 4 quarters' EPS, Tongher could be earning about 43 sen per share. Thus, at the price of RM3.40, it may be trading at a future PE of 8 times. Even at this adjusted earning, Tongher is still an attractive stock. Watch this stock closely.


Chart: Tongher's weekly chart as at November 26 (courtesy of Quickcharts)

Monday, November 26, 2007

WTHorse reported higher net profit for QE30/9/2007

WTHorse's net profit increased by 22.8% q-o-q to RM12.9 million on the back of a 3.6%-gain in turnover to RM108.4 million. This is, however, still marginally lower than that reported in the same quarter last year. Nevertheless, the sign of a recovery in WTHorse's financial results is clearly on the way.


The chart below shows that the share has done a 'test of the low' in the past few weeks. The stock did not make a new low and, with its MACD hooking up, it could be poised to recover soon.


Chart: WTHorse's daily chart as at November 23 (courtesy of Quickcharts)

In view of the good financial results & mildly positive technical set-up, WTHorse could a good buy at the current price.

TGuan reported a good profit for QE30/9/2007

TGuan's results for QE30/9/2007 was fairly good. Its net profit increased by 114% q-o-q to RM5.3 million on the back of a 8.6%-increase in its turnover to RM137.5 million. The net profit is, however, lower than that reported in the same quarter last year due to higher raw material cost, higher operating expenses (such as freight cost & electricity charges), higher interest expenses and continuing losses incurred by a newly-established subsidiary in China.


Despite the improved financial performance, TGuan's share price has continued to slide. We will have to wait & see how the market receive this good set of results for TGuan.


Chart: TGuan's daily chart as at November 23 (courtesy of Quickcharts)

Based on the good results in the last quarter, TGuan is good contrarian BUY despite the poor technical outlook. At the current price of around RM1.00, the stock is trading at a PE of 5 times (if TGuan can continue to maintain an earning similar to its EPS achieved in the last quarter).

Latitud announced a poor set of results for QE30/9/2007

Latitud's results for QE30/9/2007 was a disappointment. Its net profit dropped 48% q-o-q or 85% y-o-y to RM789k while its turnover declined 0.4% q-o-q or 3.8% y-o-y to RM102.3 million. The poor result is attributable to the following:
  1. lower production output due to the closure of the Ijok, Selangor plant while the output from its new Vietnam plant has yet to pick up sufficiently as commercial production has only commenced in June 2007;
  2. higher operating losses from its Thailand plant; and
  3. higher raw material cost & transport expenses.
Due to the above, Latitud incurred a pre-tax loss of RM786k as compared to a pre-tax profit of RM977k recorded in QE30/6/2007. After adding back tax credit of RM515k and minority interest of RM1.06 million, Latitud still managed to chalk up a small net profit of RM789k.


Latitud has rebounded off its strong horizontal support of RM1.20. While the poor financial performance in the last quarter may lead to short-term weakness for this stock, the past few weeks' share price movement could be indicating that Latitud's share price might have bottomed. Its recovery would have to wait, for now.


Chart: Latitud's daily chart as at November 23 (courtesy of Quickcharts)

I still believe that Latitud is still a good long-term buy at prices between RM1.20-1.30.

Wednesday, November 21, 2007

Uchitec may have peaked

Uchi Technologies Bhd ('Uchitec') is involved in the manufacture & sale of controller modules for consumer & industrial electrical & electronic appliances. Uchitec, which was listed in July 2000, has become one of the darling stocks among the investors due to its impressive financial performance & the steady rise in its share price.

In the past 4 quarters, its net profit seems to have hit a plateau. According to its latest quarterly results fro QE30/9/2007, Uchitec's net profit has dropped 13.4% q-o-q or 17.8% y-o-y to RM18.7 million while its turnover has also declined by 2.5% q-o-q or 5.3% y-o-y to RM39.2 million. The company attributed the decline in its net profit to the appreciation of Ringgit as well as changes in the product mix.


Based on the 9-mth performance, Uchitec is expected to register a small decline in its net profit for FY2007, which will break its profit track record, which shows a consistence growth since 2002. The group could recover from this small setback in FY2008 when its new plant in China is set to start operation.


Technical analysts may take a bearish view of Uchitec's recent share price decline. The share price seems to have peaked at RM3.40 & broke below its long-term uptrend line support of RM2.90 on November 2nd.


Chart: Uchitec's monthly chart as at November 20 (courtesy of Quickcharts)

Based on the technical SELL signal noted, it is advisable to avoid Uchitec for now.

Tuesday, November 20, 2007

Market Outlook as at November 19

The KLCI has been struggling to stay above its medium-term uptrend line for the past few days. It looks like a losing battle as the uptrend line support continued to inch upward, while the index failed to gain ground. Currently, the uptrend line support is at 1396 while the index closed at 1380 yesterday. The KLCI is likely to move sideway in the near future within the range of 1350-1390 until a new trend emerges.


Chart: KLCI's daily chart as at November 19 (courtesy of Quickcharts)

TChong- take profit

On October 3rd, I have recommended a BUY on TChong when it did a breakout above its medium-term downtrend line at RM1.50 (go here). In just a few short weeks, this stock has surpassed its all-time high of RM2.32 recorded in July 1999. It went on to chalk up a new high of RM2.50 on November 14. Given the uncertain market condition, I believe that this price might not be sustainable. Taking profit on this stock may be a good idea.


Chart: TChong's monthly chart as at November 19 (courtesy of Quickcharts)


Chart: TChong's daily chart as at November 19 (courtesy of Quickcharts)

Monday, November 19, 2007

QCAPITA may have broken above its downtrend

In today’s Business Times, it is reported that QUILL Capita Trust (‘QCAPITA’), "a property trust partly owned by CapitaLand Ltd of Singapore, plans to buy two yield-accretive assets from its sponsors in the next three to six months to grow the trust, its manager said.”After the completion of a share placement in September, which raised RM226 million, QCAPITA's gearing was lowered to 0.7 per cent. “This means it can buy around RM400 million worth of properties via borrowing before it needs to sell more shares. Gearing of a real estate investment trust (REIT) cannot exceed 50 per cent under the Securities Commission's rules.” For more, go here.

A closer look at QCAPITA's daily chart revealed that its price peaked at RM2.00 on May 14th & has been trending lower before hitting a low of RM1.11 in early part of November. QCAPITA appears to have broke above its downtrend line at RM1.15 on November 11th. The 10-day SMA is poised to cut above the 20-day SMA in the next day or so. With these, QCAPITA is likely to have made a bottom and it may move sideway for a period of time before making its next upleg. The catalyst for the next upleg could be the announcement of new acquisition of properties (such as those highlighted by the above Business Times report). Buying this REIT at RM1.15-1.20 is a relatively safe entry to well-managed REIT.


Chart: QCAPITA's daily chart as at November 16 (courtesy of Quickcharts)

Friday, November 16, 2007

Aji- a cheap consumer stock

Background

Ajinomoto (M) Bhd ('Aji') is involved in the manufacture & sale of natural flavour food enhancers. Its main production facilities are located at Jalan Kuchai Lama, Kuala Lumpur.

Past 5-year Financial Performance

The group's turnover has been increasing steadily over the past 5 years. Its net profit prior to FY2006 is fairly stable at around RM10-12 million. In FY2006, its net profit took a sharp fall of 52% to RM6.01 million due to fierce competition as well as higher raw material cost & fuel cost (resulting in a drop in profit margin). In that year, Aji introduced a new product, i.e. Vono (a thick & creamy instant soup) as well as integrating its manufacturing process & other effort to improve production efficiency. The results of these initiatives can be seen in the performance of FY2007 and the current FY2008. Turnover has grown by 11% in FY2007 & FY2008. Net profit for FY2007 jumped by 211% to RM18.67 million from RM6.01 million. For FY2008, the net profit is projected to grow by 21% to RM22.62 million.


Recent Financial Results

Aji's net profit for QE30/9/2007 increased by 18.8% q-o-q or 49.1% y-o-y to RM6.14 million, while turnover at RM52.7 million show a slight drop of 1.4% from the preceding quarter but a grow of 8.4% from the previous year's corresponding quarter.


Current Financial Position

As at 30/9/2007, Aji's financial position is deemed satisfactory. Its current & quick ratio is more than adequate at 5.6 & 4.5 times, respectively. Aji has no borrowings, but instead it has a cash balance of RM61.4 million.

In term of working capital management, we will note that the inventory's turnover period has improved from 52 days as at 30/9/2006 to 46 days as at 30/9/2007 while debtors' turnover has increased from 40 days to 46 days during the same periods.

Valuation

Based on the projected FY2008 EPS of 37.2 sen & yesterday's closing price of RM2.20, Aji is now trading at a PE of 5.9 times. At this multiples, I would consider Aji to be fairly attractive.

Technical Outlook

On the longer term basis, the share price of Aji appears to be moving sideway, with a slight upward bias (see the monthly chart, Chart 1). While the share price is slowly moving up by the upside is blocked by a strong resistance at RM2.30 (see the daily chart, Chart 2).


Chart 1: Aji's monthly chart as at November 15 (courtesy of Quickcharts)


Chart 2: Aji's daily chart as at November 15 (courtesy of Quickcharts)

Conclusion

Based on strong improvement in financial performance & possible technical breakout, Aji is a good BUY for the medium-term.

Wednesday, November 14, 2007

New CWs listed- GOOGLE-C1, CHMOBIL-C6 & CHMOLY-C1

Today, we have the listing of 3 new CWs, i.e. GOOGLE-C1, CHMOBIL-C6 & CHMOLY-C1 from OSK. They are all Non-collateralised, American-style, Cash-settle Call Warrants. Based on the prices as at 9.50 am, GOOGLE-C1, CHMOBIL-C6 & CHMOLY-C1 are trading at premium in excess of 40%. At such high premium, their upside is likely to be very limited.

Crude Oil price broke its short-term uptrend

Crude Oil prices dropped sharply yesterday, in reaction to the news that International Energy Agency ('IEA') is cutting its forecast for global demand through 2008, by 300,000 barrels per day from its previous estimate.

From the chart below, we can see that the short-term uptrend line (S2) has now been violated at the USD93 level. Unless, there is a quick recovery above USD93, Crude Oil is likely to drift lower. I believe it should find support at the psychological USD90 or the medium-term uptrend line (S3) support of USD85-86.


Chart: Crude Oil chart as at November 13 (courtesy of SuperCharts by Omega Research)

Tuesday, November 13, 2007

CWs for HK stocks as at November 12

Today, we have the listing of one new CW, i.e. MTR-C1, which is a Non-collateralised European-style Cash-settled Call Warrant and it was issued by CIMB.

The prices of CWs for the stocks listed in Hong Kong Exchange is currently undergoing heavy correction, in line with the on-going correction in Hong Kong & China. The valuation given by the table below should be viewed strictly as a rough guide. One should not buy a CW just because it has a low premium. Before buying any CWs, one must make an assessment of the future performance of the underlying share.

As usual, the new CW is highlighted in blue; the CWs expiring in January are highlighted in dark green; the CWs with premium of less than 4% (highlighted in light green) and those with premium exceeding 10% (highlighted in pink).

I have also highlighted the stock code of CHMERCH-C1 in orange because I have made a mistake in the stock code for the underlying share of this CW. Previously, I have stated that the stock code as 133, whereas the correct code is 144.

CWs for Indices as at November 12

Today, we have the listing of a new CW for Hang Seng Index ('HSI'), known as HSI-C3. This was right after the listing of another CW for HSI (known as HSI-C2), which was listed yesterday. Both are Non-collateralised European-style CWs. HSI-C2 was issued by Deutsche Bank while HSI-C3 was issued by CIMB. These add to the existing 4 CWs for market indices, i.e. KLCI-CA, KLCI-CC, HSCEI-C1 & HSI-C1, which are European-style CWs for the Kuala Lumpur Composite Index (‘KLCI’), the Hang Seng China Enterprises Index (‘HSCEI’) & HSI, respectively.


With their high premium, it is best to avoid HSCEI-C1, HSI-C2 & HSI-C3.

Dry Bulk Freight Rates may have peaked

The spectacular rise in the Dry Bulk Freight Rates has propelled the share price of many Dry Bulk carriers, including those listed on our local bourse (such as Maybulk & Hubline). Looking at Chart 1, we can see that the main barometer of Dry Bulk Freight Rates, i.e. the Baltic Drybulk Index ('BDI') has now shown a slight "hookdown". Has the BDI peaked? Only time will tell.

If the BDI have peaked, the ensuing correction would impact the share prices of Dry Bulk carriers severely. From the table below, we can see that the share prices of Dry Bulk carriers listed in the US has corrected by 3-13% on November 12 alone. A closer study of the individual stocks will reveal that their share price has peaked towards the end of October & most of them are off their peak by about 30%. While the peaking in the share prices of our local drybulk carriers (see Chart 2 & 3 for the performance of Maybulk & Hubline, respectively) coincided with their overseas counterparts, their share price correction has been relatively shallow. Thus, we can expect further weakness ahead for these shares. Avoid Maybulk & Hubline for short-term trading.


Chart 1: Baltic Drybulk Rates chart as at November 12 (courtesy of Investment.tools.com)


Table: Drybulk Carriers' Share Price Performance as at November 12 (courtesy of Capital Link Shipping)


Chart 2: Maybulk's weekly chart as at November 12 (courtesy of Quickcharts)


Chart 3: Hubline's weekly chart as at November 12 (courtesy of Quickcharts)

Sunday, November 11, 2007

Latitud- a laggard poised for recovery

Background

Latitude Tree Holdings Bhd ('Latitud') is involved in the manufacturing of wooden furnitures & components. It has production facilities in Kapar & Batang Berjuntai, Selangor as well as Teluk Kalong & Kemaman, Terengganu. In addition, the group has factories in Binh Duong Province, Vietnam and Songkhla Province, Thailand.

Past 5-year Financial Performance

The group's turnover has been increasing steadily over the past 5 years. The main reason for the growth is the group's expansion in Vietnam & then in Thailand. Its net profit track record shows steady growth from FY2003-2006, but this has declined a bit in the current FY2007. Latitud has attributed the drop in the net profit to higher cost of rubber-wood as well as higher freight cost, coating cost & packaging cost (which was brought on by higher oil prices).


Recent Financial Results

Latitud's net profit for QE30/6/2007 decreased by 78.1% y-o-y to RM1.5 million. This was despite a higher turnover, which has increased by 9.4% y-o-y to RM102.6 million. Nevertheless, you will note that Latitud has recovered from a loss of RM0.98 million incurred in the immediately preceding quarter of QE31/3/2007 due to a improved turnover of RM102.6 million, an increase of 9.4% from RM93.8 million recorded in QE31/3/2007.


Current Financial Position

As at 30/6/2007, Latitud's financial position is deemed satisfactory, albeit an increase in gearing ratio was noted. Its liquidity position is healthy as reflected by its current & quick ratio of 1.10 & 0.54 respectively. Gearing ratio has increased to 1.0 times from 0.76 times as at 30/6/2006. The increase in borrowings of RM44 million was used to financed Fixed Assets investment of RM24 million as well as for working capital requirement (due to higher turnover).

In term of working capital management, we will note that the inventory's turnover period has improved from 88 days as at 30/6/2006 to 79 days as at 30/6/2007 while debtors' turnover has declined from 17 days to 16 days during the same periods.

Valuation

Based on FY2007 EPS of 16 sen & last Friday's closing price of RM1.29, Latitud is now trading at a PE of 8 times. At this multiples, I would consider Latitud to be relatively inexpensive.

Technical Outlook

A long-term view of Latitud's price chart shows that the share price has dropped back to its strong multi-year horizontal support of RM1.20 in October (see Chart 1). A break below RM1.20 could send the share price testing its all-time low of RM1.00, which was recorded during the Asian Financial Crisis 1998 period. While this is not impossible, I think that a drawdown risk of RM0.20 (from the horizontal support of RM1.20) is manageable.

Nevertheless, we can see from Chart 2 below that Latitud's share price has in fact begun to recover in the past 2 weeks. The share price has gone above the stock's 10-, 20-, 30- & 50- SMA level. A good entry would be at RM1.20-25 in the event of any pullback in the share price.


Chart 1: Latitud's monthly chart as at November 7 (courtesy of Quickcharts)


Chart 2: Latitud's daily chart as at November 9 (courtesy of Tradesignum.com)

Conclusion

Based on improving financial performance & possible technical recovery, Latitud is a good BUY for the medium-term.

Friday, November 09, 2007

DJIA broke its medium-term uptrend line

DJIA dropped 34 points to close at 13266 yesterday. The day's low was 13080- a loss of 220 points from yesterday's close of 13300. Yesterday's market action will appear on the chart as an inverted hammer, a potentially bullish sign.

Nevertheless, the worst might still be ahead. The last 2 days' trading shows that DJIA has broken marginally below its medium-term uptrend line support of 13400. A quick recovery is very important, but this did not happen yesterday.

The MACD indicator has gone into the negative territory (denoted as 'Z'). In the past 2 instances when this has happened (denoted as 'X' & 'Y'), the index took a sharp dive before recovering. If the same were to recur, the index could test the 13000 level. The index's horizontal supports are at 13300 (S1), the psychological 13000 and 12800 (S2), while its horizontal resistance levels are at 13700 (R1), the psychological 14000 and 14200 (R2).


Chart: DJIA's daily chart as at November 8 (courtesy of Yahoo Finance)

Wednesday, November 07, 2007

Ann Joo had a great 3rd quarter

Ann Joo has just announced its results for QE30/9/2007. Its net profit increased by 27.7% q-o-q or 128.5% y-o-y to RM50.2 million while its turnover has increased by 30.6% q-o-q or 30.7% y-o-y to RM490.6 million. The improved results is attributable to robust international billet market has resulted in higher export to the neighbouring countries namely Indonesia and Vietnam at significantly higher international selling prices … offsetting a lower local sale tonnage as most 9MP projects have not taken off ground. Despite the lower local volume, Ann Joo is compensated by higher selling prices as a follow through from the approved price increases since the second quarter of current financial year (i.e. QE30/6/2007).


Based on the past 4 quarters' EPS of 43 sen and today's closing price of RM4.14, Ann Joo is now trading at a PE of 9.6 times.

From the chart below, it seems that Ann Joo share price has just surpassed its recent high of RM4.06/08 today when it closed at RM4.14. On the back of the substantially better results, there is a good chance that the next upleg for Ann Joo share price may have started.
Chart: AnnJoo's daily chart as at November 7 (courtesy of Tradesignum.com)

Tuesday, November 06, 2007

Shang's net profit jumped in QE30/9/2007

Shangri-La Hotels (Malaysia) Bhd ('Shang') has just announced its results for QE30/9/2007. Its net profit jumped by 239% q-o-q or 212% y-o-y to RM27.8 million while turnover increased by 26.5% q-o-q or 32.8% y-o-y to RM114.1 million.

Shang attributed its improved performance for the current quarter vis-a-vis its previous year's corresponding quarter to "a strong improvement in the operating results of Shangri-La Hotel Kuala Lumpur, and the reopening of Rasa Sayang Resort in late September 2006 following its closure from December 2004 for a major redevelopment & repositioning programme". In addition, its current quarter has improved upon its last quarter's result due mainly to higher occupancy rate of some of its hotels, such as Shangri-La Hotel Kuala Lumpur (from 64% to 79%), Rasa Ria Resort, Sabah (from 73% to 92%) and also the Golden Sands Resort (from 59% to 78%).


Assuming that Shang can maintain this level of earning for a full year, its EPS would jump to 25.2 sen. Based on today's closing price of RM2.33, Shang would be trading at a PE of 9.2 times. That's fairly inexpensive for a strong brand like Shang.

Technically speaking, Shang's share price is still in a medium-term uptrend. It has retreated from its recent high of RM3.00 recorded in June 11. The uptrend line support can be seen at RM2.10, which is also a strong horizontal support.


Chart: Shang's weekly chart as at November 5 (courtesy of Quickcharts)

Based on strong performance, Shang is a BUY for the medium-term. Good entry level would be at the RM2.10-2.20 level, but this may not be possible for now.

Monday, November 05, 2007

Tanjong is testing its medium-term uptrend line

Tanjong plc has just tested its medium-term uptrend line support at RM16.60 and rebounded to close at RM16.80 today. Further test of this uptrend line is possible. If the uptrend line is not violated, this could be a good entry to a solid stock, which is trading at a PE of 12.7 times its trailing 4 quarters' EPS of 133 sen as well as paying a gross dividend of 86 sen (thus, giving a yield of 5.1%).


Chart: Tanjong's weekly chart as at November 2 (courtesy of Quickcharts)

CWs for HK stocks as at November 2, 2007

Today, three new CWs were listed. They are CHMOBIL-C5, HKEX-C5 & ICBC-C4, which are all Non-collateralised European-style Cash-settled Call Warrants. CHMOBIL-C5 & ICBC-C4 were issued by CIMB while HKEX-C5 was issued by Deutsche Bank.

As usual, the new CWs are highlighted in blue. The attractive CWs (with premium of less than 4%) is higlighted in light green while those with premium exceeding 10% are highlighted in pink. I have also highlighted those CWs that will be expiring in January 2008, i.e. in about 3 months' time (in dark green).


With the HSI dropping 1526 points to close at 28942 today, it appears that the HSI is in serious danger of breaching its short-term uptrend- if you were to use the 20-day SMA to plot the uptrend. A quick rebound in HSI is necessary tomorrow, failing which more price correction will follow. This will lead to further correction in the CWs of Hong Kong stocks that are traded on our exchange.


Chart: HSI's daily chart as at November 2 (courtesy of Yahoo Finance)

Friday, November 02, 2007

Unisem's net profit for QE30/9/2007 soared

Unisem announced its results for QE30/9/2007 yesterday. The announcement shows that Unisem's net profit has increased by 13% q-o-q or 73% y-o-y to RM31.1 million while turnover has jumped by 89% q-o-q or 71% y-o-y to RM304.5 million. This quarterly results clearly shows the positive contribution from its recently acquired subsidiary, Advanced Interconnect Technologies Ltd (with the acquisition was completed on July 18).

While the net profit has grown by 13% q-o-q, we must bear in mind that the net profit for QE30/6/2007 was pushed up by reversal of deferred taxation expenses (leading to a positive tax credit of RM5.1 million).


Assuming that Unisem can repeat the same performance, its annual EPS could jump to 26.4 sen. Based on today's closing price of RM1.79, Unisem is now trading at a PE of 6.8 times. This is deemed very undemanding.

Technically speaking, the share price is still in a downtrend. The downtrend would be deemed to be over when the share price has surpassed the RM1.94/95 level.

Chart: Unisem's monthly chart as at November 1 (courtesy of Quickcharts)

Nevertheless, based on attractive valuation, Unisem would be a BUY for long-term investment.