Tuesday, September 30, 2008

Maybank-BII deal concluded?

If there is one thing that one can learn from the negotiation for the passage of the U.S. Bailout Deal, this is it-- a deal is only a done deal when everyone has signed on the dotted line. So, the same would apply to the Maybank-BII deal, which appears to be nearing its conclusion.

As noted in my previous post, the deal may be doable if Fullerton can further reduce the selling price to address Maybank's concern for overpaying for BII and subsequently having to make huge goodwill writeoff. To wit:
If Fullerton & Maybank can agree that a fair deal is one where BII is valued at 3.0 times its book value, then Fullerton may further lower its selling price by USD121 million (on top of the earlier USD165 million reduction). Would that happen? We will have to wait & see.

After the close of the market today, we have an announcement that Fullerton has offered to lower its selling price by 14.7% (i.e. an additional 3.7% on top of the 11% reduction proposed earlier) and Maybank has accepted this offer; thus signaling the conclusion of its BII acquisition. This is less than the figure that I have put up earlier (where I envisaged total discount of 19.1%, pegging the selling price at 3.0 times BII's book value) but it is enough to seal the deal.

Based on the reduced purchase price for the 55.5%-stake in BII of USD1.279 billion (or, RM4.400 billion), the total acquisition cost of BII will amount to USD2.304 billion (or, RM7.927 billion).

Salam Aidilfitri to All Muslim Readers


I wish all Muslim readers "Selamat Hari Raya". I believe that most of us could do with a short break in order to recover from the stress of a volatile market. So, for the next two days, try not to read too much market news & spend more quality time with friends & family.

Dow plummets record 777 points as financial rescue fails

That's from Yahoo Finance (here). I don't think anyone can make much sense from what's happened. A stunning defeat! That's what you get from dysfunctional politics.

Monday, September 29, 2008

Maybank in a Catch-22 situation

The other interesting news over the weekend is Maybank's rejection of a revised offer from Fullerton Financial Holdings ('Fullerton'), to lower the selling price of its 55.5%-stake in Bank Internasional Indonesia ('BII') by 11% from USD1.5 billion (or, RM5.16 billion) to USD1.335 billion (RM4.59 billion). This is the latest blow to the deal after Bank Negara via its letter dated 25 September 2008 informed Maybank that their earlier approval is now subject to the following conditions:
(a) Maybank to obtain an extension to the 26 September 2008 deadline, being the last date to fulfill the conditions precedent as stipulated in the Share Sale Agreement dated 26 March 2008; and
(b) Maybank to obtain a new agreement on a purchase price that will not result in substantial impairment under the international financial reporting standards that would impact the fundamental financial soundness of Maybank.

There has been quite a lot of criticism of Bank Negara's intervention in what is essentially a commercial transaction carried out by Maybank. Some have criticized Maybank's management for its aggressive overseas expansion, where it has paid excessively for its acquisition of BII as well as its 15%-stake in Pakistan’s MCB Bank. If Fullerton refused to lower the selling price further and the BII deal is aborted, Maybank may lose more than the deposit of RM480 million. Fullerton is likely to sue for damages under the terms of the Share Sale Agreement ('SSA'). As such, we could see more downside to Maybank's share price in the near-term.

From the chart below, we can see that Maybank (closed at RM6.90 as at Sept 26th, but suspended today) is now resting on its immediate horizontal support of RM6.85. A break of this support will send the stock to the psychological support of RM6.00 and thereafter to horizontal support levels of RM5.65 & RM5.00.


Chart: Maybank's monthly chart as at September 26, 2008 (source: Quickcharts)

Fundamentally, Maybank is now trading at a P/Book of 1.75 times (based on its NTA per share of RM3.95 as at 30/6/2008). This is very attractive valuation for a well-managed commercial bank, especially the top bank in Malaysia. However, most analysts do not share this sentiment, ever since Maybank began its regional expansion program.

How much damages could Fullerton recover from Maybank if the BII deal is aborted. That will depend on the terms of the SSA & how much the new buyer will pay for Fullerton's BII stake. Assuming that it can find a buyer for its 55.5%-stake at 3.0 times its book value (due to the current poor sentiment for bank stocks), Fullerton may sue Maybank for the loss equivalent to [4.6 - 3.0] times BII's book value (note: Maybank had agreed to acquire BII from Fullerton at 4.6 times its book value). The amount of damages could be about USD522 million (or, RM1.796 billion). Alternatively, if Fullerton can sell the BII stake at only 2.5 times its book value, it may sue Maybank for the loss equivalent to [4.6 - 2.5] times BII's book value. The amount of damages it will seek to recover will be USD685 million (or, RM2.356 billion).

On the other hand, if Maybank were to proceed with the deal, it will have to incur goodwill writeoff (or, actual losses on divestment as stipulated by Indonesian central bank). Goodwill writeoff will become an issue when you acquired a company for more than its underlying assets' value, unless you can convince your auditors that there is no impairment to the asset value. To do so, you need to show your auditors that the acquired company's profitability has increased. The probability of a drop in BII's bottom-line in the next few years is significant, given the slowdown in the global economy. Bank Negara is very concerned on this issue & has put its reputation at stake in order to help Maybank. How much goodwill writeoff are we looking at? Again, if the writeoff is to lower the investment value to a certain multiple of its book value, we can estimate the amount to be about USD643 million (or, RM2.212 billion)- if fair book value is deemed to be 3 times book value- or USD937 million (or, RM3.223 billion)- if fair book value is deemed to be 2.5 times book value. Based on Maybank's NTA of RM19.28 billion as at 30/6/2008, the goodwill writeoff could reduce the NTA by 12-17%.


If Fullerton & Maybank can agree that a fair deal is one where BII is valued at 3.0 times its book value, then Fullerton may further lower its selling price by USD121 million (on top of the earlier USD165 million reduction). Would that happen? We will have to wait & see.

Accord reached on U.S. Bailout Plan

Over the weekend, US lawmakers reach an accord on the Bailout Plan to resuscitate the US financial system. DowJones' Financial News Online reported that "dramatic improvements to the original Bush-Paulson plan to stabilize American financial markets—including cutting in half the Administration's initial request for USD 700 billion and requiring Congressional review for any future commitment of taxpayers' funds. If the government loses money, the financial industry will pay back the taxpayers."

The Summary of the draft proposal to rescue US financial markets envisages Three Phases of a Financial Rescue with Strong Taxpayer Protections
• Reinvest in the troubled financial markets … to stabilize our economy and insulate Main Street from Wall Street
• Reimburse the taxpayer … through ownership of shares and appreciation in the value of purchased assets
• Reform business-as-usual on Wall Street … strong Congressional oversight and no golden parachutes

For more on the proposal, go here.

After this news, one may expect a big rally in Asian stock markets this morning. After an initial rally, most of the markets are in negative territory. What's wrong? Is this a case of "buying-on-rumors and selling-on-news"? Are investors disappointed with some of the safeguards to be imposed to protect taxpayers such as:
• Cuts the payment of $700 billion in half and conditions future payments on Congressional review
• Gives taxpayers an ownership stake and profit-making opportunities with participating companies

We will have to wait & see how the markets digest this news in the days and weeks ahead. My feelings is that the rescue package will help stabilize the financial markets & put a floor on the stock markets.

Friday, September 26, 2008

BDI plunged 7.26% yesterday!

The Baltic Exchange Dry Index ('BDI') dropped a whopping 7.26% or 326 points to close at 4163 point, yesterday. The sharp drop in BDI is very clear sign of a slowdown in the global economy. Sham Gad, writing for TheStreet.com, noted that "...China, the 800-pound gorilla, which seems to be losing its appetite for commodities. At the end of August, iron ore inventories sitting in Chinese ports increased to 70 million tons, the highest level this year."

The present turbulence in the financial market could however prove to be a positive for dry bulk shippers as it helps to tackle one of the biggest concerns facing the group, i.e. the new supply of ships that are coming on board over the next three to four years. At one count, the number of ships contracted to be built over the next few years stood at 10,000. Now, it looks like many of them will not be built due to the tightening credit and lending markets. Morgan Stanley estimates that over $22 billion in ship orders could be canceled in the next few years. Given the time lag to construct a new ship, any supply constraints could lead to a rebound in shipping rates.


Chart: Baltic Drybulk Rates' daily chart as at September 25, 2008 (courtesy of Investment.tools.com)

The plunging shipping rates would be negative for shipping companies, such as Maybulk, Hubline & Sweejoo, while the cancellation of shipbuilding contracts may impact local shipbuilders, such as Coastal Contracts as well as companies providing marine engineering works.

U.S. Bailout Plan breaks apart

Urgent efforts to lash together a $700 billion rescue plan for the national economy broke apart Thursday night, hours after key lawmakers had declared they had reached a deal. This was reported in Yahoo Finance (for more, go here).

One of the best argument against the bailout plan was out forward by James Galbraith in today's Washington Post. Galbraith opined that the credit crisis could be handled by expanding existing program, such as FDIC. His take:
Now that all five big investment banks -- Bear Stearns, Merrill Lynch, Lehman Brothers, Goldman Sachs and Morgan Stanley -- have disappeared or morphed into regular banks, a question arises.

The point of the bailout is to buy assets that are illiquid but not worthless. But regular banks hold assets like that all the time. They're called "loans."

With banks, runs occur only when depositors panic, because they fear the loan book is bad. Deposit insurance takes care of that. So why not eliminate the pointless $100,000 cap on federal deposit insurance and go take inventory? If a bank is solvent, money market funds would flow in, eliminating the need to insure those separately. If it isn't, the FDIC has the bridge bank facility to take care of that.

Next, put half a trillion dollars into the Federal Deposit Insurance Corp. fund -- a cosmetic gesture -- and as much money into that agency and the FBI as is needed for examiners, auditors and investigators. Keep $200 billion or more in reserve, so the Treasury can recapitalize banks by buying preferred shares if necessary -- as Warren Buffett did this week with Goldman Sachs. Review the situation in three months, when Congress comes back. Hedge funds should be left on their own. You can't save everyone, and those investors aren't poor.

With this solution, the systemic financial threat should go away. Does that mean the economy would quickly recover? No. Sadly, it does not. Two vast economic problems will confront the next president immediately. First, the underlying housing crisis....The second great crisis is in state and local government.

Via Naked Capitalism.

Monday, September 22, 2008

Haio's topline & bottomline slipped in 1Q2008

Haio has just announced its results for 1Q2009 ended 31/7/2008. Its net profit increased by 92.6% y-o-y to RM13.6 million from RM7.1 million previously, while turnover increased by 90.5% from RM58.3 million to RM112.9 million. However, when compared to the 4Q2008, net profit dropped by 28.2% on the back of a 15.5%-decline in turnover. Haio, which had enjoyed strong growth from its MLM division, attributed the drop in turnover to poorer consumer's purchasing power as a result of higher cost of living. The reduced turnover, coupled with higher operating expenses (due to higher fuel costs), has led to a sharp drop in net profit.


Haio (closed at RM3.34 as at September 19th) is now trading at a trailing PE of 4.5 times (based on its last 4 quarters' EPS totaling 72 sen) or at a P/Book of 1.7 times (based on NTA of RM1.93 per share). At these multiples, Haio share price is considered attractive.

From the chart below, Haio is still in an uptrend. One quarter of profit decline may not dampen investors' sentiment for this stock. For now, this stock is likely to trade sideway between RM3.00 & RM3.60. A break below RM3.00 could be the first sign of danger ahead, while a break below RM2.70 (coinciding with the low of RM2.71 recorded in March 2008) would satisfy one of the two conditions for the start of a downtrend (i.e. a lower 'low' & a lower 'high'). For now, one can hold onto this stock, due to its attractive valuation. If it rebound to RM3.50-60, you may like to reduce some position & taking some profit from your earlier investment.


Chart: Haio's weekly chart as at September 19, 2008 (source: Quickcharts)

U.S. Bailout Plan may face stiff opposition

The US government has proposed to buy up to $700 billion of mortgage assets, in a bid to end financial carnage on Wall Street. The key elements are as follows:

* Buy any mortgage-related assets, both residential and commercial, for a two-year period. The types of mortgage assets this could cover and how long the government could hold them is left wide open, as is how they would be valued.
* Up to $700 billion in mortgage assets could be bought at any one time.
* Broad authority granted to decide how to purchase, manage and dispose of the assets, including setting up a special fund and naming financial institutions to work for the Treasury Department.
* Assets must have been originated or issued before September 17, 2008, by a bank or financial institution with U.S. headquarters.
* The Treasury Secretary would be given these powers to ensure stability or prevent disruption of financial markets and to protect the taxpayer.
* No court or government agency could review the secretary's decisions. The secretary would report to Congress within the first three months and then twice yearly.
* The U.S. debt limit would be increased by $700 billion to fund the plan, to $11.315 trillion from $10.615 trillion.

For more on the proposal, check out WSJ.online & Marketwatch.

The proposal in the current form is likely to face stiff opposition from Democrats-controlled Congress. While the Bush administration's primary goal was "to stabilize the financial markets by removing hundreds of billions of dollars in “illiquid assets” from the balance sheets of banks and financial institutions", this sentiment may not be shared by Democratic lawmakers, who may insist that any plan would also have "to provide relief to millions of families that were poised to lose their homes to foreclosure".

The second important issue is the need to sort out the pricing for the buying of the mortgage assets. As noted by WSJ.online:

However, the government may find itself in a quandary: Does it pay more than fair-market value for hard-to-assess distressed assets, putting taxpayers on the hook for any losses? Or does it drive a hard bargain, buying for pennies on the dollar? The latter approach would further hurt financial institutions, since they would have to write down the losses and take additional hits to their balance sheets. The Treasury department, which hasn't commented on specifics about the plan, is expected to propose issuing debt in $50 billion tranches to fund the purchases.


For more on the short-comings of the proposal, you may like to read Paul Krugman's article entitled "No Deal", or Sebastian Mallaby's piece entitled "A Bad Bank Rescue" or The Aleph Blog's "Oppose The Treasury's Bail-out Plan".

I believe that the proposed bank rescue is likely to put a floor on the market for mortgage assets as well as the stock markets. From this temporary bottom, the stock markets are likely to rally higher in the weeks ahead. However, the short-term outlook is hard to predict, due to the opposition to the proposal. I believe that the Friday's rally could see strong profit-taking in this week, which could come as early as Tuesday. For those who are looking to buy some stocks, you can wait for a pullback in the latter part of this week. For traders, you may like to use the Monday's rally to do some profit-taking.

Friday, September 19, 2008

Market Outlook as at September 19, 2008

The KLCI had a very volatile session yesterday. It opened (with a gap down) at 993.2 & thereafter it made a low of 963.3, before rebounding to close at 991.7. This morning, it opened (with a gap up) at 1003.8 & climbed higher. As at 10.30 am today, the KLCI was up 21.0 points at 1012.6. If today's market action can stay positive (say, the KLCI ending the day with a gain of 15 points or more), then we will have a bullish confirmation of yesterday's potential reversal, which is called a doji in Japanese Candlesticks charting. For more on Doji & Bullish Confirmation, see the explanation below.

If the bullish reversal were achieved, I expect the KLCI to continue to move upward, with initial resistance at the horizontal line at 1065 & medium-term downtrend line at 1070-75. Thereafter, the KLCI will face resistance at the horizontal lines at 1100 & possibly 1165. The most important resistance will come from the downtrend line at 1070-75 level. If the KLCI can surpass this hurdle, the short to medium-term outlook for the market will improve considerably.


Chart: KLCI's daily chart as at September 18, 2008 (source: Quickcharts)

Doji & Bullish Confirmation (from the ChartSchool of Stockcharts.com)

After a decline, or long black candlestick, a doji signals that selling pressure is starting to diminish. Doji indicate that the forces of supply and demand are becoming more evenly matched and a change in trend may be near. Doji alone are not enough to mark a reversal and further confirmation may be warranted.

The actual reversal indicates that buyers overcame prior selling pressure, but it remains unclear whether new buyers will bid prices higher. Without confirmation, these patterns would be considered neutral and merely indicate a potential support level at best. Bullish confirmation means further upside follow through and can come as a gap up, long white candlestick or high volume advance. Because candlestick patterns are short-term and usually effective for only 1 or 2 weeks, bullish confirmation should come within 1 to 3 days after the pattern.

Thursday, September 18, 2008

US markets- A rebound around the corner?

I like to introduce to you a new indicator, VIX. From Wikipedia, we learn that VIX is the ticker symbol for the Chicago Board Options Exchange Volatility Index, a popular measure of the implied volatility of S&P 500 index options. Referred to by some as the fear index, it represents one measure of the market's expectation of volatility over the next 30 day period.

VIX is used by some analysts as a contrarian indicator, whereby a very high reading could be a sign that the market is deeply oversold & is due to move sharply to the opposite direction. From Chart 1 below, we can see whenever VIX hit a high of 35 point or more (preferably 37 & above), the DJIA had already made a low & thereafter, DJIA would rebound back. See the extreme readings marked as 'A, B, C & D'.


Chart 1: DJIA & VIX weekly chart as at September 17, 2008 (Source: Stockcharts.com)

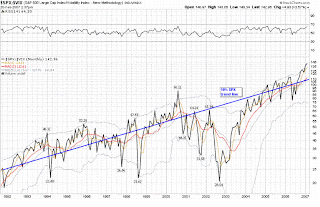
We are talking about the short to medium-term outlook, in the foregoing paragraph. The long-term picture, as painted by my yesterday's post, remained unchanged. For long-term analysis, one may use the S&P500:VIX ratio. According to VIX & More, the S&P500:VIX ratio tends to be mean-reverting around the long-term trend line (i.e. a 10% trend line). From Chart 2 below, we can see that the path back to the mean can be a long and difficult one. For more on S&P500:VIX, check out these 2 posts in VIX & More (here & here).


Chart 2: S&P500:VIX monthly chart from 1992 to 2007 (Source: VIX & More)

My personal observation is that the market may have hit a bottom when S&P500:VIX hit a low of 21 or below. This had happened in 1994 & 1998 (which were the lows achieved within a bull market) as well as in 2002 (a low recorded during a bear market). I have appended a weekly chart of S&P500:VIX with the ratio presently above 30 (i.e. the reading has yet to reach a low of 21 or below). I must admit that I am still fine-tuning the parameters for my weekly chart of S&P500:VIX (Note: VIX & More uses monthly chart), as I am using the free service of Stockcharts.com where I have access to weekly data only. Nevertheless, I believe that the chart is adequate for the purpose of getting a reading of the ratio of S&P500:VIX.


Chart 2: S&P500:VIX's weekly chart as at September 17, 2008 (Source: Stockcharts.com)

In conclusion, I believe there is a good chance that the US stock markets may rebound in the near future. This rebound may only be a short-term rebound, while the long-term outlook remained bearish. For those with big position in the market, you may wait for this rebound to trim your position (instead of selling at the current depressed prices). For those buying for the long-term investing, this level is a good entry to accumulate some stocks since we can never be sure where the bottom is. Good luck!

US Dollar Index testing its short-term uptrend line

The US financial crisis has taken a heavy toll on the US Dollar. The USD index peaked at 80.38 point on September 11th & has corrected back to its short-term uptrend line support of 78 point as at yesterday. A break of this uptrend line would send the USD index back to its horizontal support of about 74-75 point (see Chart 1 below).


Chart 1: USD Index's daily chart as at September 17, 2008 (source: Stockcharts.com)

Commodities have benefited from the on-going correction in the USD. From Chart 2 & 3 below, we can see that WTIC & CRB have been rebounded off their recent low. The biggest rally was seen in Gold, where Gold for immediate delivery surged $84.67, or 11 percent, to $864.42 at 4:42 p.m. New York time. For the 1 year chart, see Chart 4 below. For current 24-hour Spot Gold, go here.


Chart 2: WTIC's daily chart as at September 17, 2008 (source: Stockcharts.com)


Chart 3: CRB's daily chart as at September 17, 2008 (source: Stockcharts.com)


Chart 4: Gold's daily chart as at September 17, 2008 (source: BullionVault.com)

If the USD index were to break below its uptrend line support of 78 point, the CPO prices may also rebound. This would be positive for plantation stocks, especially since they are so badly beaten down. I believe stocks, such as IOI, PPB, KLK, Asiatic & Sime, could rebound back if this scenario happened.

Wednesday, September 17, 2008

US markets may have more downside

I think many of us are quite familiar with the US financial crisis that has been raging for the past one year. After the takeover of Bear Stearns by JP Morgan in May (with backstops provided by the Federal Reserves), many investors thought the financial markets would be able to find a firmer footing. I guess they were very wrong. Things are deteriorating so fast now that people will not easily forget this September. This September will be remembered as the "Black September", like Monday, 19th of October, 1987 will always be remembered as the "Black Monday".

In just 10 days, some of the biggest names in the US financial markets had either imploded or bailed out or taken over. On September 7th, Fannie Mae & Freddie Mac were placed into conservatorship of the Federal Housing Finance Agency. On September 14th, Merrill Lynch was acquired by Bank of America. On the following day, Lehman Brothers filed for bankruptcy protection. This morning (September 17th), Federal Reserves announced plan to acquire 80%-stake in American International Group ('AIG') for USD85 billion. Who is next? Goldman Sachs? Morgan Stanley? Who knows?

Some people are beginning to wonder why the US stock markets drop so little in the face of so much problem. Todate, the US markets have declined by 20-25% as compared to a 80%-drop in the KLCI during the Asian Crisis of 1998. One of the missing ingredients could be a currency crisis-- something that is unlikely to happen as long as the US Dollar is the global reserve currency. Nevertheless, I believe that the US stock markets are likely to drop further.

From Chart 1 below, we can see that the S&P500's 100-day SMA had cut below its 200-day SMA and the 200-day SMA had cut below the 400-day SMA. The 400-day SMA had hooked down. The last time the 400-day SMA hooked down in early 2001, the S&P500 entered into a bear market that lasted for 2 year (to early 2003)- losing another 25% of its value.


Chart 1: S&P500's daily chart as at September 16, 2008 (source: Yahoo Finance)

I have also appended below the Dow Jones Composite Average, which comprises 65 stocks that are all components of either Dow Jones Industrial Average or Dow Jones Transportation Average or Dow Jones Utility Average. The 400-day SMA of this blue-chip barometer is still flattish & has not hooked down yet. Its 100-day SMA & 200-day SMA had cut below the 400-day SMA. The last time this had happened, was in 2nd half 2001 when this index dropped about 25-30% over the next 1 & 1/2 years.


Chart 2: DJ Composite's daily chart as at September 16, 2008 (source: Yahoo Finance)

Should we avoid our local stock market if the US stock markets were to enter into a pro-longed bear market. Looking at Chart 3 below, we can see that the KLSE had a mini-rally during the 2001-2002 period. Part of the reason could be that our stock market had dropped very sharply in 2000. The same may be said about our stock market today, i.e. it had dropped about 35% from its peak of 1524 in January.


Chart 3: KLCI's monthly chart as at September 16, 2008 (source: Quickcharts)

In conclusion, I am bearish on the US stock markets, which may have more downside. While I am bearish on our local stock market, I believe that our downside may be limited. This is not inconsistent with the scenario outlined in my earlier post dated September 11th (go here) where our bear market could last until the middle of next year.

Tuesday, September 16, 2008

CPO breached the RM2400 support

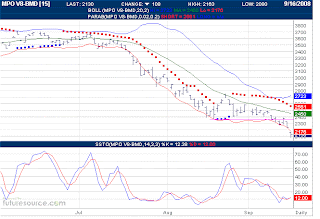
CPO has broken below its RM2400 support last Tuesday (September 9th). Despite a strong rebound last Friday (September 12th), there was no follow-through this Monday. The November delivery contract dropped RM140 to RM2240. As at 4.45 pm today, the same contract was down RM112 to RM2128. From the daily chart (Chart 1) below, we can see that the Bollinger Bands are beginning to expand. This indicates that the CPO prices may have more downside.


Chart 1: CPO's daily chart as at September 15, 2008 (source: ifs.marketcenter.com)

At the same time, we can see that Soya Oil had just broken its uptrend line that stretched back to October 2006 (see Chart 2 below). It had earlier breached the strong horizontal support at 49-50 mark.


Chart 2: Soya Oil's weekly chart as at September 15, 2008 (source: futures.tradingcharts.com)

Friday, September 12, 2008

BDI broke below the psychological 5000 mark

The Baltic Exchange Dry Index ('BDI') provides "an assessment of the price of moving the major raw materials by sea," as the Baltic Exchange puts it (go here). As such, it provides an accurate barometer of the volume of global trade as well as a good leading indicator for economic growth and production.

So, one should be quite worried when the BDI takes a big fall. From the chart below, we can see that the BDI has been sliding since making a high of 11750 in May this year. The BDI lost 133 points to close at 4893 yesterday. This means that the strong psychological support of 5000 mark has been violated. We can expect further weakness ahead.


Chart 1: Baltic Drybulk Rates' daily chart as at September 10, 2008 (courtesy of Investment.tools.com)

The weakness in BDI should, at the very least, mean poorer results for shipping companies, unless they have entered into long-term charters. Looking at Maybulk's weekly chart below, we can see that the stock is now in a downtrend. Its immediate support is at RM3.00 & thereafter at RM2.50. Avoid Maybulk for now.


Chart 2: Maybulk's weekly chart as at September 11, 2008 (source: Quickcharts)

US Steel industry faces a bleak outlook

The slump in the US steel industry may worsen for the next few quarters. In late August, it was reported that US steel producers has rescinded their plans for a September price hike on carbon steel sheet products (go here). Now, these producers are looking into hefty production cutback in the face of slowing demand for their products (go here). Both reports appeared in the American Metal Market's website and were picked up by NakedShorts.

The poor outlook for US steel makers can also be seen in the performance of the US steel index, DJUSST (below). The index, which peaked in May-June 2008 at the 550-560 level, has now broken below the 100-week SMA at the 400 mark. The index closed at 325 mark yesterday, not very far from the strong psychological support of 300.


Chart: DJUSST's weekly chart as at September 11, 2008 (source: Stockcharts.com)

The weakness in US steel may reflect the slowdown in the US & the global economy, which will impact our economy as well as our stock market.

Tenaga & IPPs- the Windfall Profit Tax Saga

The government has reversed its earlier decision to levy the windfall profit tax on independent power producers (IPPs) with immediate effect and replace it with a one-off payment instead. The earlier windfall profit tax is a 30% levy on any excess above 9% of the fixed assets. The excess is based on earnings before interest and tax.


The Windfall Profit Tax story (in brief). [Source: Business Times]

The imposition of the "30% windfall profit tax on the IPPs in June sent shockwaves throughout the industry. RAM Ratings had warned that a third of the RM30 billion IPP-related bonds it rated were likely to be affected. Bankers also said that the move would make it costlier for IPPs to finance future projects." as reported by Business Times (go here).

The government has now decided that the IPPs would make a one-off payment equivalent to the levy for one year as well as to suspend power purchase agreement (PPA) renegotiations pending a comprehensive study into the restructuring of the electricity supply industry. Last month, the IPPs had made their first quarterly payment of the the windfall profit tax. With this decision, I believe the IPPs will soon make another payment equivalent to 3 times of the amount of the first payment & that will be the end of the story.


IPPs' first quarterly payment made in August 2008 (Source: The EdgeDaily)

This decision will be "negative" for Tenaga, but "positive" for all the IPPs as well as tolled-road concession-holders. The latter was supposed to be the next batch of concession-holders to be hit by the windfall profit tax.

From the chart below, I expect Tenaga to test its immediate support at the previous gap-up level of RM7.50. If the RM7.50 support level cannot hold- which I think will be the likely scenario- then, Tenaga will drift to the support level of RM7.00 & RM6.50. For now, we should avoid Tenaga.


Chart: Tenaga's daily chart as at September 10th, 2008 (source: Tradesignum.com)

Thursday, September 11, 2008

How much longer & farther can this bear market fall?

Before I proceed to answer the above question, I like to say that we are going into the area of forecasting, which is not one of the strong point of technical analysis. Nevertheless, it is good to examine the potential downside for the market, in term of possible point lost as well as time taken, before the bull returned.

Let's proceed to define what's a bear market using the following:
1) the monthly chart for the past 15 years;
2) MACD indicator (with moving average calculated on "weighted" basis); and
3) Williams' %R indicator.

As noted in an earlier post (go here), we have seen that a hook-down in the MACD can pinpoint a potential market top. I have added the Williams' %R indicator to weed out period when we have a hook-down in the MACD but the index seems to defy gravity (such as the period from 2004 to 2006). During that period, the Williams' %R indicator did not drop into the oversold territory. So, a bear market happened when the MACD has hooked down & the Williams' %R has gone into the oversold territory.

From Chart 1 below, we can see that there were three periods which satisfied the above conditions for a bear market. They are denoted as 'A, B & C' but we can exclude 'C' because it is too shallow & short to be a true bear market. Looking at 'A' & 'B', we can see that a bear market can last 17-19 months (or, averaging 18 months).


Chart 1: KLCI's monthly chart as at August 28th, 2008 (source: Quickcharts)

Using Fibonacci retracement to estimate the potential target in the current bear market, we can see that a retracement of 38.2%, 50.0% & 61.8% of the distance traveled from the 1998 low of 261 to the 2008 high of 1524 would put the market at about 1041, 892 & 743, respectively (see Chart 2 below). For more on Fibonacci retracement, go here, here & here.


Chart 2: KLCI's monthly chart as at August 28th, 2008 [overlaid with Fibonacci retracement] (source: Quickcharts)

Based on the above, I think that the bear market could last another 9 months to the middle of next year. If that were to happen, it is quite likely that the market will retrace more than 38.2% (to 1041) since we are currently at 1045 (at the close of this morning session). While the 38.2%-retracement (to 1041) is still possible in the scenario of a big swing market (like 1994-1996, as highlighted in this post), it is more likely that the retracement will be 50% (to 892) or, even 61.8% (to 743).

With the KLCI now breaking the long-term uptrend line support at 1050-60, we have to very careful with all trading position. Those buying for long-term investment purpose may continue to do so, albeit at a slower pace. On the other hand, if we have a quick recovery above the long-term uptrend line (say, 1050-60), then the uptrend line will stay intact for now. And, if this is followed through with a rally above the immediate downtrend line (say, 1090-1100), then the scenario of a big swing market (with the 38.2%-retracement to the potential target of 1041) may play out. So, watch the market closely for the next few days!

Wednesday, September 10, 2008

US Dollar recovery & its consequences

The recovery in the US Dollar, which can be clearly seen from its breakout above its downtrend line (see Chart 1 below), had led to sharp correction in many commodities as well as many currencies. The most notable is the correction in Crude Oil, where it broke its uptrend line last week (as noted in my earlier post, here). In addition, we can see that EURO & Gold have weakened sharply & broke below their respective uptrend line (see Chart 2 & 3 below). After its sharp run-up in the past 2 months, US Dollar is quite over-bought & may enter into a consolidation phase.

The recent Fannie Mae & Freddie Mac bailout could also have some short-term negative impact on the US Dollar. On the medium to long-term, the re-capitalized Fannie Mae & Freddie Mac could provide additional financing to US house buyers & this could help to slow the slump in the housing market. A recovery in the housing market would be positive for the US economy & the US Dollar.


Chart 1: USD's weekly chart as at September 9, 2008 (source: Stockcharts.com)


Chart 2: EURO's weekly chart as at September 9, 2008 (source: Stockcharts.com)


Chart 3: Gold's daily chart as at September 9, 2008 (source: BullionVault.com)

Market Outlook as at September 9, 2008

From Chart 1 below, we can that the KLCI has been holding above the horizontal support of 1065 for the past 2-3 weeks. The overhead downtrend line will continue to cap any rebound in the market.


Chart 1: KLCI's daily chart as at September 9th, 2008 (source: Tradesignum.com)

This morning, the KLCI opened lower, at 1062 level. Despite a quick rebound to an intra-day high of 1068, the KLCI closed the morning session at 1064 level. The weakness in the KLCI is due to weakness among the plantation stocks, which was brought on by a drop in CPO prices. Further weakness could send the KLCI to the 1050-60 level, which is the long-term uptrend line (see Chart 2 below). If & when that happened, we can only hope that the KLCI would have a good rebound-- maybe a rally that can break above the prevailing downtrend line. Given the current global economic weakness & our internal political problem, that may look like wishful thinking.


Chart 2: KLCI's daily chart as at September 9th, 2008 (source: Tradesignum.com)

Friday, September 05, 2008

HUAAN dragged down by steel sector's correction

HUAAN is involved in the production of metallurgical coke and related by-products. Coke is used as the main fuel in iron-making blast furnaces. HUAAN's plants are located in Linyi City, Shandong Province. Shandong Province & the nearby provinces are the center of steel making in China.


Recent Financial Results

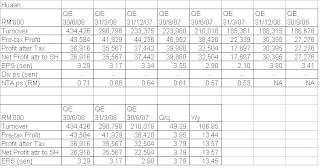
HUAAN had recently announced its results for 2Q2008 ended 30/6/2008. Its net profit increased by 3.8% q-o-q or 13.6% y-o-y to RM36.9 million, while its turnover jumped by 49.4% q-o-q or 106.9% y-o-y to RM434 million. The huge increase in turnover was attributable to the sharp increase in selling prices of its products. Unfortunately, HUANN's raw material prices had also increased substantially. This-- coupled with escalating fuel costs and under-utilization of the additional production capacity of 600,000 tonnes (completed in May)-- led to a drop in its gross profit margin from 18% in 1Q2008 to 13% in 2Q2008.


Prospect

The current global slowdown in demand for steel could lead to the lower demand for metallurgical coke. In addition, HUAAN's results for 3Q2008 could be affected by the recent Beijing Olympic in 2 ways:
1) A possible drop in the demand for steel as all Games-related construction projects were nearing their completion; and
2) A possible drop in the demand for coke because of plant shutdown around Beijing during the Olympic Games (because of heavy pollution).

Valuation

Based on its closing price of RM0.445 today, HUAAN is trading at a trailing PE of 3.4 times (based on its last 4 quarters' EPS of 13 sen). While this may look cheap, the current correction in the steel sector could mean lower profit for HUAAN going forward.

Technical Outlook

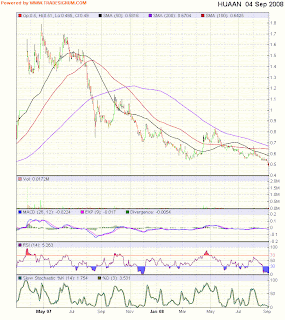
The share price broke below its horizontal support of RM0.54-55 on September 2nd. As such, its downtrend is very much intact, contrary to my earlier call that this stock has broken its downtrend (go here).


Chart: HUAAN's daily chart as at September 4th, 2008 (source: Tradesignum.com)

Conclusion

Based on possible drop in its profit level in the coming quarter & continued bearish outlook, it is advisable to avoid HUAAN for now.

Thursday, September 04, 2008

Uchitec to benefit from a weakened RM

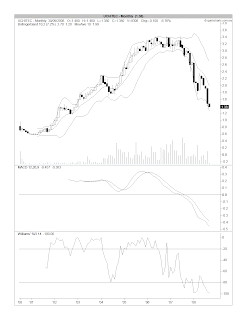
Uchitec has recently announced its results for 2Q2008 ended 30/6/2008. Its net profit dropped 11.7% q-o-q or 24.2% y-o-y to RM16.4 million, while its turnover declined 8.9% q-o-q or 16.5% y-o-y to RM33.5 million. The financial performance of Uchitec has been impacted significantly by the appreciation of the RM, while its revenue (denoted in US Dollar) is pretty much intact. From the first table below, we can see that its turnover in US Dollar dropped by a mere 4.2% y-o-y in 1H2008, while in RM term, the decline was 11.1%. There is a good prospect that the present depreciation in the RM would be very positive for Uchitec.


Technically speaking, Uchitec is still in a downtrend. There may be some support at the RM1.15-35 level, but this support level is not very strong.


Chart: Uchitec's monthly chart as at September 3rd, 2008 (source: Quickcharts)

Based on the potential improvement in its financial performance, Uchitec is a stock worth tracking closely. Those with a contrarian approach may choose to slowly accumulate this stock, especially if the RM1.15-35 support level can hold.

US Dollar has made a "Golden Cross"

As noted in BespokeInvest, the "US Dollar index has made a "golden cross" today, as its 50-day moving average has crossed above its 200-day moving average as both are rising. The "golden cross" is viewed as a positive by market technicians, as it is thought to signal a significant favorable turning point". For more, go here.


Chart 1: US Dollar index as at September 3rd, 2008 (Source: BespokeInvest)

The strengthened US Dollar would further compound the weakness in the Ringgit (due to political turmoil and sharply higher inflation rate)-- leading up a higher USD/MYR exchange rate. From Chart 2 below, we can see that the USD/MYR has gained 16 handles (or, 1600 points) in just 3 weeks since breaking above its ascending triangle at the 3.28 level on August 8th. The USD/MYR's upcoming resistance levels are at the downtrend line resistance of 3.48 & the horizontal line resistance of 3.52 (see Chart 3 below).


Chart 2: USD/MYR's weekly chart as at September 3rd, 2008 (source: Saxo Bank Datacentre, via Passion-Trading.com)


Chart 3: USD/MYR's monthly chart as at September 3rd, 2008 (source: Saxo Bank Datacentre, via Passion-Trading.com)

Wednesday, September 03, 2008

Crude Oil broke its 20-month uptrend line

Crude Oil broke the uptrend line that started in January 2007, yesterday. Unless a quick reversal were to happen-- with Crude Oil recovering above its uptrend line (say, at USD115-118 level)-- this breakdown could signal lower prices for the months ahead.

We can see the breakdown in Crude Oil prices in the upper chart (below), while the lower chart shows the index of US Airline sector ('XAL'). If XAL can break above its 20-month downtrend line (say, at the 32-33 level), then we can see further recovery in the share prices of US airlines (and, hopefully airline stocks on our local bourse). The bearish breakdown of the WTIC index does not necessarily lead to a bullish breakout for the XAL index, because many airlines are struggling with lower load factor (due to a drop in consumer demand) as well as high level of debts (due to aggressive expansion undertaken in recent years).


Chart 1: WTIC & XAL's weekly chart as at September 2nd, 2008 (source: Stockcharts.com)

Media- an attractive long-term investment

Background

Media Prima Bhd ('Media') is the largest integrated media investment group in Malaysia. Its main businesses are:

1) Television Networks, consisting of Sistem Televisyen Malaysia Berhad (“TV3”), Metropolitan TV Sdn Bhd (“8TV”), Natseven TV Sdn Bhd (“ntv7”) and Ch-9 Media Sdn Bhd (“TV9”);
2) Radio Networks comprising Synchrosound Studio Sdn Bhd (“Hotfm”) and Max-Airplay Sdn Bhd (“Flyfm”); and
3) the Outdoor Division comprising Big Tree Outdoor Sdn Bhd (“BTO”), UPD and The Right Channel Sdn Bhd (“TRC”).

In addition, it has a stake in NSTP, one of Malaysia’s largest publishing groups that publishes leading newspaper titles such as the New Straits Times, Berita Harian and Harian Metro.

Recent Financial Results

Media had recently announced its results for 2Q2009 ended 30/6/2008, where its net profit increased by 80.0% q-o-q or 22.5% y-o-y to RM30.7 million. Its turnover increased by 24.4% q-o-q or 18.8% y-o-y to RM198.5 million. The improved performance is mainly due to the full effect of the new Outdoor Division which was acquired at the end of 1Q2007, together with significantly higher revenue recorded by TV and Radio Networks, driven by strong advertising demand arising from Euro 2008 and positive domestic consumption. In addition, Media had benefited from the continued improvement in NSTP’s operational results and lower finance costs. These improvements were partially offset by a RM5.5 million charge on voluntary separation scheme (VSS) cost undertaken during the period.


Valuation

Media (closed at RM1.47 as at September 2nd) is now trading at a trailing PE of 9 times (based on last 4 quarters' EPS of 16 sen) or at a P/book of 2.2 times (based on NTA od RM0.66 per share). Being the largest integrated media investment group in Malaysia, Media would benefit from increased media spending in the current competitive economic environment. Media's current PE of 9 times is much lower than STAR's current PE of 14 times.

Technical Outlook

Media's share price has sliding since making a high of RM3.20 in June 2007. Its strong horizontal support is at RM1.40.


Chart: Media's weekly chart as at September 2nd, 2008 (source: Tradesignum.com)

Conclusion

Based on improving financial performance, attractive valuation & potentially strong technical support (at the present level), I think Media could be a good long-term investment.

Tuesday, September 02, 2008

Sime's Plantation Division's profit dropped q-o-q

Sime announced its results for 4Q2008 ended 30/6/2008. Its net profit dropped 6.3% q-o-q from RM1.09 billion to RM1.02 billion while turnover increased by 5.6% from RM8.64 billion to RM9.12 billion. Net profit has however increased by 60.5% when compared to the same quarter last year, while turnover was up 16.5% in the same periods.

The main concern was the drop in the profit recorded by the Plantation Division for the current quarter. Despite the increase in the average crude palm oil price realized of RM3,285 per tonne compared to preceding quarter of RM3,101 per tonne, this division suffered from lower production and sales volume, coupled with the higher production cost resulting from the hike in fuel price. The drop in profit in the Plantation Division was very surprising when others plantation groups (such as IOI Corp & Asiatic) had actually reported improved performance for the same calender periods from April-June.


As expected, Sime share price had rebounded from its strong support of RM6.30 (go here). Its immediate resistance is at RM7.00; RM7.70; and, RM8.00. Its support will be at RM6.30 & RM5.80.


Chart: Sime's weekly chart as at August 29th (source: Quickcharts)

Based on the poorer results recorded by Sime's Plantation Division vis-a-vis other plantation groups, Sime's share price performance is likely to lag other plantation stocks.

Ranhill bites the bullet

Ranhill announced its results for 4Q2008 ended 30/6/2008. It was quite a shocker! Ranhill reported a net loss of RM719 million on the back of a turnover of RM505 million for QE30/6/2008. The losses came from the following:

1) losses on disposal of 4 companies involved in Oil & Gas sector; and
2) losses incurred in the Melut Basin project in Sudan totaling RM556 million [consisting of amount due from the employer, Petrodar Oil Development Company (“PDOC”) of RM316 million & amount due from fellow JV partner, Petroneeds Services International (“Petroneeds”) of RM240 million].


Ranhill's management has been consistently denying the potential losses incurred in the Sudan project, which was reported in the press since 2005 (see an example here). The company has finally admitted to the losses & made the appropriate provision in its books. The disposal of the 4 Oil & Gas companies could signal an end to Ranhill's ambition to be an oil producer, as the assets sold include its 52%-stake in Bumi Parahayangan Ranhill Energia Citarum Pte Ltd (“BPREC”), which is involved in the exploration of the Citarum Block in West Java. Exploration work on this block was suspended in March this year, pending further testing as earlier tests produced "mostly formation water and significant traces of hydrocarbon gases" (go here for more).

Technically speaking, the weekly chart shows that Ranhill has broken above its medium-term downtrend line at the RM1.10 level. With this set of results, the share price could drift lower & possibly re-test its recent low of RM0.80. A break of the RM0.80 level could send the stock to the low of RM0.67-70, recorded in December 2005.


Chart: Ranhill's weekly chart as at August 29th (source: Quickcharts)

Based on its recent poor results & uncertain outlook, Ranhill is likely to 'underperform' the market for a while.