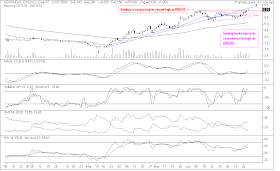
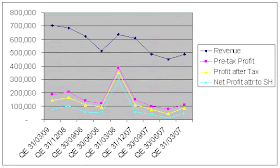
The anticipated correction in WTIC does not fit into a pattern (such as triangle, flag or pennant), nor does it trade sideway like it did in March & April. In fact, one can clearly see that a short-term downtrend has formed, with lower "highs" (H1, H2 & H3) and lower "lows" (L1 & L2). A trend once started will run its course. It has broken below the 50-day SMA (presently at USD66-67) & the immediate uptrend line (presently at USD68). The next support may come from the 100-day SMA support at USD59-60 or the horizontal line support of USD55.
Chart 1: WTIC's daily chart as at 30/7/2009 (Source: Stockcharts.com)
The recent rally (from L2 to H3) was cut short when the Energy Department announced on Wednesday that inventories surged by 5.15 million barrels in the week ended July 24. This represents the biggest weekly increase since April.
The recent correction in WTIC may also be a reaction to the rebound in USD. From Chart 2 below, we can see that USD rebounded off its strong horizontal line support of 78. The rebound in USD is likely to be short-lived as the 50-day & 100-day SMA are clearly pointing lower. Even the USD's 200-day SMA is beginning to curve downward- warning of further weakness for the greenback.
Chart 2: USD's daily chart as at 30/7/2009 (Source: Stockcharts.com)
The current weakness in the prices of crude oil- supposedly driven by weak demand- just doesn't sit well with the idea that a global economy on the mend. To set your head spinning, Clusterstock had posted these two sharply conflicting articles on July 29th- "You Fools Don't Get It: This Is A V-Shaped Recovery!" & "Trader: Get Ready For A $10-$15 Drop In Oil!" Imagine... some people thought reading charts or tea leaves is easy!!!
This is a personal weblog, reflecting my personal views and not the views of anyone or any organization, which I may be affiliated to. All information provided here, including recommendations (if any), should be treated for informational purposes only. The author should not be held liable for any informational errors, incompleteness, or delays, or for any actions taken in reliance on information contained herein.
Friday, July 31, 2009
MPI testing its downtrend line
MPI broke above its trading band of RM5.00 & RM5.70 on July 27 (see Chart 1). It is now testing the long-term downtrend line resistance at RM6.20 (see Chart 2). A break above the downtrend line could be the start of an uptrend for MPI. MPI hsa been lagging behind its rival, Unisem which rose from a low of RM0.45 on March 17 to yesterday high of RM1.75. Similarly, you can see from Chart 3 that the Philadelphia Semiconductor index, SOX has broken above its long-term downtrend line yesterday.
Chart 1: MPI's daily chart as at July 30, 2009 (Source: Quickchart)
Chart 2: MPI's weekly chart as at July 30, 2009 (Source: Quickchart)
Chart 3: SOX's daily chart as at 30/7/2009 (Source: Stockcharts.com)
In conclusion, MPI could be a trading BUY if it can break above the RM6.20 cinvincingly.
Chart 1: MPI's daily chart as at July 30, 2009 (Source: Quickchart)
Chart 2: MPI's weekly chart as at July 30, 2009 (Source: Quickchart)
Chart 3: SOX's daily chart as at 30/7/2009 (Source: Stockcharts.com)
In conclusion, MPI could be a trading BUY if it can break above the RM6.20 cinvincingly.
NSTP- light at the end of a long tunnel
NSTP has been in a downtrend for a very long time that many investors have given up on this stock. From Chart 2 below, we can see that it has dropped from a high of RM5.10 in February 2004 to a low of RM0.97 in December last year. However, NSTP's fortune may be changing...
Four days ago, NSTP broke above its 3 months' trading range of RM1.10 to RM1.35 (see Chart 1 below). Yesterday, the share has convincingly cleared its long-term downtrend line resistance at RM1.35. With this positive development, I believe that NSTP may have commenced on its long-awaited recovery. The share may encounter resistance at RM1.70, RM2.00 & RM2.50.
Chart 1: NSTP's daily chart as at July 30, 2009 (Source: Quickchart)
Chart 2: NSTP's weekly chart as at July 30, 2009 (Source: Quickchart)
As such, NSTP could be a good trading & long-term BUY.
Thursday, July 30, 2009
Market Outlook as at July 30, 2009
Our market is finally taking a break after charging upward for about 11 days from July 14 to July 28. I expect the KLCI find support at the 20-day SMA line, presently at 1124. If this support failed, the KLCI may test the horizontal line support st 1100 or the 50-day SMA line (presently at 1083) or the medium-term uptrend line (presently at 1090).
Chart 1: KLCI's daily chart as at July 29, 2009 (Source: Quickchart)
While watching our market, we must also keep an eye on DJIA. Interestingly, DJIA appears to be forming an expanding triangle or one half of a diamond formation. See the chart below.
Chart 2: DJIA's daily chart as at 29/7/2009 (Source: Stockcharts.com)
An expanding triangle is the reverse of a normal triangle where two lines converge towards a point ahead, called the apex. In the case of an expanding triangle, the two lines diverge away from each other. The psychology of the players in a market trapped in a normal triangle is one where the bulls & the bears slowly moved towards an agreement on the price while in the case of an expanding triangle, the players' price perception is drawing far & far apart. Here, the bulls are getting more bullish and the bears are getting more bearish. Like a normal triangle, a breakout to the upside of an expanding triangle will be bullish for the market, or vice versa. For a bearish look of a expanding triangle, go here.
Alternatively, what we are seeing in DJIA is the left-hand half of a diamond formation, with the right-hand half still absent. While the left-hand half looks like an expanding triangle, the right-hand half will look like a normal triangle. When we finally see the shape of a diamond formation, we will await a breakout either to the upside or the downside. There is a tendency for diamond formations to be formed at the market top. For now, we shall adopt a neutral stance & await the pattern being formed & its subsequent resolution. For a bearish look of a diamond top, go here.
HPI announced good results & a 1-for-4 Bonus Issue
Background & Recent Announcement
Today will have a good day for HPI. Firstly, HPI has also announced a 1-for-4 Bonus Issue. Secondly, it announced a good set of results for 4Q2009 ended 31/5/2009 which shows a big jump in net profit of 13.1% q-o-q or 24.5% y-o-y to RM5.0 million. Turnover at RM89 million is lower than the immediate preceding quarter by 9.4% but was 20.0% higher than previous corresponding quarter. The y-o-y increase in net profit is due to "the contribution of subsidiary at Perak which has resumed to normal production activity after the fire outbreak in Sept’ 2007 and the paper mill company which acquired in Aug’ 2008", while the q-o-q improvement is due to "the favorable material price, effective cost cutting measures and improvement in production efficiency and productivity". HPI has also benefited from lower effective tax charges due to certain subsidiaries having brought forward "unabsorbed capital allowances and claims of reinvestment allowances".
Table: HPI's last 8 quarterly results
Chart 1: HPI's 18 quarterly results
Valuation
HPI (closed at RM0.96 yesterday) is now trading at a trailing PE of 2.2 times! That's as cheap as it can get in the stock market. However, HPI's cheap valuation has been noted before (here).
Technical Outlook
In the past 8 years, HPI has been trading in a band between RM0.60 & RM1.50 (see Chart 2). It is also in a medium-term downtrend line, with resistance at RM1.18 (see Chart 3). As at 10.45am, HPI was trading at RM1.21- indicating a possible breakout of the medium-term downtrend line. If the breakout can sustain, there is a possibility that HPI may test the RM1.50 upper trading band.
Chart 2: HPI's monthly chart as at July 29, 2009 (Source: Quickchart)
Chart 3: HPI's weekly chart as at July 29, 2009 (Source: Quickchart)
Conclusion
Based on cheap valuation, improving financial performance & possible technical bullish breakout, HPI could be a good trading & long-term BUY.
Wednesday, July 29, 2009
Carlsberg could be a trading BUY
Background
Carlsberg Brewery Malaysia Bhd ('CBMB') announced that it had entered into a Memorandum of Understanding (“MOU”) with Carlsberg Breweries A/S (“Carlsberg”), the holding company of CBMB, to acquire the entire equity interest in Carlsberg Singapore Pte Ltd (“Carlsberg Singapore”) from Carlsberg Asia Pte Ltd (“CAPL”), a wholly-owned subsidiary of Carlsberg at the consideration of RM370 million in cash subject to final evaluation. The deal is expected to be completed by November 1, 2009. Other pertinent details are:
1) Carlsberg shall provide CBMB a guarantee for Carlsberg Singapore’s average annual profit after tax For FY2009 & FY2010.
2) The deal should be earnings accretive since it is a cash deal, with the bulk of the cash settlement coming from CBMB's cash reserves (of RM231 million as at 31/3/2009) and the balance from bank borrowings.
Recent Financial Results
The last 4 quarters' net profit was lower than the preceding 4 quarters' net profit due to lower contribution from contract manufacturing for the Singapore market, higher raw material price, strengthening of the US Dollar as well as exceptional gain from sale of residential in 2007 of RM5.2 million.
Valuation
CBMB (closed at RM4.26 today) is now trading at a trailing PE of 18 times (based on last 4 quarters' EPS of 23 sen). This does not include any contribution from Carlsberg Singapore since no details of the latter's performance is given.
Technical Outlook
From Chart 1 below, we can see that CBMB has broken above its medium-term downtrend line at RM3.50 in March. A short-term uptrend- with higher 'lows' and higher 'highs'- can clearly be sen. We can see that CBMB has just broken above its rising wedge at RM4.00 today (see Chart 2). The next resistance is at RM4.50 & thereafter RM5.00.
Chart 1: CBMB's weekly chart as at July 29, 2009 (Source: Quickchart)
Chart 2: CBMB's daily chart as at July 29, 2009 (Source: Quickchart)
Conclusion
For now, CBMB could be a good trading BUY based on technical consideration.
Tuesday, July 28, 2009
Kossan- a good long-term BUY
Kossan came under fierce selling pressure over the past one week, with the share price dropping from RM4.00 to a low of RM3.50 yesterday. Kossan nearly tested its medium-term uptrend line support at RM3.46. Today, we can see some buying support for the stock and this has lifted the share price to RM3.62 presently. At the current level, I believe that Kossan is a good buy.
Chart 1: Kossan's daily chart as at July 27, 2009_11.30am (Source: Quickchart)
Kossan's recent selldown was attributable to analysts’ reports that it may incur an estimated forex loss of RM8-9 million in 2Q2009 ended June 30, 2009, after having written off RM12 million in similar losses in 1QFY09. According to a report in the Edge, the forex losses "spilled over from last year when Kossan hedged its receivables at an average contract of RM3.37 to the US dollar in anticipation of further weaknesses in the US currency. Instead, the dollar strengthened against the ringgit."
I think investors over-reacted when they heard about forex losses & associated them with losses from derivative or structured instruments which brought about the recent Global Financial Crisis. The decision by Kossan to hedge its USD receivable against further slide in the USD may not be a bad business decision. Unfortunately, the USD rebounded instead of going lower. However, if you look at the chart of USD-RM below, you can see that USD is expected to weaken against the Ringgit as the 100-day SMA has cut below the 200-day SMA and the MACD indicator has also hooked down. The critical support is at the neckline of the Head-&-Shoulders formation of 3.48. A break below the neckline may send USD to RM3.30 or even RM3.20. Burdened by ballooning budget deficit & external debts, the USD is expected to hobble, not rally like it did in 4th quarter 2008 or 1st quarter 2009. So, I think the worst is behind Kossan as far as the USD hedge is concerned.
Chart 2: USD-RM's daily chart as at 27/7/2009 (Source: Yahoo Finance)
Based on the above, I believe Kossan could be a good long-term BUY at the present level.
Bursa has a bullish breakout
Bursa broke above the triangle formation at RM7.40 on July 24 as well as closing above its recent high of RM7.50 on that day (see Chart 1). With this breakout, Bursa is likely to test its next resistance at RM8.00-8.40 soon (see Chart 2). Bursa may test the psychological level of RM10.00 as the current market rally gathered momentum.
Kenanga has maintained its BUY call on Bursa with an upward revision in the FY2010 net profit of 26% to RM163 million (or, EPS of 30.96 sen). The revision was made based on Bursa's proposal to remove the current cap on clearing fee charges for institutional trades. This proposal, if implemented, could lead to a 15-20% increase in turnover.
Chart 1: Bursa's daily chart as at July 27, 2009_11.45am (Source: Quickchart)
Chart 2: Bursa's weekly chart as at July 27, 2009_11.45am (Source: Quickchart)
Based on technical consideration, Bursa is a good trading BUY now.
Thursday, July 23, 2009
Genting's uptrend to continue
Genting broke above its symmetrical triangle at RM5.80 on July 20. With this breakout, Genting is likely to continue with its prior uptrend. The immediate resistance is its recent high of RM6.10, which is also a strong horizontal line resistance. It managed to surpass the RM6.10 resistance to close at RM6.15 at the end of the morning session.
Chart 1: Genting's daily chart as at July 23, 2009_11.45am (Source: Quickchart)
From the weekly chart, you can see that Genting's next resistance is at RM6.80-7.00 (ignoring the panic selling lows of RM6.25 & RM6.40). Immediate support will come from the psychological level of RM6.00 & later on from the horizontal line of RM5.20.
Chart 2: Genting's weekly chart as at July 22, 2009 (Source: Quickchart)
In conclusion, Genting could be a trading BUY if it can stay above RM6.10 today. The volume accompanying this morning session's breakout is quite encouraging at 55000 lots.
Parkson- a trading BUY
Parkson has risen nicely since bottoming out in March. For QE31/3/2009 (announced in May), its turnover increased by 2.7% q-o-q or 10.8% y-o-y to RM703 million. Net profit dropped by 27.1% q-o-q or 74.3% y-o-y to RM75.9 million. The main reason for the drop is because of the following:
1) A one-off gain of RM231.6 million arising from the placement of 1.44% Parkson Retail shares in QE31/3/2008; and
2) A one-off gain of RM32.5 million arising from dilution of interests in Nanning Parkson and Tianjin Parkson in QE31/12/2008.
Over the past 4 quarters, we can see that Parkson's turnover has been rising steadily since making a low of RM514.6 million in QE30/6/2008 (due to the absence of major festivities). In addition, its operating profit margin has improved over the same period from 25.7% (QE30/6/2008) to 24.8% (QE30/9/2008) to 27.7% (QE31/12/2008) to 28.9% (QE31/3/2009). I expect a small drop in Parkson's turnover for QE30/6/2009 sue to the absence of major festivities, but offset by increased consumer spending (resulting from improved sentiment).
Chart 1: Parkson's last 8 quarterly results
In term of valuation, Parkson (closed at RM5.60 at the end of the morning session) is not cheap as it trades at a trailing PE of 19.6 times (based on last 4 quarters' EPS totaling 28.5 sen). I am revisiting this stock after my BUY call in March because the stock has broken above an ascending triangle, with breakout at RM5.20. Its next resistance levels are at RM6.20 & RM7.00, while the support levels are at RM5.20 & RM4.80.
Chart 2: Parkson's daily chart as at July 23, 2009_12.30noon (Source: Quickchart)
Chart 3: Parkson's weekly chart as at July 22, 2009 (Source: Quickchart)
Based on the above, Parkson could be a good trading BUY.
Wednesday, July 22, 2009
Market Outlook as at July 22, 2009
If you looked through the global stock markets, you can divide up the markets into two groups- the sprinting tortoises & the galloping hares. The way these markets has rallied in the past 7 days (since July 13), they all look quite alike.
The first group-- the sprinting tortoises-- consists of Asian stock markets (excluding the Japanese market), while the other group-- the galloping hares-- is made up of US, European, Australian & Japanese market. You may notice the following:
1. The 200-day SMA lines for the Asian markets (ex-Japan) are nearly flattening out, while the other markets' 200-day SMA lines are still dropping.
2. The recent correction brought the Asian Market indices to their 50-day SMA lines, while the other markets went as low as the 100-day SMA lines.
These two differences may explain the inherent strength & resilience of Asian markets (ex-Japan).
Nearly all the above markets are now at their June high, with a few markets (Singapore, Hong Kong, Korea & Malaysia) surpassing their June high. While I believe that the markets may correct at this level, they have proven me wrong. Nevertheless, the sharp price run-up in many blue chips will eventually be followed by some correction. I feel that some profit-taking at the present level may not be a bad idea.
Chart 1: HSI & STI's daily chart as at 21/7/2009 (Source: Stockcharts.com)
Chart 2: TWII & KOSPI's daily chart as at 21/7/2009 (Source: Stockcharts.com)
Chart 3: AORD & N225's daily chart as at 21/7/2009 (Source: Stockcharts.com)
Chart 4: FTSE & S&P500's daily chart as at 21/7/2009 (Source: Stockcharts.com)
Chart 5: DAX & CAC's daily chart as at 21/7/2009 (Source: Stockcharts.com)
PS- Our KLCI has surpassed the strong horizontal resistance of 1140 this morning. In the afternoon, it tested the next strong horizontal resistance of 1160 but failed to overcome it. I believe it is likely to enter into some correction, with the 1140 level as its immediate support.
Century has broken above its downtrend line
Century Logistic's financial performance may be bottoming out in QE31/3/2009. From the Table below, we can see that the company made a pre-tax profit of about RM1.0-1.3 million in past 2 quarters (QE31/3/2009 & QE31/12/2008).
Table: Century Logistic's 8 quarterly results
While its top-line has been quite erratic in the past 6 quarters, its bottom-line shows a clear sign of having peaked in QE31/3/2008 & thereafter it has been sliding lower. Up to QE31/3/2009, there is still no sign of recovery. However, given the recovery in the global trade, I believe that Century Logistic is likely to post an improved performance in QE30/6/2009.
Chart 1: Century Logistic's last 12 quarterly results
From the chart below, we can see that investors are prepared to bet on a recovery in Century Logistic. The stock broke above its medium-term downtrend line at RM1.15 on July 15. It has also broken above the horizontal line resistance at RM1.20 on July 20. The stock gained 11 sen to close at RM1.39 this morning. Its next resistance is at RM1.60.
Chart 2: Century Logistic's weekly chart as at July 21, 2009_10.30am (Source: Quickchart)
Century Logistic could be a good trading BUY, with the ideal entry price at RM1.20. In this environment, we cannot expect to see that price anytime soon. So, you may have to raise the entry level to RM1.30.
Tuesday, July 21, 2009
Recovery in second half 2009 predicted
The US Conference Board Leading Economic Index ('LEI') is predicting recovery in the US in the second half of 2009 (here). LEI is an American economic index intended to forecast future economic activity. It is calculated by The Conference Board, a non-governmental organization, which determines the value of the index from the values of ten key variables. These variables have historically turned downward before a recession and upward before an expansion. The single index value composed from these ten variables has generally proved capable of predicting recessions over the past 50 years. This index correctly forecast each of the eight recessions during the 1959-2009 period, but it has also forecast recessions that did not occur.
IMF has earlier revised its forecast for global economic growth in 2010 to 2.5% from its earlier estimate of 1.9%, with the increase expected to be led by India and China. Nevertheless, IMF still expects the global economy to contract by 1.4% this year. For more, go here.
HLBank poised to breakout?
HLBank is a well-managed profitable bank that has somehow been sidetracked by analysts & fund managers. From the table & Chart 1 below, we can see that its financial performance is quite respectable. There were 2 quarters where its results took a dive:-
1) In QE31/3/2009, its pre-tax profit dropped by 21% q-o-q or 3% y-o-y due to lower net interest income of RM20 million as a result of 2 downward revision in OPR and lower non-interest income of RM16 million due to lower forex profit & other fee income.
2) In QE30/6/2008, its pre-tax profit dropped by 33% q-o-q or 24% y-o-y to RM184 million due to increased specific provision & lower recoveries.
Other than the above 2 quarters, HLBank's performance has been fairly satisfactory. From Chart 1, we can see that HLBank's top=line & bottom-line are in a steady uptrend.
Table: HLBank's 8 quarterly results
Chart 1: HLBank's last 14 quarterly results
HLBank (closed at RM5.90 yesterday) is now trading at a trailing PE of 10.2 times (based on last 4 quarterly EPS of 58 sen). This compared favorably to Public Bank which is trading at a trailing PE of 14.7 times (yesterday's price of RM10.30 & annualized EPS of 70 sen) or Commerce which trades at a trailing PE of 14.6 times (yesterday's price of RM10.10 & annualized EPS of 69 sen). If we valued HLBank at a 10%-discount to Public Bank & Commerce's PE multiple, then HLBank's fair value could be RM7.50.
From the weekly chart, HLBank appears to have broken above the downtrend line that stretches back to early 2007. It is presently testing the strong horizontal resistance at RM5.90-6.00. A convincing break above the RM6.00 level could be the start of a rally for HLBank.
Chart 2: HLBank's weekly chart as at July 20, 2009_10.30am (Source: Quickchart)
Chart 3: HLBank's monthly chart as at July 20, 2009_10.30am (Source: Quickchart)
Based on satisfactory performance, attractive valuation & nice technical set-up, HLBank could be a good BUY for medium-term. It could even be a trading BUY if the share price surpassed the RM6.00 level convincingly.
PS- My previous calls on HLBank have not been on target (here & here).
Monday, July 20, 2009
WTIC found support at USD60
WTIC has rebounded off its horizontal line support of USD60 last week. However, it is likely to trade in the USD60-70 band for a while (say, for the next 2 weeks) before rising further. One can see that the 20-day SMA will be cutting below the 50-day SMA soon- a mildly negative development. Nevertheless, WTIC is still trading above its rising 100-day SMA and with that I believe the uptrend is still intact. A break above the recent high of USD74 will signal the continuation of the prior uptrend.
Chart: WTIC's daily chart as at 17/7/2009 (Source: Stockcharts.com)
Maybank may see further upside
BJToto may be a good medium-term BUY
BJToto announced its results for 4Q2009 in mid-June. It net profit increased by 10.4% q-o-q or 76.5% y-o-y to RM107.2 million, while its turnover dropped 17.7$ q-o-q but up marginally compared to 4Q2008. The net profit has improved due to lower prize payout. Turnover declined q-o-q due to 6 extra draws in 3Q2009 as compared to 4Q2009.
Table: BJToto's 8 quarterly results up to April 30, 2009
Chart 1: BJToto's top-line & bottom-line for the past 8 quarters
BJToto (closed at RM4.36 on last Friday) is now trading at a trailing PE of 13 times (cased on last 4 quarters' EPS of 32.7 sen). Excluding dividend in specie, BJToto's dividend payout averages about 25 sen per annum for the past 2 years. This gives BJToto a dividend yield of 5.7%.
Despite breaking below its long-term uptrend line in August 2008 (as noted here), BJToto only dropped slightly to a low of RM4.04 in October 2008. Thereafter, it rallied to a high of RM5.35 in June. The share price has recently adjusted for the generous dividend of 30 sen plus dividend-in-specie of 1 Treasury share for every 14 shares owned. The combined dividend should carry a value of about RM0.63 per share and BJToto share price was adjusted lower accordingly to RM4.32.
The share has been hanging around the RM4.30 level for the past 5 days. I believe the share price is not likely to go lower as this is the tentative uptrend line support as well as the horizontal line support. In the current environment of strong buying for blue chips or near-blue chips, BJToto will eventually be snapped up again. Potential medium-term target is RM4.90-5.00.
Chart 2: BJToto's weekly chart as at July 20, 2009_10.30am (Source: Quickchart)
Based on good technical support & attractive valuation, I believe BJToto is a good BUY for medium-term investing.
Friday, July 17, 2009
Tenaga may be breaking above its downtrend line
Tenaga may be breaking above its medium-term downtrend line (SS) where the resistance is at RM8.00. It is presently trading at RM8.15, which happened to be the high recorded in May. Volume is however lacking at about 37k board lots done up to 12.25 noon. If the breakout gained momentum, we may see Tenaga testing its next horizontal line resistance at RM8.50 & thereafter RM9.00.
Chart: Tenaga's weekly chart as at July 17, 2009_12.20noon (Source: Quickchart)
Thursday, July 16, 2009
CPO prices set to recover
Yesterday, the Parabolic SAR (SAR stands for 'stop-and-reversal' indicator) has moved below the CPO price. This positive sign could signal the start of a recovery in CPO prices. This should be positive for Plantation stocks. I do not foresee any strong rally there as these stocks have hardly corrected in the past few weeks.
Chart: CPO's daily chart as at July 16, 2009_12.30noon (Source: ifs.marketcenter.com)
Market Outlook as at July 16, 2009
The KLCI followed through with its yesterday breakout above its short-term downtrend line with a break above its recent high of 1096 and the psychological level of 1100 this morning. The KLCI is likely to continue with its prior uptrend, with strong resistance at 1140-1160. While this resistance level looks very near, I think the market will have a tough time cracking it. If we can do so, then the KLCI's next strong resistance would be 1285-1300. The latter looks unattainable at this stage but I have fit it in as the third & final target for this bull rally. This is because a bull rally normally has 3 impulsive waves & 2 corrective waves, according to the Elliot Wave theory.
Chart: KLCI's weekly chart as at July 16, 2009_11.30am (Source: Quickchart)
The above represents my preferred scenario for the KLCI. Despite having a cautiously optimistic stance, I am not totally unmoved by the recent bout of negative news flow. I have shared this with the readers earlier. For the purpose of completeness, I would also like to share my fear for the market. My negative scenario is that the market has turned up so abruptly due to a sudden surge of buying. What motivated this strong buying? Could it be better financial results from the 2nd quarter? I am not sure. Whatever it may be, this buying has overturned the bearish outlook of the market. The most recent instance of a sudden change in a market that appeared to be heading towards a correction was in the 4th quarter of 2007. I have highlighted that leg of the rally in pink (denoted as 'A'). You can see that the MACD & Williams %R were poised to go lower or to give a negative signal (which did not come). The KLCI suddenly zoomed up to make an all-time high of 1524. The sharp run-up was followed by a sharp correction. I am not suggesting a repeat of this scenario currently, but merely to point out that a sudden strong rally has its danger. There could be good reasons or grounds for this rally, but at this moment most of us are more than a bit puzzled. If sharp correction happened, the KLCI can expect good support at the psychological 1100 level as well as the horizontal line support of 1090-95.
Measat may have broken above its medium-term downtrend line
Measat has just broken above its medium-term downtrend line resistance at RM2.18-20. It has also surpassed its recent high of RM2.24 recorded on June 10. Its next resistance is at RM2.50 & thereafter RM3.00.
As at this moment, I do not know the reason for the play on Measat. However, you may want to check out my take on its recent financial results (here).
Chart: Measat's daily chart as at July 16, 2009_11.45am (Source: Quickchart)
As at this moment, I do not know the reason for the play on Measat. However, you may want to check out my take on its recent financial results (here).
Chart: Measat's daily chart as at July 16, 2009_11.45am (Source: Quickchart)
US & European markets broke above their short-term downtrend line
When the global stock markets turned on a dime & rose sharply, we stood aghast and looked frantically for an explanation. Frankly speaking, I do not know what has changed to justify such a strong reaction from the markets. All the major US & European markets have turned up sharply & broke above their short-term downtrend line (the pink lines denoted below as 'A'). With the momentum on its side, the bull may still charge for a few more days before taking a break.
Chart 1: S&P500 & DJIA's daily chart as at July 15, 2009 (Source: Stockcharts.com)
Chart 2: Nasdaq & DAX's daily chart as at July 15, 2009 (Source: Stockcharts.com)
Chart 3: FTSE & CAC40's daily chart as at July 15, 2009 (Source: Stockcharts.com)
Chart 1: S&P500 & DJIA's daily chart as at July 15, 2009 (Source: Stockcharts.com)
Chart 2: Nasdaq & DAX's daily chart as at July 15, 2009 (Source: Stockcharts.com)
Chart 3: FTSE & CAC40's daily chart as at July 15, 2009 (Source: Stockcharts.com)