Tuesday, March 30, 2010

Analabs- a good long term investment

Background

Analabs Resources Berhad ('Analabs') is an investment holding company, which is involved mainly in the recovery and sale of recycled products primarily in Malaysia and Singapore. In July last year, Analabs acquired 100% equity interest in Coveright Surfaces Malaysia Sdn Bhd ('Coveright Surfaces') for a cash consideration of RM40.0 million. Coveright Surfaces is involved in the manufacturing and sale of resin impregnated papers.

Recent Financial Results

Analabs has just announced its results for 2Q2010 ended 31/1/2010. Its net profit increased by 48% q-o-q or 152% y-o-y to RM5.6 million while turnover increased by 40% q-o-q or 214% y-o-y to RM38 million. The huge jump in turnover & profitability is attributable to the great acquisition of Coveright Surfaces, which in 2 quarters contributed operating profit of RM8.5 million & turnover of RM44.6 million. For full year, we can expect Coveright Surfaces to generate an operating profit of RM17 million or after-tax profit of RM12.75 million (based on tax rate of 25%).


Table: Analabs's last 8 quarterly results


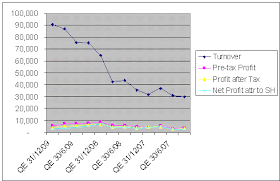
Chart 1: Analabs's last 10 quarterly results

Valuation

Analabs (closed at RM1.39 in the morning session) is now trading at a PER of 4.4 times (based on annualized EPS of 31.9 sen which is derived from the 1st two quarters' results). At this multiple, Analabs is deemed fairly attractive.

Technical Outlook

From Chart 2 below, we can see that Analabs is in an uptrend line with support at RM1.10. Today, Analabs surged past its overhead resistance at RM1.28. The next resistance is at RM1.60.


Chart 2: Analabs' daily chart as at March 30, 2010_3.10pm (Source: Tradesignum)

From Chart 3 below, we can see that Analabs has broken above the 'horizontal' line resistance (RR) at RM1.30. Its next resistance is at RM1.60


Chart 3: Analabs' weekly chart as at March 30, 2010_3.10pm (Source: Tradesignum)

Conclusion

Based on better financial results ahead & attractive valuation, Analabs coudl be a good stock for long-term investment.

Monday, March 29, 2010

USD- another factor in the equation

The USD weakened sharply against the RM today- dropping 1.13% to 3.268. In the process, the USD-RM broke below the support of the expanding triangle at 3.28. It may have some support at the horizontal line 3.27, See Chart 1 below.


Chart 1: USD-RM's daily chart as at March 29, 2010 (Source: Yahoo Finance)

The strengthening of RM could be negative for exporters who price their products in USD, while benefiting importers who will pay less for the same products imported. This may account for the drop in the share price of rubber glove makers as well as a sharp rise in the share price of automotive stocks.

From Chart 2 below, we can see that the correction in our FBM-KLCI in June-July last year & January-February this year coincided with a counter-trend move in the USD-RM. In view of this, we need to watch out for a possible sharp rebound in the USD-RM, which may trigger a correction in our market. After all, we have noted in earlier posts that the underlying trend for USD is up, with the exception of some Asian currencies (such as our RM).


Chart 2: USD-RM & FBM-KLCI's daily chart as at March 29, 2010 (Source: Yahoo Finance & Quickcharts)

Proton may be a good trading BUY

Proton has just surpassed the horizontal resistance & its recent high of RM4.60-62 (see Chart 1). This is also the medium-term downtrend line (see Chart 2). With this breakout, Proton may test its next resistance at RM5.00 & thereafter at RM6.00.


Chart 1: Proton's daily chart as at Mar 29, 2010_12.30pm (Source: Quickcharts)


Chart 2: Proton's weekly chart as at Mar 29, 2010_12.30pm (Source: Quickcharts)

Based on the technical reading, I believe Proton could be a good trading BUY.

WTK may be commencing on its uptrend

WTK, a timber stock, may have broken above its flag formation at RM1.26 on good volume this morning. See Chart 1 below.


Chart 1: WTK's daily chart as at Mar 29, 2010_9.10am (Source: Quickcharts)

We can see from Chart 2 below that WTK broke above its downtrend line in early 2009 but that breakout was followed by sideway trading between RM1.00 & RM1.26 for the past 9 months. The current breakout could signal the uptrend for this stock.


Chart 2: WTK's weekly chart as at Mar 29, 2010_9.15am (Source: Quickcharts)

Based on this bullish technical breakout, WTK could be a good trading BUY or for long-term investment.

Thursday, March 25, 2010

MPHB's secular uptrend may have started

MPHB has just broken above its strong horizontal resistance at RM2.00. In July last year, MPHB broke above its long-term downtrend line at RM1.90 & thereafter traded sideway for 8-9 months. The present breakout above RM2.00 could signal the start of a secular uptrend for MPHB. Its next resistance levels are RM2.25, RM2.70 & RM3.00.


Chart: MPHB's monthly chart as at Mar 1, 2010 (Source: Tradesignum)

Based on the above technical breakout, MOHB could be a good trading BUY.

Media could be a good trading BUY

Media has just broken above its strong horizontal resistance at RM2.00. It s next strong resistance is at RM2.40. Based on this technical breakout, Media could be a good trading BUY.


Chart: Media's weekly chart as at Mar 22, 2010 (Source: Tradesignum)

JTIasa broke above a cup-with-handle formation

Background

Jaya Tiasa Holdings Berhad ('JTiasa'), an investment holding company, engages in the extraction & sale of logs. It holds interests in 1.76 million acres of timber concessions in the state of Sarawak. It also manufactures & sells sawn timber, plywood, veneer, block board & laminated wood. In addition, it involves in the development of oil palm plantations & its related activities; develops & maintains planted forests plus; and undertakes forest plantation contracts.

Recent Financial results

It has just announced its results for 3Q2010 ended 31/1/2010. Its net profit increased by 323% q-o-q or almost 90-fold y-o-y to RM13.7 million, while its turnover increased by 16.2% q-o-q or 24.2% y-o-y to RM210 million. The q-o-q improvement was attributable to higher sales volume for logs & plywood as well as better margin for plywood, while the y-o-y improvement was due to the same reasons plus higher sales volume & better prices of FFB produced. These improvements had helped to push up JTiasa's top-line & bottom-line in the last 2 quarters (see Chart 1).


Table: JTiasa's last 8 quarterly results


Chart 1: JTiasa's last 14 quarterly results

Movement in Prices of Logs & Timber Products

We can see that the prices of logs & timber products have stabilized but have yet to recover.


Chart 2: Movement in the Prices of Logs & Timber Products (Source: ITTO)

Valuation

JTiasa (closed at RM3.28 yesterday) is now trading at a PER of 16 times (based on annualized EPS of 20.4 sen). At this multiple, JTiasa is fully valued unless there is further increase in the prices of logs & timber products (mainly, plywood) & FFB.

Technical Outlook

JTiasa has broken above its downtrend line in May last year. Since then, the stock has been tracing out a cup-with-handle formation. It has broken above the cup-with-handle continuation pattern at RM2.90 on Mar 4. See Chart 3.


Chart 2: JTiasa's daily chart as at Mar 23, 2010 (Source: Tradesignum)

From Chart 4, we can see that the 10-month SMA line has cut above the 20-month SMA line. The 10-month SMA line is poised to cut above the 30-month SMA line soon. The last time we saw a similar SMA crossover was in the second half of 2006 when the share rose from RM3.00 to RM6.00 over a period of 6 months. I think a similar upside move is only possible if the prices of logs & timber products rallied.


Chart 4: JTiasa's monthly chart as at Mar 1, 2010 (Source: Tradesignum)

Conclusion

Based on technical consideration, JTiasa could be a good stock for trading BUY. Due to the absence of a strong recovery in the prices of timber products & logs, JTiasa's financial performance would be lagging and unable to provide the boost in term of justifying the higher PER of the stock.

Wednesday, March 24, 2010

JTiasa's Explanatory Notes really explain clearly...

Reading the notes to the accounts has always be a challenging task. To find out why the performance has changed on a y-o-y basis or q-o-q basis would require many reading & toggling between the different documents. Today, I have come across a notes to the accounts that should be a model for others to follow. Below is the Explanatory Notes to JTiasa's accounts for QE31/1/2010 which give the reasons for the changes in its financial performance, in clear & concise manner. Let's hope other companies will follow suit & make life easier for analysts & investors who relay on these reports for their decision-making.

JCY- a stock to watch

The market saw strong rally among the rubber glove manufacturers, semi-conductor assemblers & hard-drive component producers. A few stocks surpassed their recent high & charged higher, such as Topglove, Supermx, Unisem, Gtronic & Eng. Others broke above their short-term downtrend line & rallied, such as Lityan & Penta. The play on technology stocks has even ignited interests in Time.com, which broke above its strong horizontal resistance at RM0.45-46. Its next resistance is at RM0.55-56. See Chart 1 below.


Chart 1: Time.com's weekly chart as at Mar 24, 2010 (Source: Quickcharts)

The stock that we should be watching is JCY, the newly-listed giant hard-drive component manufacturer. This stock broke above its horizontal resistance at RM1.64-65 today. It gained 8 sen to close at RM1.68. I believe JCY will participate in the on-going play among technology stocks.


Chart 2: JCY's 30-min chart as at Mar 24, 2010 (Source: Quickcharts)

Tuesday, March 23, 2010

The unwelcome return of the Dollar

USD Index looks poised for an upside move. Its 20-week SMA line has just crossed above the 40-week SMA line. The last time we saw a similar crossover was in September 2008 when the USD Index rallied from 76 to 88 in a matter of 2 months. That was extraordinary time, with the collapse of Lehman, etc. Can a similar sharp rally in USD recur? I must admit that it does not look like a likely scenario but we can never tell. From Chart 1, we can see that the ADX is drifting lower & the +DMI is pointing down. These may indicate an milder upside move for the USD Index.


Chart 1: USD's weekly chart as at Mar 22, 2010 (Source: Stockcharts.com)

From Chart 2 & 3 below, we can see that a rally in USD Index in September 2008 coincided with a sharp drop in the MSCI World (ex-USA) Index & the NYSE International 100 Index. This round, both indices dropped sharply in January but they managed to rebound in February & March. Would they weaken again in the face of further strengthening of the USD?


Chart 2: MSCI World (ex-USA) Index & USD's weekly chart as at Mar 22, 2010 (Source: Stockcharts.com)


Chart 3: NYSE International 100 Index & USD's weekly chart as at Mar 22, 2010 (Source: Yahoo Finance & Stockcharts.com)

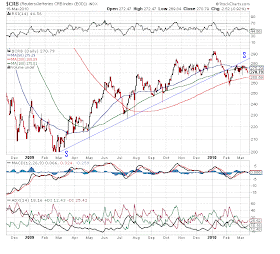
Finally, we can see that a rally in USD index in September 2008 coincided with a sharp drop in CRB Index. The timid rebound in CRB Index in February & March this year (after a sharp fall in January) seems to suggest that commodities in general are likely to ease off if USD were to strengthen further.


Chart 4: CRB & USD's weekly chart as at Mar 22, 2010 (Source: Stockcharts.com)

In view of the bullish moving average crossover in the USD Index, we must be prepared for a possible downside move in equity & commodities, globally & in Malaysia. As such, we need to exercise greater caution in our trading & investment decision.

Note:

(1) The MSCI World is a stock market index of 1500 'world' stocks. It is maintained by MSCI Inc., formerly Morgan Stanley Capital International, and is often used as a common benchmark for 'world' or 'global' stock funds.

(2) The NYSE International 100 Index tracks the largest 100 non-U.S. common stocks listed on the New York Stock Exchange.

(3) The Thomson Reuters/Jefferies CRB Index (CRB) is a commodity price index which composed of 28 commodities. It was first calculated by Commodity Research Bureau, Inc. in 1957 and made its inaugural appearance in the 1958 CRB Commodity Year Book.

Measat- shooting for the stars?

A reader (Kenny) asked for my comment on Measat on March 17 (see the post). This was my reply on the same day:
Measat has broken above its medium-term downtrend line at about RM2.20-25 this morning. I saw the upside breakout but I did not post on it because Measat seems to rally every time Astro was suspended. After the false upside move, the stock would enter into a correction. Hopefully, this time it is really different. Its overhead resistance is at the psychological RM2.50 and thereafter at RM2.60-65 & then at RM2.90-95.

After the announcement of the Astro privatization, one would think that investors would give up on the idea of a Measat privatization coming so close on the heel of the Astro announcement. Apparently not. The more Measat share price rises, the more appealing the idea of a privatization becomes. Skeptics (you may count me as one) are now in hiding. This is a party for the believers!!!

Technically speaking, Measat has broken above the strong horizontal resistance at RM3.00. The next resistance is near the RM4.00 level. See the two charts below. Chart 1 is plotted on arithmetic/linear scale while Chart 2 is plotted on logarithmic scale. Chart 2 gives a better fit on the downtrend line breakout.


Chart 1: Measat's weekly chart (on linear scale) as at Mar 22, 2010 (Source: Tradesignum)


Chart 2: Measat's weekly chart (on logarithmic scale) as at Mar 22, 2010 (Source: Tradesignum)

The big question is whether one should get onto this train. That's a million dollar question which I can't answer for you. You have to ask yourself: Should I believe my eyes or should I rely on my head? If you choose to go in, go in with your eyes wide open. Set your protective stop!

Note: Measat is a communications satellite operator. For FYE31/12/2009, it reported a pre-tax profit of RM53.2 million on the back of a turnover of RM242 million. This was a turnaround from a pre-tax loss of RM37.4 million on a turnover of RM196 million achieved in the previous year.

KSeng surpassed the all-time high!

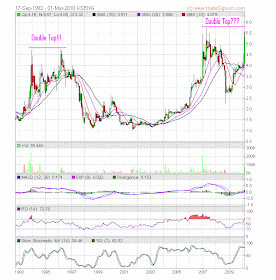
In the morning session, KSeng has broken above its all-time high of RM5.70 which was achieved in early 2007 (see Chart 2 below). This followed yesterday's breakout above its recent high of RM5.56-57 recorded on March 15 (see Chart 1 below). The upside breakout above the all-time high of RM5.70 means that the feared double top reversal anticipated in the earlier post did not materialize. In technical analysis, a break above the all-time high is a very bullish signal and one may consider KSeng as a trading BUY.


Chart 1: KSeng's daily chart as at Mar 23, 2010_12.30noon (Source: Quickcharts)


Chart 2: KSeng's monthly chart as at Mar 1, 2010 (Source: Tradesignum)

Monday, March 22, 2010

TienWah may have broken above a strong horizontal resistance

Technical Breakout noted

TienWah may have broken above its strong horizontal resistance at RM2.00-2.05.


Chart 1: TienWah's monthly chart as at Mar 1, 2010 (Source: Tradesignum)

Recent Financial Results

For FYE31/12/2009, TienWah's net profit declined by 17.4% from RM18.7 million to RM15.5 million. Turnover had however increased by 77% from RM186 million to RM329 million. The decline in net profit was due to the negative impact of a surge in volume of new products from a major customer resulting in the need to outsource a number of jobs. This problem is expected to be alleviated in FY2010 with the purchase of an additional printing press.


Table: TienWah's last 8 quarterly results


Chart 2: TienWah's last 12 quarterly results

Conclusion

TienWah should have benefited handsomely from the strong growth in the top-line in the past 8 quarters, if it has sufficient production capacity. This problem should be alleviated in FY2010, which should result in better bottom-line. Investors maybe positioning themselves in this stock ahead for an upswing in its bottom-line. Based on technical breakout, TienWah could be a good trading BUY or even a good stock for long-term investment.

Jerneh rallying on heavy volume

Jerneh is having a strong rally, with heavy volume today. It gained 51 sen to close at RM2.75 at the end of the morning session. Meanwhile, Jerneh-WA hit its limit-up price of RM1.21 as at 11.58 am (gaining 29.5 sen over Friday close). Jerneh-WA, which has an exercise price of RM1.60, commands a small premium of 2%. What sparked the strong rally? Could it be due to further development in its proposed disposal of its 80%-stake in Jerneh Insurance Bhd (JIB)?

From the chart below, we can see that the next strong horizontal resistance is at RM3.00, which could be a good level for some profit-taking. However, selling will not be easy in the face of such strong momentum, which promises higher price ahead. Maybe it is different this time as far as Jerneh is concerned, but my feeling about the present market is that a winner in this market seems to have little trouble recruiting buyers. On signs of faltering prices, the same stock will bring forth many sellers. This remains me of an old saying: Nothing succeeds as well as success, nothing recedes as fast as success. In line with this, I believe that we should progressively take profit when Mr. Market offers a good price for our stock.


Chart: Jerneh's monthly chart as at Mar 1, 2010 (Source: Tradesignum)

Sunday, March 21, 2010

Haio- time for some profit-taking

Results Update

Haio has just announced its results for 3Q2010 ended 31/1/2010. Its net profit dropped by 10.8% q-o-q to RM18.0 million on the back of a marginally 1%-drop in turnover to RM131.3 million. Compared to the previous corresponding quarter (QE31/1/2009), its net profit increased by 50.2% while turnover was 29% higher.

The lower turnover on a q-o-q basis was due to lower sales recorded by MLM & retail division. This coupled with higher personnel expenses & A&P expenses led to a decline in net profit.

This is the second q-o-q decline for Haio. The last time Haio had a q-o-q decline was in QE31/10/08 & QE31/7/08. This coincided with a fairly significant consolidation in Haio during that period (see Chart 1& 3 below).


Table: Haio's last 8 quarterly results
Note: EPS, DPS & NTA have been adjusted for the recent share split & bonus issue.


Chart 1: Haio's last 20 quarterly results

Valuation

Haio (closed at RM4.68 on March 19) is now trading at a PER of 13 times (based on EPS of 36 sen for the last 4 quarters). Based on steady growth in both top-line & bottom-line over the past few years (albeit an occasional q-o-q decline), Haio could easily trade at PER of 15-18 times. Assuming a PER of 15 times, Haio's fair value is RM5.40.

Technical Outlook

Haio has risen from about RM1.40 in March 2009 to a high of RM4.90 a few days ago. There are two negative signs appearing on Haio's daily chart (Chart 2). Firstly, we can see 2 shooting stars formed, which indicate a potential temporary top. Secondly, we can see some weakness in the Slow Stochastic, which has slid lower, indicating a built-up of bearish forces.

Haio's immediate support is at the horizontal line of RM4.50 & the 20-day SMa line of RM4.35. A break below RM4.35 could trigger more prolonged consolidation.


Chart 2: Haio's daily chart as at Mar 19, 2010 (Source: Tradesignum)


Chart 3: Haio's weekly chart as at Mar 15, 2010 (Source: Tradesignum)

Conclusion

Based on 2 quarters of decline in both top-line & bottom-line & potentially bearish technical signals, I believe that some profit-taking in Haio may be a good idea. However, I believe that Haio is still a good stock for long-term investment due to its past steady growth and possible further upside in its valuation.

Thursday, March 18, 2010

Topglove- another great quarter

Results Update

Topglove has just announced its results for 1H2010 ended 28/2/2010. Its net profit increased by 8.2% q-o-q or 95.9% y-o-y to RM70.5 million. Turnover increased by 8.0% y-o-y or 47.2% q-o-q to RM510 million. Despite the rapid expansion by all players in this industry, it is good to note that Topglove has been able to maintain its pre-tax profit margin at 18.4% for the past three quarters. This is a sign that increased supply was met by increasing demand for rubber glove.


Table: Topglove's last 8 quarterly results


Chart 1: Topglove's last 15 quarterly results

Valuation

Topglove (closed at RM12.56 yesterday) is now trading at a PER of 16 times (based on last 4 quarters of 79 sen). With top-line growth of 19% in the last 3 year (actually, 23% for the past 4 quarters & 15% for the preceding 4 quarters), Topglove's Price/Earnings To Growth ('PEG') ratio is about 0.77 time. A PEG ratio of less than 1 means that the stock is attractive. However, this may not be the case if profit margin were to ease off.

PEG ratio = PE / (Growth Estimate + Dividend Yield)
= 16 / (19 + 1.8)
= 0.77 times

Note: I have substituted Revenue growth for Earning growth as the latter has shot up sharply last 3 quarters (due to higher profit margin).


Negative scenario examined

Assuming that Topglove's pre-tax profit margin dropped back from 18.4% to 12% (the average pre-tax profit margin for QE28/2/2009 & QE30/11/2008). The pre-tax profit for the last 4 quarter of RM314 million would be reduced to RM205 million. Assuming the same effective tax rate of 26%, Topglove's net profit would drop from RM235 million to RM152 million and EPS would ease off from 79 sen to 51 sen. Its PER would be about 25 times and PEG ratio would be about 1.2 times. From this, we can see that profit margin is critical to maintaining super profit for this industry. As the players keep on increasing their production capacity, the industry will slowly reach a saturation point. We must be aware of this possibility even as we cheer the players for their out-performance today.

Technical Outlook

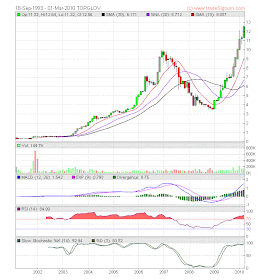
From the two charts below, there is no sign of any weakness in Topglove. From Chart 2, we can see that Topglove would surge higher at every upside breakout of a resistance (I have counted 4). In the past 14 months, the 20-day SMA line has offered good support for the stock. There was only a period when the share price went below the 20-day SMA line & tested the 50-day SMA line (in August & September last year). We may use the 50-day SMA line as a warning sign for a possible reversal for Topglove. From Chart 3, we can see that the last bull rally for Topglove ended with a break below the 10-month SMA line. To use this trigger for a selling signal may not be a good idea as it is too slow, resulting in giving back too much profit (or taking on too much losses) before exiting the stock.


Chart 2: Topglove's daily chart as at Mar 17, 2010 (Source: Tradesignum)


Chart 3: Topglove's monthly chart as at Mar 1, 2010 (Source: Tradesignum)

Conclusion

Based on good financial performance, reasonable valuation & positive technical outlook, Topglove is still a HOLD. However, we need to track Topglove's financial results closely for a reversal in the super normal profit enjoyed by the company.

Waseong- a good trading BUY

According to the Starbiz, Wah Seong Corp Bhd ('Waseong') has submitted a bid to buy over Italian company Socotherm SpA ('Socotherm') three weeks ago. The later appears to be in a tight financial position as it had sold off its 32.5%-stake in its JV, PPSC Industrial Holdings Sdn Bhd to Waseong. According to the Starbiz:
Listed on the Italian Stock Exchange, Socotherm has a strong foothold in South America and Gulf of Mexico. However, the group has been weighed down by debts of some 250 million euros and been making losses since its 2007 fiscal year. On Socotherm’s strengths, Maccagno said it was in markets that Wah Seong was presently not.

“The integration of Wah Seong’s and Socotherm’s pipe coating businesses would catapult us to be the biggest in terms of geographical spread and the second largest global player of this sector in the oil and gas industry,” said Maccagno.

I would rate the chance of success for Waseong's bid to be fairly good due to the following:
1) Waseong & Socotherm have a close working relationship;
2) Waseong's deputy MD, Maccagno was a former employee of Socotherm; and
3) Both companies are in the same business of pipe-coating and would derive tremendous synergies if both companies merged.

From the daily chart (Chart 1), it appears that Waseong has broken above its horizontal resistance of RM2.48 this morning. From the weekly chart (Chart 2), we can see that Waseong may encounter some resistance from a slanting 'horizontal line' ('AA') at about RM2.50. If it can convincingly break above these 2 resistances, Waseong would likely to enter into its next upleg. The next resistance & the minimum target is at RM2.70-75.


Chart 1: Waseong's daily chart as at Mar 18, 2010_9.10am (Source: Quickcharts)


Chart 2: Waseong's weekly chart as at Mar 15, 2010 (Source: Tradesignum)

Based on technical breakout, Waseong could be a trading BUY.

Wednesday, March 17, 2010

USD index to test its 50-day SMA line soon

Lately, the USD has eased off a bit. From Chart 1, we can see that USD index may pull back to the 50-day SMA line at 79.31. In the previous sharp rally for USD index from July 2008 to March 2009, we also witnessed a correction where USD index pulled back to the 50-day SMA line before rallying further (see the pick boxes).


Chart 1: USD's daily chart as at Mar 16, 2010 (Source: Stockcharts.com)

For the USD-RM exchange rate, we can see that the strengthening of the USD has caused the USD-RM exchange rate to break above the downtrend line in late January this year. Subsequent correction has pushed back the USD to below the downtrend line again, where an expanding triangle can be seen. USD-RM has just rebounded off the support of that triangle & it is expected to rise within the next few days to re-test the downtrend line resistance at 3.40. An upside breakout of both the downtrend line (at 3.40) & the expanding triangle (at 3.48) could then signal an uptrend for USD-RM.


Chart 2: USD-RM's daily chart as at Mar 16, 2010 (Source: Yahoo Finance)

What could be the catalysts for a strengthening in the USD index? Could it be due to simmering worries about the issue of sovereign risk, particularly in Europe? Or, could it be the re-deployment of funds away from the commodities complex (due to possible soft-landing in an overheated China) which has always been a play on a weakening USD? We can see from Chart 3 below that CRB has broken below its uptrend line in January this year, which coincided with Shanghai's SSEC index breaking below its uptrend line (see Chart 4).


Chart 3: CRB's daily chart as at Mar 15, 2010 (Source: Stockcharts.com)


Chart 4: SSEC's daily chart as at Mar 15, 2010 (Source: Stockcharts.com)

From what we had seen in January this year, we can expect that a continuation of the rally in USD could lead to sharp corrections in commodity as well as equity markets.

KSeng & MTD- a tale of two stocks

KSeng's value to emerge?

In the March 8 issue of the Edge newsletter, there was an article entitled "Time for Keck Seng's value to emerge", where the writer highlighted KSeng's revised NAV per share of RM17.10 provided the company revalued its entire landbank, properties & equity investment. This is not something new as it was picked up before by other writers or reports. For example, the Starbiz in April 2007 made a similar observation:
Based on a conservative estimation arrived at by adding surpluses from the revaluation of Keck Seng's Johor land bank and its equity investments, the company's total NTA could reach as high as RM15 a share compared with RM4.34 currently.

In investment, the re-discovery of a piece of information that had been in the public domain normally would not lead to a strong price movement. So, it was quite a surprise that KSeng put in a sustained strong rally after the Edge article came out, with the share price rallying to a high of about RM5.50-60. Notwithstanding the fine run, I doubt KSeng can go below the RM5.50-60. If the rally were to falter now, KSeng would be putting in a double-top reversal which is similar to another double-top reversal in 1996.


Chart 1: KSeng's monthly chart as at Mar 1, 2010 (Source: Tradesignum)

MTD trading within a multi-year range

This week, the Edge has an article on MTD's venture in the Philippines entitled "MTD stirs on Philippine highway venture". The highway, South Luzon Expressway ('SLE') is expected to contribute an EBIT of RM40 million to MTD's earning in FY2011. SLE is owned by South Luzon Tollway Corp ('SLTC'), which MTD has a 80%-stake. MTD has the first right of refusal to buy the remaining 20% which is currently owned by Phillipine National Construction Corp ('PNCC'). The speculation in the market is that this 20%-stake is up for sale at 4.85 billion Philippines pesos (or, RM352.6 million). As such, MTD's 80%-stake could be valued at RM1.41 billion. This compared favorably to the amount that MTD has spent to rehabilitate the SLE, which was estimated to be about RM870 million. If MTD chose to sell off its stake in SLTC (due to various disputes in the partnership), the exceptional gain could be more than RM500 million.

Strangely, the market did not react to this piece of news. This is because the news has already been circulating in the market for a few weeks which might account for the strong rally in MTD since late February from RM2.90 to about RM3.60-70. One blog which did a nice write-up on MTD was Malaysian Finance (here). From the chart below, we can see that MTD has been trapped within a range between RM1.50 & RM3.50 for the past 10 years. Unless, the deal to sell off its stake in SLTC has been sealed up, I doubt MTD can trade above the RM3.50 resistance.


Chart 2; MTD's monthly chart as at Mar 1, 2010 (Source: Tradesignum)

From the above, we can conclude that investors may jump onto a stock even when the 'news' are old news if the stock hasn't run up yet. Even when that happens, we must also look out for strong resistance level where stale bulls may decide to unload their stocks onto unsuspecting new investors.

Jobst poised to make new high

Technical Outlook

Jobst broke about its strong horizontal resistance at RM1.80 earlier this month (see Chart 1). The share price, which was slowly inching higher, has now broken into a galloping run (see Chart 2). However, it should be noted that this breakout occurred after a sharp run-up at the end of February, where the stock soared from RM1.45 to RM1.80.


Chart 1: Jobst's weekly chart as at Mar 15, 2010 (Source: Tradesignum)


Chart 2: Jobst's 60-min chart as at Mar 17, 2010_9.30am (Source: Quickcharts)

Recent Corporate Development

Two recent developments could be the catalyst for the current upleg. Firstly, SEEK Ltd, the market leader amongst employment websites in Australia & New Zealand lifted its shareholding in Jobst to 21.35%. Secondly, Jobst (via its wholly-owned Singapore subsidiary, Jobstreet Singapore) bought out its JV partner, TV18's 50%-stake in the India JV, Jobstreet India.

Recent Financial Results

From the table below, we can see that Jobst's net profit fro QE31/12/2009 soared to RM6.3 million from RM1.7 million last year. The sharply lower net profit recorded in QE31/12/2008 was due to provision for diminution of value of investment of RM5.4 million. However, Jobst's net profit dropped 17.7% q-o-q on the back of a 5.6%-drop in turnover.


Table: Jobst's last 8 quarterly results


Chart 3: Jobst's last 15 quarterly results

Valuation

Jobst (at RM2.00 as at 10.45 am) is trading at a PER of 23 times (based on FY2009 EPS of 8.6 sen). At this PER multiple, Jobst is deemed fully valued.

Conclusion

Based on recent financial performance & valuation, Jobst's upside is deemed limited. However, the stock could be a trading BUY based on technical consideration.