This is a personal weblog, reflecting my personal views and not the views of anyone or any organization, which I may be affiliated to. All information provided here, including recommendations (if any), should be treated for informational purposes only. The author should not be held liable for any informational errors, incompleteness, or delays, or for any actions taken in reliance on information contained herein.
Friday, October 29, 2010
Dayang has a very bullish breakout
Dayang gained 20 sen to close at RM2.59 today.The sharp rally saw the stock breaking above its horizontal resistance at RM2.40 as well as the line connecting three prior peaks. See the daily & weekly chart below.
Chart 1: Dayang's daily chart as at Oct 29, 2010 (Source: Quickcharts)
Chart 2: Dayang's weekly chart as at Oct 29, 2010 (Source: Quickcharts)
Dayang is an oil & gas service provider. For 1H2010 ended 30/6/2010, Dayang recorded a net profit of RM27.4 million on a turnover of RM99.5 million (go here). Its EPS for that period was 7.79 sen- giving the company an annualized EPS of 15.58 sen. At RM2.59, Dayang is trading at a current PE of 16.6 times. At this multiple, Dayang is deemed overvalued. The market is obviously anticipating some very positive development for this stock in order to justify the current market price.
Dayang has a very healthy financial position. As at 30/6/2010, its current ratio was at 3.3 times while its borrowings to equity stood at 0.3 time only.
Based on bullish technical outlook, Dayang could be a trading BUY. However, Dayang has rallied quite substantially today & one may be better served by buying on a pullback.
HPI may have a bullish breakout
Table: HPI's last 8 quarterly results
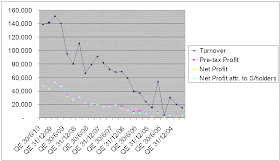
Chart 1: HPI's last 24 quarterly results
This morning, HPI has broken above its horizontal resistance at RM2.00. With this breakout, the stock is likely to continue with its prior uptrend. Its potential target is RM2.20-2.30.
Chart 2: HPI's daily chart as at Oct 29, 2010_9.10am (Source: Quickcharts)
Based on improved financial performance & technical breakout, HPI could be a trading BUY.
Thursday, October 28, 2010
MEGB- re-testing its low of RM2.80 soon
Chart: MEGB's daily chart as at Oct 28, 2010_4.40pm (Source: Quickcharts)
Why is this stock dropping? Could it be due to mundane reasons such as delay in opening of some of its planned campuses? CIMB has recently issued a BUY call on this stock, valuing it at RM4.62 (here). I have my skepticism for this stock (here) but I am still puzzled by its poor share performance since its listing.
Kuchai- is this ride taken?
Chart 1: Kuchai's daily chart as at Oct 28, 2010_11.45am (Source: Tradesignum)
Those who have been in the stock market long enough would recall that Kuchai had a massive bonus issue in 2006 (here). For every one share owned, Kuchai's shareholder received 45 bonus shares. As the stock approached the entitlement date, Kuchai share price launched into a near vertical parabolic rise. It touched an adjusted high of RM4.704 (or, unadjusted high of RM216.50). Such sharp rallies are like reverse bungee jumps- it is bound to drop back to the ground. Is it about to do something similar. Let's wait & see.
Meanwhile for those holding this stock, you should take note that the immediate strong horizontal resistance is at RM1.30-1.35. Success in taking out this resistance will get you a ticket to ride on a reverse bungee. Enjoy your ride!
Chart 2: Kuchai's weekly chart as at Oct 28, 2010_11.45am (Source: Tradesignum)
Note: Malaysia Finance has a write-up on this stock (here).
Wednesday, October 27, 2010
KSeng poised for a bullish breakout
Yesterday, it went to an intra-day high of RM6.15 but closed at RM6.09- just shy off the upside breakout level of RM6.10. This morning, Kseng again went above the RM6.10 breakout level- going as high as RM6.14 before pulling back to the present price of RM6.09 (as at 10.40am). KSeng's yesterday move was on big volume but the volume has dwindled substantially.
Chart 1: KSeng's weekly chart as at Oct 26, 2010 (Source: Quickcharts)
If KSeng can break above the RM6.10 level, it could rally significantly in a technical 'blue sky' scenario (see Chart 2). KSeng's share price could potentially go as high as RM10.00-20.00. This target is arrived at by adding the trading range (A) to the breakout point (RM6.10). If we based on a logarithmic chart, the target price could be about RM15.00-20.00 (such as the one below). If we used a linear chart, the target price is about RM9.70-10.00.
Chart 2: KSeng's monthly chart as at Oct 1, 2010 (Source: Tradesignum)
This is an anticipatory trading BUY call. KSEng has yet to surpass the upside breakout level of RM6.10 convincingly. As such, the stock is not a trading BUY yet.
Tuesday, October 26, 2010
John Murphy's Ten Laws of Technical Trading
I’ve come across an article by Chip Anderson in Chartwatchers (here), which addressed some of the questions that beginners may ask when they start out on their journey to learn about technical analysis. The topic is fairly wide & one may have to spend a few years to learn in-depth about this subject in order to be a professional, either a Certified Technical Analyst or a Chartered Market Technician. If you just want to have a good working knowledge of technical analysis, then all you need is a good book on technical analysis (such as John Murphy’s Technical Analysis of the Futures Markets) and a good charting program (such as Metastocks). I do not hold a professional qualification in technical analysis. My knowledge of the subject comes from continuous learning & daily observation of charts & the market. I use my technical knowledge- alone or complemented with fundamental analysis- in order to pick stocks that would give outstanding performance as well as determining the likely direction of the broader market.
I have listed below John Murphy’s Ten Laws of Technical Analysis, which I hope would help you to decide whether you would like to learn more about this important topic. In my opinion, technical analysis would improve your investment performance significantly if it is learned properly & applied correctly.
1. Map the Trends
Study long-term charts. Begin a chart analysis with monthly and weekly charts spanning several years. A larger scale map of the market provides more visibility and a better long-term perspective on a market. Once the long-term has been established, then consult daily and intra-day charts. A short-term market view alone can often be deceptive. Even if you only trade the very short term, you will do better if you're trading in the same direction as the intermediate and longer term trends.
2. Spot the Trend and Go With It
Determine the trend and follow it. Market trends come in many sizes – long-term, intermediate-term and short-term. First, determine which one you're going to trade and use the appropriate chart. Make sure you trade in the direction of that trend. Buy dips if the trend is up. Sell rallies if the trend is down. If you're trading the intermediate trend, use daily and weekly charts. If you're day trading, use daily and intra-day charts. But in each case, let the longer range chart determine the trend, and then use the shorter term chart for timing.
3. Find the Low and High of It
Find support and resistance levels. The best place to buy a market is near support levels. That support is usually a previous reaction low. The best place to sell a market is near resistance levels. Resistance is usually a previous peak. After a resistance peak has been broken, it will usually provide support on subsequent pullbacks. In other words, the old "high" becomes the new low. In the same way, when a support level has been broken, it will usually produce selling on subsequent rallies – the old "low" can become the new "high."
4. Know How Far to Backtrack
Measure percentage retracements. Market corrections up or down usually retrace a significant portion of the previous trend. You can measure the corrections in an existing trend in simple percentages. A fifty percent retracement of a prior trend is most common. A minimum retracement is usually one-third of the prior trend. The maximum retracement is usually two-thirds. Fibonacci retracements of 38% and 62% are also worth watching. During a pullback in an uptrend, therefore, initial buy points are in the 33-38% retracement area.
5. Draw the Line
Draw trend lines. Trend lines are one of the simplest and most effective charting tools. All you need is a straight edge and two points on the chart. Up trend lines are drawn along two successive lows. Down trend lines are drawn along two successive peaks. Prices will often pull back to trend lines before resuming their trend. The breaking of trend lines usually signals a change in trend. A valid trend line should be touched at least three times. The longer a trend line has been in effect, and the more times it has been tested, the more important it becomes.
6. Follow that Average
Follow moving averages. Moving averages provide objective buy and sell signals. They tell you if existing trend is still in motion and help confirm a trend change. Moving averages do not tell you in advance, however, that a trend change is imminent. A combination chart of two moving averages is the most popular way of finding trading signals. Some popular futures combinations are 4- and 9-day moving averages, 9- and 18-day, 5- and 20-day. Signals are given when the shorter average line crosses the longer. Price crossings above and below a 40-day moving average also provide good trading signals. Since moving average chart lines are trend-following indicators, they work best in a trending market.
7. Learn the Turns
Track oscillators. Oscillators help identify overbought and oversold markets. While moving averages offer confirmation of a market trend change, oscillators often help warn us in advance that a market has rallied or fallen too far and will soon turn. Two of the most popular are the Relative Strength Index (RSI) and Stochastics. They both work on a scale of 0 to 100. With the RSI, readings over 70 are overbought while readings below 30 are oversold. The overbought and oversold values for Stochastics are 80 and 20. Most traders use 14-days or weeks for stochastics and either 9 or 14 days or weeks for RSI. Oscillator divergences often warn of market turns. These tools work best in a trading market range. Weekly signals can be used as filters on daily signals. Daily signals can be used as filters for intra-day charts.
8. Know the Warning Signs
Trade MACD. The Moving Average Convergence Divergence (MACD) indicator (developed by Gerald Appel) combines a moving average crossover system with the overbought/oversold elements of an oscillator. A buy signal occurs when the faster line crosses above the slower and both lines are below zero. A sell signal takes place when the faster line crosses below the slower from above the zero line. Weekly signals take precedence over daily signals. An MACD histogram plots the difference between the two lines and gives even earlier warnings of trend changes. It's called a "histogram" because vertical bars are used to show the difference between the two lines on the chart.
9. Trend or Not a Trend
Use ADX. The Average Directional Movement Index (ADX) line helps determine whether a market is in a trending or a trading phase. It measures the degree of trend or direction in the market. A rising ADX line suggests the presence of a strong trend. A falling ADX line suggests the presence of a trading market and the absence of a trend. A rising ADX line favors moving averages; a falling ADX favors oscillators. By plotting the direction of the ADX line, the trader is able to determine which trading style and which set of indicators are most suitable for the current market environment.
10. Know the Confirming Signs
Include volume and open interest. Volume and open interest are important confirming indicators in futures markets. Volume precedes price. It's important to ensure that heavier volume is taking place in the direction of the prevailing trend. In an uptrend, heavier volume should be seen on up days. Rising open interest confirms that new money is supporting the prevailing trend. Declining open interest is often a warning that the trend is near completion. A solid price uptrend should be accompanied by rising volume and rising open interest.
"11."
Technical analysis is a skill that improves with experience and study. Always be a student and keep learning.
- John Murphy
Friday, October 22, 2010
Exxon may have a bullish breakout
Chart: Exxon's weekly chart as at Oct 16, 2010 (Source: Yahoo Finance)
Based on the technical breakout, Exxon could be a trading BUY.
Steel sector is stirring up
Chart 1: All Carbon Steel Products Composite Price & Index charts (June 2006 to Sept 2010) from MEPS (INTERNATIONAL) LTD
The rise in steel prices reflect the increased demand & higher cost of iron ore. Over the past 2 weeks, we can see the share price of our local steel producers is slowly moving up again. My preferred stocks for this sector are AnnJoo & KinSteel. Both stocks have broken above their downtrend line.
Chart 2: AnnJoo's weekly chart as at Oct 22, 2010_11.00am (Source: Quickcharts)
Chart 3: Kinsteel's weekly chart as at Oct 22, 2010_11.00am (Source: Quickcharts)
Based on the improved fundamental & technical breakout, steel stocks could be good trading BUY.
Thursday, October 21, 2010
KBunai poised for correction
Chart: KBunai's 60-min chart as at Oct 20, 2010 (Source: Quickcharts)
The gift that keeps giving! First, Pemandu at the Economic Transformation Plan (ETP) open day on September 22 announced that an integrated resort (IR) - including a mangrove centre, water theme park and waterfront properties- will be developed on a 500-acre “eco-nature” resort in Karambunai, Sabah. This IR may come with the option to build a casino to ensure a higher return on investment (ROI). Later, Karambunai denied that the IR would include the development of any casino (here).
At the Budget announcement on October 15, it seems that the government would be developing this resorts at a cost of RM3 billion. Now, it is made clear that it’s a public-private partnership with the government contributing RM100 million to the total development cost of RM3 billion (here).
Like the saying goes, “If wishes were horses, then beggars would ride on them.” My concerns are as follows:
· Would the project be any more successful than MK Land’s Bukit Merah resort?
· Should the RM100 million be spent to build up an area which can cater for more than one resort? Taman Negara could be a good model to follow. Imagine a similar RM100 million allocation for Mutiara Taman Negara as compared to funding the development of the infra-structure around Taman Negara.
· Would a RM3 billion “eco-nature” resort be so massive that you can’t see any more “eco-nature” in the resort?
All in all, I am not sold on the idea of Karambunai as a stock nor Karambunai as “eco-nature” resort, with or without a RM100 million contribution from the government.
Wednesday, October 20, 2010
Rubber glove sector- to buy or not to buy?
From Chart 1 & 2 below, we can see that Topglov & Kossan are trend-following stocks, giving idealized charts for easy technical analysis. The best way to establish the trend of these stocks is by plotting the 10, 20 & 40- week SMA lines (equivalent to the 50, 100 & 200-day SMA lines). Once the 10 & 20-week SMA lines have cut below the 40-week SMA line (or, the death cross sighted), the stocks would enter into a bearish phase. When the reverse happened [the 10 & 20-week SMA lines have cut above the 40-week SMA line (or, the golden cross sighted)], the stocks would enter into a bullish phase.
Topglov & Kossan have witnessed the death cross 2 or 3 weeks ago. The last time Topglov has experienced the same technical event was in July 2007 while Kossan had its death cross in October 2007. Both stocks then entered into a downtrend until the golden cross appeared in March 2009- signaling the bull rally for these stocks for the past 15 months.
Chart 1: Topglov's weekly chart as at Oct 20, 2010_11.00am (Source: Quickcharts)
Chart 2: Kossan's weekly chart as at Oct 20, 2010_11.00am (Source: Quickcharts)
I have also appended below the charts of Harta & Supermx who show promise of a recovery. In Chart 3, we can see that Supermx has recovered so much ground that its 10-week SMA line is poised to curve above the 40-week SMA line.
Chart 3: Supermx's weekly chart as at Oct 20, 2010_3.30pm (Source: Quickcharts)
In the case of Harta, we can see that the share price has recently revisited its recent high at RM5.60-5.66. While it failed to break above the recent high (and may set the stage for a potential bearish triple top reversal), the fact that it managed to re-test the recent high is very commendable. You may notice that the 10-week SMA line has curved above the 40-week SMA line.
Chart 4: Harta's weekly chart as at Oct 20, 2010_11.00am (Source: Quickcharts)
What could have triggered the strong rebound in rubber glove stocks? Everything, that can go wrong for this sector, has gone wrong. They are:
1. a normalizing demand (& a looming excess production capacity situation);
2. a sharp rise in the prices of rubber latex (see Chart 5) and the cost of other raw material; and
3. an unfavorable movement in the forex rates (albeit a potential short-term relief).
(Note: TSR 20 index as proxy for rubber latex price)
Chart 5: TSR 20 index & CRB's weekly chart as at Oct 19, 2010 (Source: Rubbernet)
Based on fundamental reasons, I am still very skeptical on the near term outlook for rubber glove stocks. However the strong rebound in the share price seems to suggest things are on the mend. We would have a much clearer picture in a few weeks' time, which would come from either more positive technical readings or the release of the financial results for QE30/9/2010 for Supermx, Harta & Kossan (expected in 2nd week of November).
USD rebounding at last
USD index tested the uptrend line at the 76 mark & rebounded yesterday. This rebound could carry the index to its 50-day SMA line at 80.66 (denoted as 'A'), which would be comparable to the rebound of June-July 2009 (denoted as 'A"'). After this potential rebound, I believe the USD would continue to drift lower as a death cross has been sighted (with its 50-day SMA line crossed below its 200-day SMA line). The entire downtrend for USD might last for many months (denoted as 'X') which is comparable to the preceding downtrend from March to December 2009 (denoted as 'X"').
Chart 1: USD's daily chart as at October 19, 2010 (Source: Stockcharts.com)
The weakness in the USD has been a boon to many risk assets, such as emerging markets equities & commodities. A new round of Quantitative Easing (known as QE2) by the US Fed has been openly discussed that it may have achieved half its objectives even before it was rolled out. Whatever the impact of QE2, investors have voted by moving their funds into other assets- especially gold. In time of crisis or period of hyper-inflation, people can only count in one currency that can retain its value. That's safe haven currency is gold.
Chart 2: Gold's daily chart as at October 19, 2010 (Source: Stockcharts.com)
Today, as we celebrate our success in investing in equities & properties, let's not forget that this success is due partly to the sharp drop in the value of our currencies- be it RM or USD. Below I have appended the charts of crude oil, CRB, S&P500 and SSEC as priced in gold. Notice how CRB, S&P500 and SSEC are revisiting its crisis low!
Chart 3: WTIC:GOLD & CRB:GOLD's daily chart as at October 19, 2010 (Source: Stockcharts.com)
Chart 4: S&P500:GOLD & SSEC:GOLD's daily chart as at October 19, 2010 (Source: Stockcharts.com)
The continuous, aggressive creation of more money & credit may one day save us from the next Great Depression but at what cost. Every central banker in the developed countries is working overtime to unleash some inflation in order to beat off the specter of deflation. After all, no one wants a Japanese lost decade. If we are not careful, we may get something equally bad- a German Hyperinflation. These are dangerous times, indeed!
Friday, October 15, 2010
Market Outlook as at October 15, 2010
FBM-KLCI has risen steadily from its low of 1250 at the end of May to touch an intra-day high of 1503 yesterday. The powerful liquidity-driven rally is experiencing some profit-taking today. From the chart below, we can see bearish divergence in some indicators which signaled underlying weakness in the market.
The current correction may bring the index down to the horizontal line 1480, which was September high. In addition, I drew the immediate uptrend line ('SS') which connects the troughs since May. Two 'parallel' lines were also drawn- one marking the upper boundary while the second line delineating the mid-point. This second line should also provide some support to the index at 1480 level in the current correction. All in all, I believe the developing correction to be healthy & the 1480 level should be a good entry level to the market.
Chart: FBM-KLCI's dail chart as at Oct 15, 2010_10.30am (Source: Quickcharts)
Thursday, October 14, 2010
MMC- not favored to acquire PLUS
One of the parties which had submitted a proposal to takeover PLUS is MMC. When the market got wind of the proposal, it chased the share to a high of RM3.38 on October 4. Today, MMC share price is positive but very subdued. There are growing concern that MMC or its main shareholder, Syed Mokhtar is controlling too many strategic assets due to his close connection with the ruling party, UMNO (go here). The subdued rally in MMC share price is a sign that the company is not favored to acquire PLUS.
Chart: MMC's 15-minute chart as at Oct 14, 2010_12.20pm (Source: Quickcharts)
Wednesday, October 13, 2010
Shanghai's SSEC index may have a bullish breakout
As at 3.01am EDT,SSEC was trading at 2861.36 (a gain of 19.95 points or 0.70%). SSEC rallied after it re-opened on October 8 following a 5-day holiday (from October 1 to October 7). This means that SSEC has broken above its 200-day SMA line at 2835 as well as the long-term downtrend line (at 2830) that stretches back to October 2007. With these double breakout, I believe SSEC is likely to commence on its new uptrend. You should get into CIMBX25 asap.
Chart: SSEC's weekly cahrt as at Oct 11, 2010_plotted on log scale (Source: Yahoo Finance)
Pelikan may have a bullish breakout
Pelikan is involved in the manufacturing & distribution of writing instruments, art, painting & hobby products, office stationeries & printing consumables. In 1Q2010, it completed the acquisition of the Herlitz, Molkari & Ganymed group, which is involved in the sales of school and office products. For more on Herlitz, go here.
Recent Financial Results
Pelikan's results are pretty volatile. In QE31/3/2010, its net profit soared due to the recognition of negative goodwill of RM143.1 million from the acquisition of the Herlitz, Molkari & Ganymed group.
Table: Pelikan's last 8 quarterly results
Chart 1: Pelikan's 24 quarterly results
Financial Position
Pelikan's financial position is deemed satisfactory, with current ratio at 1.63 times & debt to equity at 0.57 time as at 30/6/2010.
Valuation
From the EPS of 4.58 sen for QE30/6/2010 & assuming that this June quarter accounts for 45-50% of its earning for a full year, I have arrived at an estimate for FY2010 EPS of 10 sen. Based on current price of RM1.24, Pelikan is trading at a PE of 12.4 times. At this multiple, Pelikan is deemed fairly valued, with limited potential upside.
Technical Outlook
Pelikan has been sliding even since it made a high of RM1.60 in August 2009. It has just broken above its downtrend line at RM1.21-1.22. Its next resistance levels are at the horizontal lines of RM1.30 & then RM1.40.
Chart 2: Pelikan's daily chart as at Oct 11, 2010 (Source: Tradesignum)
Conclusion
Based strictly on technical consideration, Pelikan could be a good trading BUY. However, if Pelikan can derive synergy from its new acquisition, it should be a stock to watch.
Tuesday, October 12, 2010
USD-RM cross rate poised to rebound
The Thai government agreed today to impose a 15 per cent withholding tax on interest and capital gains earned by foreign investors on Thai bonds, the latest bid by an emerging economy to tame its surging currency.For more, go here.
I believe this is one of the best weapons to tackle the inflow of hot moneys into our region. The alternative is to impose capital controls which are even more unpalatable to international community. Slowly but surely, the tide is turning...
From Chart 1 below, we can see that the cross rate for USD-RM has gone above the 20-day SMA line at 3.09. As at 4.30 am EDT, USD-RM cross rate was traded at 3.1065. Would the USD-RM cross rate rise sharply like in June-July 2009 (denoted as 'A') & April-June 2010 (denoted as 'C') or would it swing up & down like in October 2008 to February 2009 (denoted as 'B')? A sharp rise in the USD-RM cross rate would lead to a sharp correction in our stock market (see Chart 2 below). On the other hand, a bumpy ride for the USD-RM cross rate may not jeopardize the current rally in the stock market. I am more inclined towards the second scenario since the USD index has already recorded a death cross (as noted in an earlier post). Nonetheless, we must be prepared for choppy tradings ahead.
Chart 1: USD-RM exchange rate as at September 22, 2010 (Source: Yahoo Finance)
Chart 2: FBM-KLCI's daily chart as at Oct 11, 2010 (Source: Tradesignum)
Coastal- a good stock for long-term investment
Background
Coastal Contract Bhd ('Coastal') is involved in the provision of marine products & services to the shipping, Oil & Gas and commodities industries.
Recent Financial Results
For the QE30/6/2010, Coastal's net profit increased by 11.5% q-o-q or 46.4% y-o-y to RM48.3 million while its turnover was marginally lower than the immediate preceding quarter (QE31/3/2010) but soared by 46% over the previous corresponding quarter (QE30/6/2009). The beetr performance was attributable to better revenue from the Shipbuilding division.
Table: Coastal's last 8 quarterly results
A look at the past 6 years chart of Coastal's top-line & bottom-line shows that the company's growth record has been very impressive & consistent.
Chart 1: Coastal's 24 quarterly results
Financial Position
Coastal's financial position is healthy. As at 30/6/2010, its current ratio stood at 1.8 times while its bank borrowings to shareholders' funds stood at 0.3 time.
Valuation
Coastal (closed at RM2.29 yesterday) is now trading at a PE of 4.3 times its last 4 quarters' EPS of 52.55 sen. At this multiple & strong growth track record, Coastal is deemed a very attractive stock.
Technical Outlook
I have presented below 2 charts of Coastal. Chart 2 is the weekly chart plotted on arithmetic scale. It shows a stock that is trapped with a triangle ('XYZ'), with upside breakout (or, resistance) at RM2.40 & downside breakout (or, support) at RM2.15. Coastal was similarly trapped within a triangle in 2008, where it broke to the downside due to intense selling pressure during the Global Financial Crisis. With no crisis in sight, this bearish is not a likely scenario.
Chart 2: Coastal's weekly chart as at Oct 4, 2010_plotted on linear scale (Source: Tradesignum)
Chart 3 is a weekly chart plotted on logarithmic scale. It shows the stock in an uptrend (S-S2) where the support is at RM2.10. The horizontal support & resistance levels are at RM2.00-2.10 & RM2.40-2.70, respectively.
Chart 3: Coastal's weekly chart as at Oct 4, 2010_plotted on log scale (Source: Tradesignum)
Conclusion
Based on strong & steady financial performance, healthy financial position & attractive valuation, Coastal is a good stock for long-term investment. An upside breakout above RM2.40 could signal the continuation of its prior uptrend.
Monday, October 11, 2010
CPO has a bullish breakout today
Chart 1: CPO's daily chart as at Oct 11, 2010_3.00pm (Source: ifs.marketcenter.com)
The bullish breakout in CPO could lead to an upside breakout for the Plantation index, which is presently being blocked at the psychological 7000 level. In the afternoon session, the Plantation index is trading above the 7000 level.
Chart 2: Plantation's daily chart as at Oct 8, 2010 (Source: Tradesignum)
My preferred plantation stocks are IJMPlant and IOI. Even Sime may feature in the bullish plantation theme play.
Friday, October 08, 2010
Malton may have a bullish breakout
Malton Bhd ('Malton') is involved in construction, project management & property development. Malton is well-known for being the project manager for the development of The Pavillion, Kuala Lumpur. For more on the group's activities, go here.
Pertinent, Unrelated Developments
Lately, Malton's major shareholder, Desmond Lim made news when his private company, Urusharta Cemerlang KL) Sdn Bhd acquired a small parcel of land (measuring 0.7 acre) near The Pavilion for RM210 million. The land was acquired at a whopping price of RM7210 psf- a new benchmark for KL commercial land.
Desmond Lim is also linked to a consortium, which consists of 1Malaysia Development Bhd (1MDB) and Lembaga Tabung Angkatan Tentera (LTAT), that has received approval in principle to redevelope the Sungai Besi Royal Malaysian Air Force (RMAF) base. Go here for more details.
Desmond Lim's high profile could be a good thing as well as being a liability. This in turn could have a negative impact on Malton.
Financial Performance & Position
Malton is a profitable company, which reported a net profit of RM21.9 million on a turnover of RM346.9 million for FYJune2010. Its financial position is satisfactory, with current ratio at 2.3 times and bank borrowings to shareholders' funds of 0.3 time as at 30/6/2010.
Valuation
With FYJune2010 EPS of 6.27 sen & current price of RM0.60, Malton is trading at a OE of 9.6 times. At this PE multiple, Malton- a mid-size construction-cum-property group- is deemed fully valued.
Technical Outlook
Malton is currently testing its horizontal resistance at RM0.60 after it broke above its downtrend line at RM0.48-0.50 two weeks ago. If Malton can break above teh RM0.60 resistance, it may test higher levels at RM0.80 & then RM1.00-1.10.
Chart: Malton's monthly chart as at Oct 1, 2010_plotted on log scale (Source: Tradesignum)
Conclusion
Based strictly on technical consideration, Malton could be a trading BUY. A good entry is either at RM0.55 (on pullback) or when it has broken above the RM0.60 mark.
Wednesday, October 06, 2010
Topglov- the Gloves Comes Off!
Topglov has just announced its results for QE31/8/2010. Two things are worth noting immediately:
- its turnover dropped when compared to the immediate preceding quarter; and
- its net profit dropped for the second consecutive quarter.
Table: Topglov's last 8 quarterly results
Chart 1: Topglov's 17 quarterly results
Valuation
Topglov (closed at RM5.69 today) is now trading at a trailing PE of 14 times (based on its last 4 quarters' EPS of 40.7 sen). With earning sliding fast, the trailing PE may understate Topglov's PE multiple [or, make Topglov appear more attractive than it is (or will be)].
Technical Outlook
Topglov has rebounded from a recent intra-day low of RM4.98 recorded on September 23 to touch its 200-day SMA line (or equivalent to the 40-week SMA line) at RM5.75-5.80. Can it break above the 200-day SMA line? Not with this poor set of financial results!
Chart 2: Topglov's weekly chart as at Oct 6, 2010 (Source: Quickcharts)
Conclusion
Based on the poor financial results & negative technical outlook, I would rate Topglov a SELL.
Multico- another attractive smallcap
Multi-Code Electronics Industries (M) Bhd ['Multico'] is involved in the manufacturing of electronics parts and accessories for the automotive industries. The factory is located at the Pandan Industrial Area, Johor Bahru, with approximately 500 employees.
Recent Financial Results
Multico has recently announced its results for QE31/7/2010, where its net profit increased by 39% q-o-q from RM2.5 million to RM3.5 million on the back of a 14%-increase in turnover from RM26.6 million to RM30.3 million. The improved performance is attributable to increased demand for motor vehicles.
Table: Multico's last 8 quarterly results
Chart 1: Multico's 13 quarterly results
Other Information
The huge losses incurred in QE31/7/2007 was due to provision for doubtful debts. Recently, 2 former directors of Multico were found guilty of defrauding the company of RM18 million in 2007. For more, go here.
Financial Position
Multico's financial position is very healthy, with strong liquidity & very little bank borrowings. As at 31/7/2010, its current ratio stood at 2.13 times & gearing ratio at 0.01 time.
Valuation
Multico (closed at RM0.745 yesterday) is now trading at a PE of 3.5 times (based on last 4 quarters' EPS of 21 sen). Being a smallcap stock, Multico could potentially command a PE of 6 times- giving it a potential target price of RM1.26.
Technical Outlook
After a long bottoming phase, Multico signaled its return by breaking above its strong horizontal resistance at RM0.60 in April. However, the stock did not go very far. After making a high of RM0.68, the stock dropped back. In late September, Multico surpassed the April high of RM0.68. This looks like a Cup-with-handle formation with the breakout at RM0.68. If this reading is correct, the stock could continue to rise & test the next horizontal resistance at RM1.00.
Chart 2: Multico's weekly chart as at Oct 5, 2010 (Source: Quickcharts)
Conclusion
Based on strong financial performance & position, undemanding valuation & positive technical outlook, Multico couls be a good stock for medium-term investment.
Tuesday, October 05, 2010
AWC- a cheap smallcap
Background
AWC Berhad (“AWC”) is involved in the provision of engineering services and integrated facilities management solutions in Malaysia, and rapidly expanding in Singapore and the Middle East. Its four core businesses are:
- Facilities – provides “one stop” integrated facilities management services to building owners.
- Engineering – leader in Building Automation System and specializes in heating, ventilation and air conditioning control systems (HVAC), hydronic balancing system and industrial cooling system.
- Technology – provides turnkey research & development for micro electronic software products, consumer electronics products and security related products.
- Environment – Proprietary brand STREAM, uses the breakthrough automated pneumatic vacuum technology for waste collection.
Yesterday, AWC announced a capital reduction scheme which was intended to wipe out its accumulated losses of RM45.8 million as at 30/6/2009 (or RM43.9 million as at 30/6/2010). The scheme involves the cancellation of RM0.20 from the par value of each ordinary share of RM0.50. Upon completion of the scheme, the outstanding shares will remain unchanged at about 228.679 million units, each with a par value of RM0.30.
The accumulated losses arose when AWC took over an ailing listed company, Trans Capital Holdings Bhd ('TCHB') in 2003. That was part of a restructuring exercise & from here, AWC ended up with TCHB's accumulated losses of RM80 million as at 30/6/2003 (which was slowly reduced to RM43.9 million as at 30/6/2010).
The proposed capital reduction scheme is nothing more than an accounting exercise to clear out a unpleasant blot from its Balance Sheet.
Recent Financial Results
AWC's net profit increased by 33% q-o-q to RM3.2 million on the back of a 29.5%-increase in turnover to RM66.7 million. Compared to the previous corresponding quarter (QE30/6/2009), AWC's net profit dropped by 26.1% despite an increase of 70.0% in its turnover. The seesaw movement in its top-line & bottom-line is due to a sharp drop in the company's profit margin due to increased sales from lower margin businesses.
Table: AWC's last 8 quarterly results
Chart 1: AWC's 8 quarterly results
Financial Position
AWC's financial position is very healthy with current ratio of 2 times & gearing ratio of 0.09 time as at 30/6/2010. Its cash balance stood at RM49 million or RM0.21 per share!
Valuation
Based on its close of RM0.23 yesterday, AWC is trading at a PE of 4 times (based on last 4 quarters' EPS of 5.72 sen). At this multiple, AWC is deemed quite attractive. As a smallcap, AWC could command a PE multiple of 6 times.
Technical Outlook
Over the past 2 years, AWC has risen from a low of RM0.06 to a high of RM0.36. The stock is still in a downtrend, where the price movement can be fitted into a 3-fan trend line. An upside breakout above the RM0.30 could be the start of an uptrend for this stock. The horizontal support levels are at RM0.20 & RM0.23 while horizontal resistance levels are at RM0.33 & RM0.36.
Chart 2: AWC's weekly chart as at Oct 4, 2010_plotted on log scale (Source: Tradesignum)
Conclusion
AWC is a relatively cheap smallcap, which was unfairly knocked down by the announcement of a capital reduction scheme yesterday. I view this scheme as nothing more than a housekeeping exercise to clear out a blot in its Balance Sheet. The sharp drop in the share price could be an opportunity to get into the stock as a lower price.
Monday, October 04, 2010
CIMBX25- an excellent proxy to ride the Chinese Dragon
One way to bet on Chinese equity is to construct a portfolio of top Chinese companies. If you do not have the resources to do, you can just buy CIMB FTSE Xinhua 25. This exchange traded fund (ETF) is constructed to mirror FTSE Xinhua 25 index, which is an index comprising the top 25 Chinese companies that are listed on the Stock Exchange of Hong Kong (go here).
From Chart 1, you can see that FTSE Xinhua 25 (FXI) has been consolidating for the past 15 months & is poised for an upswing.
Chart 1: FXI's weekly chart as at Sept 27, 2010 (Source: Yahoo Finance)
Chart 2 below shows the price chart of CIMBX25. An upside breakout above RM1.05 could be the start of an uptrend in CIMBX25.
Chart 2: CIMBX25's daily chart as at Oct 4, 2010 (Source: Tradesignum)
I believe CIMBX25 is a good long-term investment in Chinese equity. You may accumulate this ETF today and buy more aggressively once it breaks above the RM1.05 level.