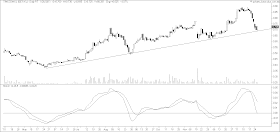
Results Update
Guiness Anchor Bhd ('GAB') has just announced its results for QE31/12/2010. Its net profit increased by 67% q-o-q or 48% y-o-y to RM64.6 million while turnover increased by 15% qo-q or 11% y-o-y to RM421 million. GAB attributed its good results to higher turnover due to earlier CNY for 2011 & write-back of some costs.
Table: GAB's last 8 quarterly results
From Chart 1 below, we can see that GAB's top-line is in a gradual uptrend over the past 20 quarters. Its bottom-line has finally broken above the RM50 million mark!
Chart 1: GAB's last 20 quarterly results
Valuation
GAB (closed at RM9.63 on Jan 28) is now trading at a trailing PE of 15.8 times (based on last 4 quarters' EPS of 61 sen). Its dividend yield is fairly reasonable at 4.7%. Based on the present PE multiple, GAB is trading near its fair value. If the top-line & bottom-line growth momentum can persist, the stock could potentially command a PE multiple of 17-18 times. Thus, the maximum upside for GAB is about 10%.
Technical Outlook
GAB has corrected over the past 2 weeks after recorded a new all-time high of RM11.00. It nearly tested its medium-term uptrend line support of RM9.40. This would be a good first entry to this stock.
Chart 2: GAB's daily chart as at Jan 28, 2010 (Source: Tradesignum)
From Chart 3, we can see GAB's sharp rally since May 2010, where it rose from RM7.00 to the all-time high of RM11.00. The stock needs to consolidate this huge gain. This consolidation would begin if the medium-term uptrend line has been violated. If that were to happen, one can expect GAB to enter into a sideway trading- similar to the period from December 2009 to May 2010. As such, we should not take too large a position in this stock.
Chart 2: GAB's weekly chart as at Jan 24, 2010 (Source: Tradesignum)
Conclusion
Based on technical consideration, GAB could be a trading BUY at its medium-term uptrend line support of RM9.40. Its steady financial performance could continue and this may lead to the stock trading at higher PE multiple. However, after a sharp run-up, the stock needs to consolidate its gain and this may happen if the stock failed to hold about the medium-term uptrend line support of RM9.40.
This is a personal weblog, reflecting my personal views and not the views of anyone or any organization, which I may be affiliated to. All information provided here, including recommendations (if any), should be treated for informational purposes only. The author should not be held liable for any informational errors, incompleteness, or delays, or for any actions taken in reliance on information contained herein.
Monday, January 31, 2011
Thursday, January 27, 2011
Latexx has broken above its downtrend line
Latexx will announce its results for QE31/12/2010 in early February. In line with poorer results recorded by other rubber glove producers, Latex is expected to annonuce a similar decline in its bottom-line. I have appended below Latexx's last 8 quarterly results in the table as well as its last 9 quarterly results in graph.
Table: Latexx's last 8 quarterly results
Chart 1: Latexx's 9 quarterly results
Despite the expectation of poorer results & the generally cautious market sentiment just ahead of the lunar new year break, Latexx has rallied strongly & broke above its downtrend line at RM2.75 today. As at 4.00pm, Latexx was trading at RM2.78- a gain of 20 sen over its closing price yesterday. This rally is unexpected & would definitely bear watching. Is the company about to announce a better than expected results? Or, is it about to announce an exciting corporate exercise?
For those who are nimble, Latexx could be a trading BUY. Its next resistance is at the psychological RM3.00 level & thereafter at the horizontal line at RM3.20.
Chart 2: Latexx's daily chart as at Jan 27, 2011_3.00pm (Source: Quickcharts)
Note: This is strictly a trading call based on technical consideration. I still maintain a bearish view for the rubber glove sector due to the unfavorable supply & demand dynamics; rising latex prices & unfavorable forex movement.
Wednesday, January 26, 2011
A few stocks for your consideration
I have appended below a few stocks that could be good trading buy. This is not an exhaustive list as there are other stocks which are equally as good buy.
Chart: Genting's daily chart as at Jan 26, 2011_2.45pm (Source: Quickcharts)
Chart: Gamuda's daily chart as at Jan 26, 2011_2.45pm (Source: Quickcharts)
Chart: Airasia's daily chart as at Jan 26, 2011_2.45pm (Source: Quickcharts)
Chart: Timecom's daily chart as at Jan 26, 2011_2.45pm (Source: Quickcharts)
Market Outlook as at January 26, 2011
FBM-KLCI broke below the medium-term uptrend line at 1533 as well as the horizontal line at 1530 yesterday. The next support will be the psychological level of 1500 & thereafter the strong horizontal support of 1475. However, we have to be careful when applying technical analysis in extreme market condition. The market is awash with sellers who positioned wrongly for a lunar new year rally that fizzled out. The long holiday break next week saw the drying out of buyers which resulted in a market squeeze. We saw the effect of this squeeze when the index plummeted by 21 points to hit a low of 1505 this morning. If the index can recover today or over the next 1 or 2 days back above the uptrend line (say 1533), then no harm is done to the market. However a failure to do so could be quite bearish. For those holding a contrarian (bullish) view, the present market squeeze could be a buying opportunity.
Chart: FBM-KLCI's daily chart as at Jan 18, 2011_12.00am (Source: Quickcharts)
Saturday, January 22, 2011
Market Outlook as at Jan 24, 2011
Our market corrected back very sharply on Friday. FBM-KLCI closed at 1547, slightly below the psychological level of 1550 & the 20-day SMA line at 1549. I expect the bearish sentiment to continue next week & the index may test the medium-term uptrend line support cum horizontal line support at 1530. The market should hold or rebound from that support.
Chart 1: FBM-KLCI's daily chart as at Jan 21, 2011 (Source: Tradesignum)
The current bull rally is however very extended. As noted before, this bull run is running against the clock as it is 22 months old. This makes it the longest bull run in the past 18 years. In fact, if you were to look at the monthly chart below, you would see that the index normally trades within the Bollinger Band. There have been 4 occasions where the index penetrated above or below the Bollinger Band & a swift retracement ensued. These 4 occasions are marked out as A to D below. The FBM-KLCI tested the Bollinger Band earlier this month, without breaking above it. As such, a sharp retracement is not a highly probable event though one cannot rule it out completely.
Chart 2: FBM-KLCI's monthly chart as at Jan 3, 2011 (Source: Tradesignum)
One can be more confident to say that the upside of the market is quite limited. If the market can rebound from the 1530 support level (as noted above), then rotational plays could continue. Contrary to popular belief, we are more likely to be at the tail end of a bull market than at the start of a bull market. However, we have yet to see the start of the bear market & as such, we would remain in the market to take advantage of any trading opportunity that presents itself. This is a trading market but you must also be fairly swift to take profit from any trade that you have entered into. If the trade goes wrong or goes no where, you need to close off the position swiftly. Having an over-sized exposure to equity at the tail end of a bull market is not a wise thing to do. Good luck.
Tuesday, January 18, 2011
Market Outlook as at January 18, 2011
In the last few days, I was busy in the market & didn't post anything other than the possible correction for CPO (here). I was also not sure of the market direction. A few of the stocks that I have recommended did quite well initially but they subsequently dropped back to the breakout level. Many stocks jumped sharply on breakout & then faded away. Since Jan 1, I noticed the following:
1. Blue chips jumped sharply on Jan 5 & dropped back (eg. CIMB, Maybank, PBBank, Sime).
2. Plantation stocks hit a high on Jan 4 & have been sliding ever since.
3. Oil & Gas stocks ran up steadily & corrected sharply on Jan 13.
4. Property stocks hit a high on Jan 13 & 14 and are now sliding off.
This rotational play for stocks & sectors are not uncommon but what's disturbing is that these stocks have dropped back to their breakout level in many cases. Further decline would lead to the build-up of a pool of stale bulls. In addition, the huge volume traded in the past 2 weeks has created a large stock overhang. Finally, we are two weeks away from the lunar new year, which is a very short trading week with only 2 trading days (on Monday, Jan 31 & Wed, Feb 2). The shortened trading week caused traders to reduce their open position & the prevailing stock overhang can only be cleared at lower prices. All these point to a weaker market for the next 2 weeks.
Chartwise, FBM-KLCI should have good support at the 20-day SMA line at 1550. Below this support, we can see very strong support at the horizontal line of 1524 which coincides with the uptrend line support at 1525.
Chart: FBM-KLCI's daily chart as at Jan 18, 2011_12.00am (Source: Quickcharts)
Tuesday, January 11, 2011
CPO may test its uptrend line support at RM3650
Since its breakout above its "horizontal" resistance ('RR') at RM2800 in October 2009, CPO has rallied very well. A few days ago, it touched the RM3900 mark before entering into a minor correction. Looking at the daily chart (Chart 1) below, we can see that CPO may find support at the 20-day SMA line at RM3750 or its accelerated uptrend line at RM3650. With the MACD indicator showing bearish divergence, CPO is looking toppish and a break of the aforesaid support could trigger a consolidation of a few weeks before the rally can continue.
Chart 1: CPO's daily chart as at Jan 10, 2011 (Source: ifs.marketcenter.com)
I have also appended below the weekly chart for CPO (Chart 2) and the daily chart for Plantation index (Chart 3). If CPO were to break below the RM3750 and/or the RM3650 level (as mentioned above), then Plantation index may correct back to its uptrend line support at 7500. However, this negative scenario (which may not pan out) does not spell the end of the end of the rally in CPO. After a short correction or a consolidation of a few weeks, CPO may re-test the RM3900 level again. However, if CPO were to break below the RM3650 level, it is advisable to take some profit on your investment in the Plantation sector.
Chart 2: CPO's weekly chart as at Jan 10, 2011 (Source: ifs.marketcenter.com)
Chart 3: Plantation's daily chart as at Jan 10, 2011 (Source: Quickcharts)
Friday, January 07, 2011
Notion- the recovery may begin
Notion may have completed its bottoming phase between RM1.55 & RM1.80 when it gained 13 sen to close at RM1.83 at the end of the morning session. With this breakout, Notion's recovery could commence. Its next horizontal resistance is at RM1.85 & then at RM2.00. (At the time of posting, Notion has already broken above the RM1.85 resistance).
With this breakout, Notion could be either a trading BUY or a medium-term investment.
Chart 1: Notion's daily chart as at Jan 7, 2011_12.30pm (Source: Quickcharts)
Chart 2: Notion's weekly chart as at Jan 7, 2011_12.30pm (Source: Quickcharts)
With this breakout, Notion could be either a trading BUY or a medium-term investment.
Chart 1: Notion's daily chart as at Jan 7, 2011_12.30pm (Source: Quickcharts)
Chart 2: Notion's weekly chart as at Jan 7, 2011_12.30pm (Source: Quickcharts)
3A & Cocolnd- may have bullish breakout
3A has just broken above its medium-term downtrend line at RM1.70-1.72. Its immediate horizontal resistance is at RM1.90 & then at RM2.00.
Chart 1: 3A's weekly chart as at Jan 7, 2011_9.40am (Source: Quickcharts)
Another stock which had broken above its medium-term downtrend line earlier was Cocolnd. This stock broke above the downtrend line at RM2.55 on January 5. Currently trading at RM2.79, Cocolnd's immediate horizontal resistance is RM2.95 & then at RM3.10.
Chart 2: Cocolnd's weekly chart as at Jan 7, 2011_9.40am (Source: Quickcharts)
Based on upside breakout of their respective medium-term downtrend line, 3A & Cocolnd are good trading BUYs.
Thursday, January 06, 2011
Citigroup has broken above its triangle at USD4.80
For those who set their sight far & wide, you may take a look at Citigroup, which has just broken above its symmetrical triangle at USD4.80. I do not have a target for this stock but I believe the long-term prospect of Citigroup is fairly good. For a closer look at how far this stock has dropped since its heydays, go to Yahoo Finance (here).
Chart: Citigroup's daily cahrt as at Jan 5, 2011 (Source: Stockcharts)
KimLun may have a bullish breakout
KimLun is a newly listed construction company specializing in infrastructure and building construction, project management, industrial building systems (IBS) and manufacture of pre-cast concrete products. It reported an EPS of about 11-12 sen per quarter.
From the chart below, we can see that KimLun has broken above the horizontal resistance of RM1.70. Its likely target is RM2.00.
Chart: KimLun's daily chart as at Jan 6, 2011 (Source: Quickcharts)
Based on bullish technical breakout, KimLun could be a trading BUY.
From the chart below, we can see that KimLun has broken above the horizontal resistance of RM1.70. Its likely target is RM2.00.
Chart: KimLun's daily chart as at Jan 6, 2011 (Source: Quickcharts)
Based on bullish technical breakout, KimLun could be a trading BUY.
Puncak- a safe stock for medium-term investment
Our market is so hot that if we are not careful, we could end up buying too many stocks that are trading at all-time high. On that count, I am also guilty for highlighting the bullish breakout of UEMLand which was trading at a new high.
Below I have appended the chart of a boring stock, Puncak which has the tendency to trade in a range between RM2.30 & RM3.00. There are many research reports that value this stock at prices between RM3.50 & RM4.00. One such report is a MIDF Research report dated August 27, 2010 which valued the company at RM3.55 [or at a discount of 30% to its Net Present Value]. While the report is a bit outdated, I believe the value of an on-going concession is fairly transparent & it won't change very much despite the tough political problem in the state of Selangor.
Chart: Puncak's weekly chart as at Jan 6, 2011_3.00pm (Source: Quickcharts)
Based on cheap valuation & good technical support, Puncak could be a good stock for medium-term investment.
UEMLand may have a bullish breakout
UEMLand has just broken above the neckline at RM2.68-2.70 of an inverted head-&-shoulder ('HS') formation. An upside breakout of the inverted HS formation would signal the continuation of the prior uptrend. If we measure the distance of the 'head' (RM2.60 -RM2.10) to the neckline & add that distance to the breakout level (RM2.70), we can arrive at a target of RM3.20 for the current rally.
Based on the above, UEMland could be a trading BUY.
Chart: UEMland's daily chart as at Jan 6, 2011_10.00am (Source: Quickcharts)
Based on the above, UEMland could be a trading BUY.
Chart: UEMland's daily chart as at Jan 6, 2011_10.00am (Source: Quickcharts)
Wednesday, January 05, 2011
MEGB broke above the resistance of RM2.24
In the euphoric market today, one stock which has done very well is MEGB. It gained 15 sen to close at RM2.28. A close look at the 60-min chart & the daily chart below will show that the stock may have completed its bottoming phase when it managed to break above the trading range of RM2.03 & RM2.24. It should be noted that this positive breakout was accompanied by sharply higher volume. If the stock does not fall below the RM2.24 level over the next few days, we may see the beginning of a recovery for MEGB. It could be a trading BUY.
Chart 1: MEGB's 60-minute chart as at Jan 5, 2011_4.45pm (Source: Quickcharts)
Chart 2: MEGB's daily chart as at Jan 4, 2011 (Source: Tradesignum)
Chart 1: MEGB's 60-minute chart as at Jan 5, 2011_4.45pm (Source: Quickcharts)
Chart 2: MEGB's daily chart as at Jan 4, 2011 (Source: Tradesignum)
FBM-KLCI getting ready for lunar new year party
On Jan 3, FBM-KLCI broke above its recent all-time high of 1531.99 (recorded on Nov 11 last year). This followed an earlier breakout for FBM-Emas, which occurred on Dec 29 last year. See Chart 1 & 2 below.
Chart 1: FBM-KLCI's daily chart as at Jan 4, 2011 (Source: Quickcharts)
Chart 2: FBM-EMAS's daily chart as at Jan 4, 2011 (Source: Quickcharts)
The upside breakout of the two main barometers of our stock market also reflect the strengthening of the ringgit. From Chart 3 below, we can see that the USD-RM cross rate has again curved down. Due to technical problem, I have only attached the basic chart which does not give a very clear picture. Go to the interactive chart [here] and see how the 20 & 50-day SMA lines have crossed downward. Since Mar 2009, there have been 4 occasions when this has happened- Sept 2009, Mar 2010, Jul 2010 & now. In the previous 3 occasions when this happened, our stock market has a good rally. This means that our market could be heading into a lunar new year rally.
Chart 3: USD-RM exchange rate as at Jan 4, 2011 (Source: Yahoo Finance)
Chart 4: FBM-KLCI's daily chart as at Jan 4, 2011 (Source: Tradesignum)
Tuesday, January 04, 2011
BJCorp may have a bullish breakout
BJCorp has just broken above its strong horizontal line at RM1.14-1.15. This breakout could signal the start of the upleg for the stock. Its next horizontal resistance is at RM1.30 & then at RM1.45. With this upside breakout, BJCorp could be a trading BUY.
Chart: BJCorp's daily chart as at Jan 4, 2011_3.30am (Source: Quickcharts)
For those with a more aggressive appetite, you may try BJCorp-JB, which is a CBLC currently trading at a premium of 1% & expiring in May.
Table: BJCorp's CWs & CBLC valuation & terms
Chart: BJCorp's daily chart as at Jan 4, 2011_3.30am (Source: Quickcharts)
For those with a more aggressive appetite, you may try BJCorp-JB, which is a CBLC currently trading at a premium of 1% & expiring in May.
Table: BJCorp's CWs & CBLC valuation & terms
IOI may have a bullish breakout
This morning, IOI broke above its horizontal line RM6.00 and went to an intra-day high of RM6.16 before correction set in. This means that IOI nearly tested the line connecting its recent peaks (RR) at RM6.20. If IOI does not drop below the RM6.00 resistance-turned-support, there is a good chance that the stock will retest the RR resistance at RM6.20 & then the next horizontal resistance at RM7.00. As such, IOI could be a trading BUY.
Chart: IOI's weekly chart as at Jan 4, 2011_10.10am (Source: Quickcharts)
For those with a more aggressive appetite, you may try any one of the CWs or the CBLC listed below, except IOI-CQ. The premium of 4-6% for these instruments are fairly reasonable.
Table: IOI's CWs & CBLC valuation & terms
Chart: IOI's weekly chart as at Jan 4, 2011_10.10am (Source: Quickcharts)
For those with a more aggressive appetite, you may try any one of the CWs or the CBLC listed below, except IOI-CQ. The premium of 4-6% for these instruments are fairly reasonable.
Table: IOI's CWs & CBLC valuation & terms
Sime may have a bullish breakout
Sime has just broken above its strong horizontal line at RM9.00. Its next horizontal resistance is at RM10.00 & then at RM10.50. Based on this breakout, Sime could be a good trading BUY.
Chart: Sime's weekly chart as at Jan 4, 2011_9.30am (Source: Quickcharts)
For those with a more aggressive appetite, you may try Sime-CH or Sime-CJ or Sime-JA. However, the tenor for Sime-CH & Sime-CJ is rather short as they are due to expire in February. The better instrument for an aggressive play on Sime's bullish breakout would be Sime-JA, which is a Callable Bull Certificate (or 'CBLC'). As mentined previously, CBLC is very similar to a Call Warrant (or 'CW') except it has the added feature of having a Mandatory Call Event ('MCE') which automatically forces the issuer to recall the CBLC when it hit a Minimum Trading Price ('MTP') (for more, go here). At a premium of 1.2%, Sime-JA is deemed fairly attractive.
Table: Sime's CWs & CBLC valuation & terms
Monday, January 03, 2011
IJMLand & MRCB's proposed merger aborted
Last week we saw the sudden selldown for IJMland & IJM. Subsequently these stocks & MRCB were suspended and a short announcement was made that IJMland & MRCB's proposed merger was aborted as the parties were unable to come to a definitive agreement. Like many analysts, I do not believe this development would be medium or long-term negative to any of these companies. However, the share prices of all these companies would see some selling pressure over the next few days. If the critical supports are not violated, this could be a buying opportunity.
1. IJMland
The strong supports are the horizontal lines at RM2.65 (tested last Friday) & RM2.45. It is critical that IJMland must not break below the 3rd fan trendline support at RM2.55. A break of this trendline could result in a reversal of the prior uptrend.
Chart 1: IJMland's weekly cahrt as at Dec 30, 2010 (Source: Quickcharts)
2. MRCB
It has a strong support at the horizontal line cum uptrend line support at RM1.80.
Chart 2: MRCB's weekly cahrt as at Dec 30, 2010 (Source: Quickcharts)
3. IJM
Its strong strong is at the horizontal line RM5.70 & the uptrend line support at RM5.40.
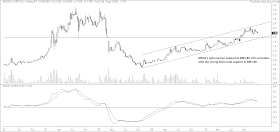
Chart 3: IJM's weekly cahrt as at Dec 30, 2010 (Source: Quickcharts)
I foresee the trading of these 3 stocks to be very volatile today & if you are interested to get into these stocks for whatever purpose, do exercise your discretion.
1. IJMland
The strong supports are the horizontal lines at RM2.65 (tested last Friday) & RM2.45. It is critical that IJMland must not break below the 3rd fan trendline support at RM2.55. A break of this trendline could result in a reversal of the prior uptrend.
Chart 1: IJMland's weekly cahrt as at Dec 30, 2010 (Source: Quickcharts)
2. MRCB
It has a strong support at the horizontal line cum uptrend line support at RM1.80.
Chart 2: MRCB's weekly cahrt as at Dec 30, 2010 (Source: Quickcharts)
3. IJM
Its strong strong is at the horizontal line RM5.70 & the uptrend line support at RM5.40.
Chart 3: IJM's weekly cahrt as at Dec 30, 2010 (Source: Quickcharts)
I foresee the trading of these 3 stocks to be very volatile today & if you are interested to get into these stocks for whatever purpose, do exercise your discretion.