Monday, February 28, 2011

Barry Ritholtz's 2006 interview with Paul Desmond

I re-read Barry Ritholtz's interview of Paul Desmond, the President of Lowry's Reports which was conducted in 2006. Widely regarded as a "technician's technician", Paul Desmond won the Charles H. Dow Award in 2002 for excellence in the field of technical analysis for his studies on how market bottoms are formed. I remembered reading that interview in 2006 & I became very cautious in the market back then. On hindsight, we can all say that Paul was two years too early in his call for a top in the market, which eventually came in 2008. Nevertheless, the interview contains some very interesting insights to market behavior at major tops or bottoms. I like to pick out a few Q&As for those who have no time for the full interview, which I strongly recommend.

Barry: .... Tops are really processes, while bottoms are a specific point?

Paul: At market bottoms, you have a completely different pattern in which the dominate emotion is fear and panic. And what we found at market bottoms, for example, was that in a typical major market bottom, you see a series of 90% downside days, 90% of all the volume, 90% of all the price changes are on the downside. Now the interesting thing that we found was that you can have a whole series of 90% downside days. During the 1973 and 1974 bear market, there were 15 90% downside days.

Barry: We talked a little bit about breadth and we talked about how a top is a process, unlike the bottom being more or less a point. If investors are a little concerned, what should they specifically be looking for in order to see signs of a market top?

Paul: Well, if we were in the fall foliage season prior to winter, what we would tend to see in the trees up north, we’d start to see leaves dropping off the tree one at a time. And the stock market is very, very similar, that as you get into the latter stages of a bull market, individual stocks tend to peak out and begin to drop into their own individual bear markets, while there are still a lot of stocks continuing to advance.

As the bull market becomes more and more mature, a greater number of individual stocks tend to fall off the trees, so to speak, and drift to the ground, whereas the investment community is not watching the leaves, they are watching the indexes. They say, ‘gee, the Dow Jones Industrial Average has made a new high today.’
The interview actually started with a quick recap of what happened on the run-up to the Black October crash of 1987.

Barry: I'm looking at a chart of October '87, and the Dow was about 2700 in the beginning of the month. Before we even got to that Wednesday (the 13th), the Dow was down to 2500. The volume really started ticking up on that 13th, 14th, 15th. The 19th and 20th were both the biggest-volume days of the selloff.

Paul: That's right. Actually, the interesting thing about 1987 is that most people incorrectly say 'it just came out of nowhere.' That the market was going up one day and suddenly crashed. And yet, we had a whole series of classic warning signs that the market was weakening. For example, the advance/decline line, which is a simple measurement of the number of stocks going up vs. the number of stocks going down, topped out in early April of 1987, showing that that was the point in which the largest bulk of stocks was starting to peak in price.

I re-read the interview because I want to cross check what's happening in our market with what Paul had observed in his studies. I can see signs of a topping process in progress in our market for the past few weeks. Like Paul's call in 2006, we would never be able to pinpoint exactly when the whole market comes undone. But, the signs are there.

If you like to read the entire 2-part interview, go here & here.

Inflation! Inflation! Inflation!

Over the past few weeks, geopolitical risks have heightened due to unrest in a few states in the Middle Easter & North Africa (MENA). This has resulted in a sharp drop in many stock markets which were weakened earlier by concern about inflation. With crude oil prices trading at or above USD100 per barrel, economists are worried that the nascent global economic recovery may be seriously harmed. See Chart 1 below.


Chart 1: Brent's daily chart as at Feb 25, 2011 (Source: WTRG)

How should we treat the geopolitical problem in the MENA states? Since 2008, investors have been buffeted by one catastrophe after another. First, we were hit by the near collapse of Wall Street due to the sub-prime problem. Next, we were hit by the sharp drop in the value of the Euro due to the financial crises among the PIIGS states (which are still unresolved). Finally, we are hit by the multiple collapse in North African states that is now threatening to spill over to the oil-exporting Middle East. Is this another buying opportunity, disguised as a near-death scenario or is this the real deal- the final straw that will break the camel's back? We won't know.

What we do know is that the market is technically very precarious. Let's list them down:
1) This bull run is approaching its 2nd anniversary- something that I have not seen in my 17 years in the Malaysian stock market.
2) FBM-KLCI may have broken below its long-term uptrend line while FBM-Emas is testing its uptrend line.
3) The FBM-KLCI dropped below its 30-week SMA line at 1477 today before recovering. FBM-Emas came very close to its 30-week SMA line at 10077. I would consider these levels as the last line of defense for the market.
4) Indicators, such as RSI & Williams' %R, are very bearish.


Chart 2: FBM-KLCI's weekly chart as at Feb 25, 2011 (Source: Quickcharts)


Chart 3: FBM-Emas's weekly chart as at Feb 25, 2011 (Source: Quickcharts)

Other things to note are the poor market action, such as the breakdown among the top blue chips such as CIMB & Genting. In addition, we may see consistently large number of losers in the market, even in days when FBM-KLCI was up or unchanged. The narrow breadth in the market is a sign of a topping out process.

Finally, we can see that inflation is getting from bad to worse in this country. This morning, we saw the headline "Professionals and top execs set for huge increments". Last week, it was "Legal fees hike driven by market forces, says Bar Council". How many more such headlines would we see before the Government would launch an all-out anti-inflation drive which may include raising interest rate or SRR aggressively? And, if you think you are having it bad, think about the lower income group whose wages can hardly match the inflation rate. To add insult to injury, they will suffer even more due to the withdrawal of subsidies across the board resulting in higher food prices as well as higher energy costs. [Note: The increased cost of living coupled with high unemployment rate were the main drivers that brought the Tunisians & the Egyptians to the streets. If my reading is correct, we won't see the same intensity in the crowd in Bahrain or any of the rich Gulf states because they are way too pampered to put their lives on the line. ]

Based on the above, we should remain under-weight the market. While buying opportunities may be present, we should exercise careful discretion & avoid over-exposure or over-trading.

Friday, February 25, 2011

MSC- never-ending write-off


Results Update

MSC reported a very disappointing set of results for QE31/12/2010. It continued to incur losses due to huge impairment provision for its investment in mining assets. This provision is unexpected given the current bullish commodities cycle. As a results of a net loss & provision made totaling RM32.8 million, MSC incurred a pre-tax loss of RM24 million for QE31/12/2010. For more, see Note 5. Unusual Items of the Notes to the Accounts.


Table: MSC's last 8 quarterly results


Chart 1: MSC's last 20 quarterly results

As a result of these losses (a legacy of a more profligate investment climate in 2008), MSC's share price has failed to benefit from the recent sharp run-up in the price of tin. (As an aside, you may want to compare the non-action in MSC to the sharp rally in Ho Wah Genting ('HWGB') on its purported venture into tin mining. One begins to wonder whether investors are being too optimistic about HWGB's future prospect if an experienced company like MSC can perform so badly in this business.)


Chart 2: Tin prices over the past 5 years (Source: LME)

Techncial Outlook

MSC broke its medium-term uptrend line supoort at RM4.55-4.60 in mid-February. Yesterday it broke the horizontal support at RM4.20. Its next support is at the horizontal line RM3.80.


Chart 3: MSC's daily chart as at Feb 25, 2011_12.30pm (Source: Quickcharts)

Conclusion

Based on poor financial performance & bearish technical outlook, MSC should be avoided. It is possible that this round of provisioning for impairment loss is the last one and the stock would slowly recover from hereon. Until you see a positive bottom-line & announcement of sale of its mining assets, MSC would continue to spring surprises on its shareholders.

TWS- another unbelievable quarter!

Results Update

TWS's net profit increased by 56% q-o-q or 153% y-o-y to RM193 million while its turnover increased by 14% q-o-q or 89% y-o-y to RM1.591 billion. The increase in net profit was mainly due to the favourable performance achieved by all three operating divisions, Rice, Sugar and Plantation.


Table: TWS's last 8 quarterly results


Chart 1: TWS's last 10 quarterly results

Valuation

TWS (closed at RM8.08 at the end of the morning session) is now trading at a PE of 4.9 times (based on its last 4 quarters' EPS of 165 sen). For a consumer stable stock (with plantation exposure) to trade at such low PE multiple is exceptional. I believe this stock could easily trade up to a PE multiple of 12-15 times. TWS has undoubtedly benefited from the favorable commodities prices. Would a reversal in the commodities prices result in smaller price margin? If we were assumed a sharp decline in earning of 50% (to 82 sen) & then conservatively value the stock at a PE of 12 times, its fair value would be about RM9.84!

Technical Outlook

Applying the same projection method used in the case of TChong, we can see that TWS's current rally might hit a price of RM15.00.


Chart 2: TWS's monthly chart as at Feb 2, 2011 (Source: Tradesignum)

Conclusion

Based on good financial performance, attractive valuation & bullish technical outlook, TWS is a good stock to invest for the long-term.

APM- time for some profit-taking

Results Update

For QE31/12/2010, APM's net profit dropped by 4.2% q-o-q but rose by 19.3% y-o-y to RM30 million while its turnover dropped marginally by 1.2% q-o-q but rose by 7.1% y-o-y to RM288 million. We can see that APM 's top-line & bottom-line have slid in the past 2 quarters. This is quite similar to what we saw in TChong over the same periods.


Table: APM's last 8 quarterly results


Chart 1: APM's last 11 quarterly results

Valuation

APM (closed at RM5.10 yesterday) is now trading at a PE of 8 times (based on last 4 quarters' EPS of 63.6 sen). At this PE multiple, APM is deemed fairly valued. I believe a fair PE multiple for auto stocks is about 6-10 times, depending on growth potential.

Technical Outlook
APM broke its accelerated uptrend line at RM5.45 in January. APM has good horizontal support at RM5.00 and thereafter it may test the uptrend line that started in July 2009 where the support si at RM4.30.


Chart 2: APM's weekly chart as at Feb 25, 2011 (Source: Quickcharts)

Conclusion

Based on deterioration in the technical outlook & financial performance, I think one should take some profit on this investment. A good level to sell would be about RM5.30-5.50. However, we do not have to be too aggressive in our selling as the stock is still fairly valued.

TChong's top-line slides further

Results Update

For QE31/12/2010, TChong's net profit increased by5.5% q-o-q or 21.9% y-o-y to RM52 million while its turnover dropped 4.1% q-o-q but increased by 16.0% y-o-y to RM835 million. From Chart 1 below, we can see that TChong's top-line & bottom-line have slid in the past 2 quarters. Is this an aberration or has the growth in the auto sector hit the wall?


Table: TChong's last 8 quarterly results


Chart 1: TChong's last 17 quarterly results

Valuation

TChong (closed at RM4.90 yesterday) is now trading at a PE of 14 times (based on last 4 quarters' EPS of 35 sen). At this PE multiple, TChong is deemed overvalued. I believe a fair PE multiple for auto stocks is about 8-12 times, depending on growth potential.

Technical Outlook

TChong broke its accelerated uptrend line at RM5.45-5.50 in October 2010. On Tuesday, it broke below its horizontal line at RM5.00. TChong may test its uptrend line that started in July 2009 where the support si at RM4.60-4.70. Check out my technical call to take profit on TChong issued in December (here).


Chart 2: TChong's weekly chart as at Feb 25, 2011 (Source: Quickcharts)

Conclusion

Based on unattractive valuation & bearish technical outlook, we should avoid TChong.

Thursday, February 24, 2011

IJM is testing its uptrend line support now.

IJM suffered a sharp fall early this morning. It tested its 8-month uptrend line support at RM5.80. See Chart 1. It may even test its 2-year uptrend line support at RM5.70 if this selldown persist. I do not have any information as to why the stock is being sold down.

Technically, IJM could be a good trading BUY at RM5.70-5.80 if the selling dried up & the stock may stage a rebound. However, in the current cautious market, one has to exercise our discretion in entering any trading position.


Chart 1: IJM's daily chart as at Feb 24, 2011_9.50am (Source: Quickcharts)


Chart 2: IJM's weekly chart as at Feb 24, 2011_9.50am (Source: Quickcharts)

Wednesday, February 23, 2011

Kulim- time to take profit

Kulim is one of the top performing stocks today. As at 3.00pm, it was trading at RM15.80 a- a gain of 54 sen over its close of RM15.26 yesterday. That's very good in the current depressed market. The reason for such stellar performance is because the stock is on the last cum date for a very handsome 1-for-2 share split cum 1-for-1 bonus issue cum 1-for-8 free warrant distribution. If you own one board lot of 100 shares today, you would see your shareholding growing to 400 shares overnight (plus 50 free warrants).

A few months ago, stocks with generous freebies enjoyed spectacular price run-up. Kulim had similarly benefited from this out-performance. One could also attribute the rally in Kulim over the past 4-5 months to the brouhaha surrounding its possible sale of indirect subsidiary, KFC as well as the good financial performance (from its plantation & fast foods divisions). However, there is no denying that the current rally which began on February 14 was due solely to the fixing of the last cum date for the aforesaid entitlement.


Chart: Kulim's daily chart as at Feb 23, 2011_3.00pm (Source: Quickcharts)

The big question is should you go through with this entitlement? My gut feeling is saying NO. All out-performance would eventually correct itself. Some call it 'reversion to the mean'. Whatever you may call it, the risk is very real. If in the past few days or weeks, you have been seeing a spectacular rise, you could be seeing the opposite after the entitlement date. Imagine a correction of 10-20 sen in the share price and then multiply that by 4. This correction may not happen overnight but it is likely to happen in the near future. After all, what is there to look forward to in Kulim? The KFC sale did not happen. The generous bonus issue cum share split would be a thing of the past. Finally, even CPO prices are sliding off. Based on all these factors, I think the shareholders of Kulim is better off taking profit today rather than going through with the entitlement.


Chart: CPO's weeky chart as at Feb 23, 2011 (source: ifs.marketcenter.com)

Tuesday, February 22, 2011

My take on Nexttrade postings!

One of my regular readers recently told me that he did not see anything interesting in my blog over the past few months. He asked why I did not make more buy calls given the bullishness in the market. I explained that I was not comfortable with the market but he told me that the name of my blog being 'nexttrade' should have plenty of recommendations on what to trade. I was lost for words.

However, this is not the first time that I hibernated when the market is too high for my liking. I was relatively quiet in the second half of 2007 when I felt that the market was too frothy. Then, an idea hit me. What if I were to tabulate the number of postings in my blog & compare it to FBM-KLCI. Would my sub-conscious feeling tell me something about the state of the market?

Before I give my 'analysis' of the chart below, I will readily admit that this is not a serious study. My postings is pretty subjective & it is governed by my market outlook & my ability to spot a change of price direction in the market & the stocks. Since I have never given any thoughts to a possible connection between market outlook & my postings until now, the element of subjectiveness is not excessive. I can't say the same for future usage of this study since I am now somewhat aware of this connection and the element of objectiveness is lost. Below, I have appended a composite chart of FBM-KLCI & the number of monthly postings from July 2007 until January 2011.


Chart: FBM-KLCI's weekly chart & Nexttrade's monthly postings (overlaid with 4-month WMA & the 10-month SMA).

These are my observations:
1) The number of postings jumped to 40-50 per months after the market has peaked or bottomed (see point 1, 2 & 3). These could be due to follow-up posting to re-inforce the new market direction.

2) The number of postings remained fairly high when the market is in an uptrend (after point 1 & 3) but the number of postings declined to a minimal level when the market is in a downtrend (after point 2). The higher number of posting in a bull market is quite normal & one would find very little to write in a bear market.

3) The number of postings hit a low before the market peaked (see point A). I must have been ahead of the market & called a top prematurely. The top came later at point A1. Is the same scenario playing out again at point C & C1?

4) I have also plotted the 4-month Weighted Moving Average (WMA) & 10-month Simple Moving Average (SMA). It is interesting to see that at point A1 & B when the 4-month WMA cut above the 10-month SMA, the market direction changed. Now, the 4-month WMA is poised to cut above the 10-month SMA again. If that were to happen, are we about to see a change in the market direction?

Before I end this post, I would remind everyone to take my above comments with a table spoon of salt!

Friday, February 18, 2011

MFlour- another great 'challenging' year (whatever)

Results Update

MFlour announced another great quarterly results for QE31/12/2010. Its net profit increased by 18% q-o-q or 47% y-o-y to RM28.5 million while turnover increased by 8% q-o-q or 39% y-o-y to RM459 million. The company attributed the improved performance to higher revenue & margins in the flour segment which offset the poorer performance of the feeds & poultry integration segments.


Table 1: MFlour's last 8 quarterly results


Chart 1: MFlour's 19 quarterly results

Valuation

MFlour (closed at RM5.24 at the end of the morning session) is now trading at a PE of 6.6 times (based on last 4 quarters' EPS of 79 sen). At this PE multiple, MFlour is deemed quite attractive.

Technical Outlook

MFlour is in an uptrend. This morning, it broke above the horizontal resistance at RM5.00. Its next horizontal resistance is at RM5.50. Below, I have combined the monthly chart of MFlour & its Return on Paid-up Capital. We can clearly see that MFlour's share price movement in line with its Return on Paid-up Capital. Will MFlour be able to maintain its good performance for FY2011?


Chart 2: MFlour's monthly chart as at Feb 2, 2011 (Source: Tradesignum)

Other Comments


MFlour “envisaged 2011 to be another challenging year with volatile grain and fuel prices as well as ocean freight and foreign exchange rates” (see Note 16 of its detailed financial statements for QE31/12/2010). This is nearly identical to the comments made in the preceding year: “In spite of the expected global recovery, the Board envisage 2010 would be another challenging year where commodity prices, fuel, ocean freight and foreign exchange rates are expected to remain volatile” (
see Note 17 of detailed financial statements for QE31/12/2009). Can the company be a bit more helpful in its guidance? I mean, you made an EPS of 79 sen for FY2010 & you called that a challenging year! How would a normal year looks like, let alone a great year?


Table 2: MFlour's Key Financial Statistics from 1994 to 2010

Conclusion

Based on the good financial performance & cheap valuation, I would continue to rate MFlour a good investment stock. Buy on weakness.

CPO likely to drift lower

Since July 2010, CPO has been in an uptrend. That uptrend line accelerated when it broke above the horizontal line at RM2800. From a gradual uptrend line 1, CPO prices rallied into steeper & steeper uptrend lines (2, 3 & 4) until it became unsustainable & faltered in late December last year. Its subsequent rebound in January made a new rally high but on thin volume. This rebound has since ended and CPO is now testing the support of the uptrend line 3. With Parabolic SAR moving above CPO prices, a SELL signal has been generated. You may also notice that the MACD indicator is poised to hook down.


Chart: CPO's weeky chart as at Feb 17, 2011 (source: ifs.marketcenter.com)

Based on the negative technical outlook for CPO, we should reduce our position in the Plantation sector.

Tuesday, February 15, 2011

Supermx's bottom-line slipped again

Results Update

Supermx has just announced its results for 4Q2010 ended 31/12/2010. Its net profit for QE31/12/2010 dropped 14% q-o-q or 26% y-o-y to RM32.7 million while turnover was marginally lower q-o-q but still grew by 18.5% y-o-y to RM233 million. The drop in its net profit was attributable to higher latex cost & weakening US dollar. See the table below & Chart 1 & 2 for the movement in Supermx's top-line & bottom-line as well as the decline in its profit margin over the past 3 quarters.


Table: Supermx's last 8 quarterly results


Chart 1: Supermx's last 17 quarterly results


Chart 2: Supermx's profit margin for the last 17 quarterly results

Valuation

Supermx (closed at RM4.25 yesterday) is now trading at a PE of 8.5 times (based on last 4 quarters' EPS of 50 sen). At this PE multiple, Supermx is deemed fairly attractive.

Technical Outlook

Supermx peaked at RM6.60 in July 2010. After a short decline, its price movement over the past 4 months is trapped within a symmetrical triangle, with support & resistance presently at RM4.10 & RM4.70. Given the continued slide in its bottom-line, we are likely to see a test of the RM4.10 support on Wednesday (when the market re-opened). A break below this support could send the share price to the horizontal support at RM3.70 or even RM3.25. However, the attractive valuation of the stock should give investors some incentive to slowly nibble into the stock. I believe the stock would be well-supported at RM4.00-4.10. A momentary drop to RM3.70 is possible & that could be a good entry level for the stock for now.


Chart 3: Supermx's daily chart as at Feb 14, 2010 (Source: Tradesignum)

Conclusion


Despite the continued slide in its bottom-line, I would rate Supermx as a HOLD due to its fairly attractively valuation.

Market Outlook as at February 14, 2011

As noted previously, the uptrend line of FBM-KLCI was violated recently. The operating uptrend line that was recently violated is depicted below as uptrend line 3. Why did I number it uptrend line 3? I did so for the following reasons:
1) it was the third most sustainable uptrend line to-date: and
2) it could be the 3rd fan line within the context of a 3-fan trend line pattern.
Since the current bull rally started in March 2009, 3 sustainable uptrend lines can be seen to have operated. A sustainable uptrend line is one which has provided some support when the price or index is above the line & some resistance when the price or index is below the line.

If we look at uptrend line 1, it was tested 4 times as a support & twice as a resistance. Uptrend line 2 was tested thrice as a support & once as a resistance. Uptrend line 3 was tested 5 times as a support & once as a resistance. I have also drawn a fourth uptrend line which I have denoted as uptrend line 2a, which was tested twice as a support & once as a resistance. Due to its short operating duration, I would treat uptrend line 2a as an aberration and the market was in a sideway trading (with an upside bias) for the 8 months' period from October 2009 to May 2010.

Based on the above observations, I believe the market will attempt to rise above uptrend line 3. I do not believe it will succeed in doing so. As such, one should sell into the current rebound, especially if FBM-KLCI were to come close to the 1550-1560 level. Thereafter, the market is likely to go sideway for the next few months until it can find another sustainable uptrend line. This is my base case scenario for the market.


Chart: FBM-KLCI's daily chart as at Feb 14, 2011 (Source: Tradesignum)

I can think of the bullish case scenario where the market would rally after a short consolidation, similar to uptrend line 2. I can also think of the bearish case scenario for the market. As noted, the FBM-KLCI has broken the 3rd fan trend line. This points to a bearish outlook for the market. Could this be a temporary top where we would see many weeks of lower prices or could it be something more serious- a cyclical top where we would see many months of lower prices? We will have to wait & see.

Thursday, February 10, 2011

CIMB has broken its uptrend line

CIMB broke its uptrend line at RM8.38-8.40 today. If it failed to recover above the uptrend line, the stock will drift lower. Its next support is at the horizontal line & psychological support of RM8.00. Avoid CIMB for now.


Chart: CIMB's daily chart as at Feb 10, 2011_11.00am (Source: Quickcharts)

The breakdown of CIMB uptrend line is an ominous sign. It is the second market leader to have broken its uptrend line that started in May 2010: the first being Genting. This could signal a deeper correction ahead for the broader market.

The aggressive stance taken by some Asian central banks in their fight against the growing threat of inflation has caused some anxiety among the Asian bourses. I have listed below the main indices that have violated their respective 50-day moving averages (Note. TWII is marginally above its 50-DMA). As posted earlier, our market is in a precarious position. A sharp correction in our market will likely to coincide with similar correction in other regional markets. Be careful...


Note: Our FBM-KLCI, at 1513 now, is also below its 50-day moving average of 1527.

Wednesday, February 09, 2011

Maxis has a bullish breakout

Maxis broke above its horizontal resistance at RM5.40 this morning. Since its listing in November 2009, Maxis seems to be rising in a step-ladder fashion, with each breakout leading to a small gain of RM0.20. If that pattern persists for the present breakout, then there is little to gain for getting into the stock. However, one can never know how a stock will perform after a breakout. For those who have been egging to getting into Maxis, this could be the green light that you have been waiting for. See the chart below.


Chart: Maxis's daily chart as at Feb 9, 2011_3.30pm (Source: Quickcharts)

For those with a more aggressive appetite, you may try Maxis-CD or CE or better still Maxis-JA. However, the tenor for Maxis-CD is rather short as it's due to expire in March. The better instrument for an aggressive play onMaxis's bullish breakout would be Maxis-JA, which is a Callable Bull Certificate (or 'CBLC'). As mentined previously, CBLC is very similar to a Call Warrant (or 'CW') except it has the added feature of having a Mandatory Call Event ('MCE') which automatically forces the issuer to recall the CBLC when it hit a Minimum Trading Price ('MTP') (for more, go here). At a premium of 1.2%, Maxis-JA is deemed fairly attractive.


Table: Maxis's CWs & CBLC valuation & terms

Genting broke its uptrend line


Genting tested its uptrend line on Jan 31 & rebounded sharply on Feb 2. Alas, this rebound cannot sustain. The stock broke below its uptrend line at RM10.70 today. If Genting failed to recover above the uptrend line, the stock will drift lower. Its next support is at the horizontal line & psychological support of RM10.00. Avoid Genting for now.


Chart: Genting's daily chart as at Feb 9, 2011_11.00am (Source: Quickcharts)

Tuesday, February 08, 2011

Harta- still standing tall

Results Update

Harta has just announced its results for QE31/12/2010. Its net profit increased by 4.5% q-o-q or 32.3% y-o-y to RM49 million while its turnover increased by 2.1% q-o-q or 26.6% y-o-y to RM188 million.


Table: Harta's last 8 quarterly results

The significant increase in top-line & bottom-line was attributable to increased production capacity & demand. The company managed to continue to grow its top-line & bottom-line on sequentially basis- something which its competitors failed to do- due to its dominant position in nitrile gloves. This products suffered less from the sharp rise in the price of rubber latex over the past few quarters. See Chart 1 & 2 below.


Chart 1: Harta's last 13 quarterly results


Chart 2: Harta's profit margin for the last 13 quarterly results

Valuation

Harta (closed at RM5.63 yesterday) is now trading at a trailing PE of 11 times (based on last 4 quarters' EPS of 51 sen). At this PE multiple, Harta is deemed attractive. However, the slowdown in the growth rate for its top-line & bottom-line may cap the share price at the present level for now.

Technical Outlook

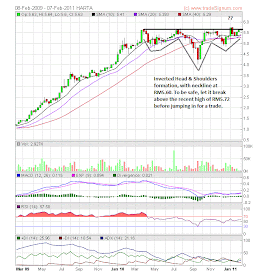
Harta's upside is capped by the strong horizontal resistance at RM5.60. The price movement in the past 9 months takes the shape of an inverted head & shoulders ('H&S') formation, with the neckline at RM5.60. Harta broke above the neckline on Jan 7 & 10 without significant volume. If we ignore this false breakout, the H&S formation is in tact. I believe an upside breakout above both the neckline at RM5.60 & the recent high of RM5.75 on significant volume would lead to the continuation of its prior uptrend. However a drop below the left & right shoulders at RM4.80-5.00 would convert this pattern into a reversal pattern.


Chart 3: Harta's weekly chart as at Feb 7, 2010 (Source: Tradesignum)

Conclusion


Based on good financial performance & attractive valuation, I would rate Harta a HOLD. The HOLD call would change if the share price either go above the RM5.60-70 level (a BUY call) or go below the RM4.80-5.00 level (a SELL call).

Market Outlook as at February 8, 2011

FBM-KLCI is still struggling to climb back above its uptrend line that began in May 2010. See Chart 1. However the broader market is performing slightly better as reflected by FBM-Emas's ability to climb back above its uptrend line. See Chart 2.


Chart 1: FBM-KLCI's daily chart as at Feb 8, 2011_9.30am (Source: Quickcharts)


Chart 2: FBM-Emas's daily chart as at Feb 8, 2011_9.30am (Source: Quickcharts)

Our market is at a critical juncture. If we look at the weekly chart of FBM-KLCI (Chart 3)- presented in both linear & logarithmic scale- we can see that we are trading very near to the 2 years' old uptrend line. If we look at the chart plotted on linear scale, the uptrend line support is at 1500. On the other hand, the uptrend line support of the log scale chart is at 1550. This means that FBM-KLCI is trading below the uptrend line of the chart plotted on log scale. However, FBM-KLCI is trading above the uptrend line of the chart plotted on linear scale. As such, the market is now in an uncertain territory. A quick recovery above 1550 would change the present cautious outlook to bullish outlook. On the other hand, a break below 1500 would push us into bearish outlook. Despite the uncertainty that hangs over the market, the 2nd & 3rd liners are having a field day. The market belongs- as always- to the quick & agile.


Chart 3: FBM-KLCI's weekly chart as at Feb 7, 2011 (Source: Tradesignum)

Wednesday, February 02, 2011

Happy CNY

I like to wish all my Chinese readers a HAPPY & PROSPEROUS NEW YEAR.


Source: Mytechquest.

Rubber glove sector- a glimmer of hope?

Today, we learned that Latexx is disposing off its entire business to Navis Asia for RM852 million or RM3.10 per share (go here). Is Navis Asia the same company which had earlier expressed interest in buying up the business of Adventa (go here)? It was reported that the party interested in buying up Adventa's business had earlier approached Topglov with the same motive. The interest shown by this unknown party & the successful deal between Navis Asia & Latexx could be a sign that the rubber glove sector has hit a bottom.

From Chart 1- to 3 below, we can see Latexx & Adventa have broken above their downtrend line while Harta is still pressing against its all-time high.


Chart 1: Latexx's daily chart as at Feb 2, 2011_9.30am (Source: Quickcharts)


Chart 2: Adventa's daily chart as at Feb 2, 2011_9.30am (Source: Quickcharts)


Chart 3: Harta's daily chart as at Feb 2, 2011_9.30am (Source: Quickcharts)

However, the same bullishness seems not to have touched the share price of Kossan & Topglov. This may present a buying opportunity for investors with longer time horizon to slowly nibble into this sector. Who knows when the price of rubber latex & the cross rate of USD & RM may move favorably for this sector?


Chart 4: Kossan's daily chart as at Feb 2, 2011_9.30am (Source: Quickcharts)


Chart 5: Topglov's daily chart as at Feb 2, 2011_9.30am (Source: Quickcharts)

Good entry level to Kossan & Topglov is at RM2.90-3.00 & RM4.80-5.00, respectively.