Friday, December 28, 2012

CCM- a 6-year decline!


Background

Chemical Company of Malaysia Bhd ('CCM') is the manufacturing, marketing and/ or supply of fertilizers, chemicals and pharmaceuticals products and services.

Recent Financial Results

For QE30/9/2012, CCM's net profit increased by 169% q-o-q or 483-fold y-o-y to RM8.2 million while revenue declined by 7% q-o-q or 5% y-o-y to RM374 million. The decline in revenue q-o-q is due to lower revenue from the Fertilizer division while bottom-line improved q-o-q due to better gross profit margin & operational cost reduction in the Fertilizer & Pharmaceutical divisions.


For the 9-month ended 30/9/2012, the 3 divisional performance are as follows:

  • Chemical- pre-tax profit of RM24 million on revenue of RM259 million;
  • Pharmaceutical- pre-tax profit of RM22 million on revenue of RM214 million; and
  • Fertilizer- pre-tax profit of RM3 million on revenue of RM658 million.


Table: CCM's last 8 quarterly results


Chart 1: CCM's last 26 quarterly results

Financial Position

As at 360/9/2012, CCM's financial position is deemed mixed with adequate liquidity as reflected by a current ratio of 1.3 times while leverage is high, with gearing ratio at 1.1 times. The high leverage is due to the group's heavy borrowing to acquire its Fixed Assets and its subsidiaries. It must be noted that it carried in its books goodwill of RM284 million as at 31/12/2011. This goodwill can be allocated to a subsidiary in the Pharmaceutical division (of RM194 million) and  a few subsidiaries in the Chemical divisions (of RM90 million). Looking at the meager profit reported by these two divisions, it is likely that the goodwill (or amount paid in excess of the underlying assets of a business) is not justifiable and could be written off. This will have the effect of knocking off 70 sen from its Net Assets per share of RM1.86; giving a NTA of RM1.16 per share.

Valuation

CCM (closed at RM0.86 yesterday) is now trading at a PE of 13 times (based on last 4 qaurters' EPS of 6.63 sen). At this PE, CCM is deemed fully valued.

Technical Outlook

CCM has been dropping for the past 6 years. That should give pause to anyone thinking that the stock is a steal. It broke below the "horizontal line" (AA) at RM1.30. It seems to be in an irregular downward channel, XX-YY, with "support" at RM0.60-0.65 (at the line, YY).


Chart 2: CCM's monthly chart as at Dec 27, 2012 (Source: Tradesignum)

However, it seems to have found some buying support at RM0.85 in the past few days. Similar buying came & went in early 2009 & late 2011. The best that one can hope for is that the stock stages a rebound back to the downtrend line that stretches back to 2006. If so, it may go as high as RM1.20-1.30 or maybe just up to the psychological RM1.00 mark.


Chart 3: CCM's 120-min chart as at Dec 28, 2012_3.30pm (Source: Quickcharts)

Other Comments

Sometime in 2008, there was a rumor that Pharmaniaga might takeover CCM (here). Pharmaniaga, currently owned by Boustead, used to be substantially owned by Khazanah in 2008 while CCM was & still is substantially owned by PNB about 70%. Can such a deal be revived today?

Conclusion

Based on poor financial performance, unattractive valuation & bearish technical outlook, CCM is a stock to be avoided at this stage.

Note:
In addition to the disclaimer in the preamble to my blog, I hereby confirm that I do not have any relevant interest in, or any interest in the acquisition or disposal of, CCM (and, Pharmaniaga).

Thursday, December 27, 2012

Oldtown- possible breakout at hand?

Oldtown has just broken above its recent high at RM2.26, albeit on thin volume. If it can recruit sufficient volume, Oldtown may continue with its prior uptrend. With sufficient buying support, this stock may continue with its prior uptrend. Its potential target could be RM2.70.

Based on the above, Oldtown could be a trading BUY.


Chart: Oldtown's weekly chart as at Dec 27, 2012_12.00pm (Source: Quickcharts)

Note:
In addition to the disclaimer in the preamble to my blog, I hereby confirm that I do not have any relevant interest in, or any interest in the acquisition or disposal of, Oldtown.

KSeng- poised for an upside breakout

KSeng tested its strong horizontal resistance at RM4.40-4.42 this morning. If it can break above this resistance, KSeng may continue its prior uptrend. If it can achieve the breakout, KSeng may be a trading BUY.


Chart: KSeng's weekly chart as at Dec 27, 2012_12.00pm (Source: Quickcharts)

Note:
In addition to the disclaimer in the preamble to my blog, I hereby confirm that I do not have any relevant interest in, or any interest in the acquisition or disposal of, KSeng.

Monday, December 24, 2012

PPB broke its long-term uptrend line

PPB broke its long-term uptrend line in September. It tried to recover above the uptrend line in October but failed. This was followed by the breakdown of its horizontal support at RM12.00. Next horizontal support levels are at RM10.00 & RM8.00. Its 10-month SMA line has just cut below the 50-month EMA line- the last time this happened was in early 1998. This plethora of negative technical reading means the outlook for the stock is bearish.

Based on this, it is not advisable to accumulate this stock despite the recent sharp decline. Those who choose to do otherwise, especially those who attempt to trade PPB at strong support levels, should do so with careful discretion and always with a tight protective stop.


Chart: PPB's monthly chart as at Dec 21, 2012 (Source: Tradesignum)

Note:
In addition to the disclaimer in the preamble to my blog, I hereby confirm that I do not have any relevant interest in, or any interest in the acquisition or disposal of, PPB.

CPO may have found a temporary bottom

CPO broke above its medium-term downtrend line at RM2200 last Friday (see Chart 1). With this breakout, CPO has found a temporary bottom. It may move sideway for a while or it may stage a short rally to test the psychological resistance at RM2500 or possibly challenge its intermediate downtrend line at RM2850 (see Chart 2).

A rebound in CPO prices would provide a catalyst for a re-rating in plantation stocks that had been sold down over the past few weeks.


Chart 1: CPO's daily chart aa at Dec 21, 2012 (Source: iFSmarketcenter.com)


Chart 2: CPO's weekly chart aa at Dec 21, 2012 (Source: iFSmarketcenter.com)

Saturday, December 22, 2012

Merry Christmas & Happy New Year!

I like to wish all my readers, Merry Christmas & Happy New Year.


(Source: freechristmaswallpapers)

Friday, December 21, 2012

Star- losing its shine

Result Update

For QE30/9/2012, Star's net profit dropped 23% q-o-q or 16% y-o-y to RM34 million while revenue was mixed, dropped 14% q-o-q but rose 5% y-o-y to RM256 million. Overall, the drop in bottom-line was attributed to higher operating expenses and finance cost.

Star's businesses are grouped into 4 divisions:
  • Print & New Media
  • Radio Broadcasting
  • Event, Exhibition, Interior & Thematic
  • Television Channel
Radio Broadcasting & Television Channel divisions are relatively small & they are incurred small losses for QE30/9/2012. Event, Exhibition, Interior & Thematic division is spearheaded by two companies- Cityneon and I.Star. For QE30/9/2012, Cityneon  incurred a loss before tax of RM1.73 million, due to higher operating expenses. I.Star reported a pre-tax profit of RM4.0 million due to the successof its Home & Lifestyle Exhibition held in Putra World Trade Center, KL & Penang.

The main division, Print & New Media reported a y-o-y decline in pre-tax profit from RM58.1 million to RM50.9 million. This was contributed by both the Print sub-division & the New Media sub-division as their revenue dropped 2.7% & 11.0% y-o-y, respectively. The decline in revenue was due to lower advertizing received.


Table: Star's last 8 quarterly results


Chart 1: Star's last 22 quarterly results

Financial Position

Star's financial position as at 30/9/2012 is deemed very healthy. Its current ratio stood at 3.0 times while its gearing ratio stood at only 0.25 time. Its has cash & FDs totaling RM494 million. If we deduct the borrowings of RM264 million, the net cash reserve is equivalent to 31 sen per share.

Valuation

Star (closed at RM2.59 yesterday) is now trading at a PE of 11.9 times (based on last 4 quarters' EPS of 21.85 sen). For a well-managed media company, this PE multiple is deemed very reasonable- even fairly attractive. 

Technical Outlook

Star's recent price decline followed swiftly after the stock broke its uptrend line at RM3.00. It has also broken below its horizontal line at RM2.65. Its next support will be the horizontal line at RM2.55 & definitely the psychological support at RM2.50.


Chart 2: Star's weekly chart as at Dec 20, 2012 (Source: Quickcharts)

Conclusion

Despite poorer financial performance & negative technical outlook, Star is a stock worth considering for long-term investment. Its valuation is fairly reasonable and, being the premier English newspaper in Malaysia, it would benefit from any upturn in economic activity.

Note:
In addition to the disclaimer in the preamble to my blog, I hereby confirm that I do not have any relevant interest in, or any interest in the acquisition or disposal of, Star.

Thursday, December 20, 2012

Haio- bottom-line jumped due to gain on disposal of land

Results Update

For QE31/10/2012, Haio's net profit increased by 57% q-o-q or 105% y-o-y to RM16 million while revenue increased by 8% q-o-q or 17% y-o-y to RM66 million. Pre-tax profit increased by RM6.7 million q-o-q due mainly to higher sales in all 3 divisions (wholesale, retail & others) as well as gain on disposal of one vacant land of RM4.8 million. If the exceptional gain is excluded, the pre-tax profit only increased by RM1.9 million- continuous improvement, not an eye-popping jump.


Table: Haio's last 8 quarterly results


Chart 1: Haio's last 31 quarterly results

Valuation

Haio (at RM2.23 as at 12pm) is now trading at a PE of 11 times (based on last 4 quarters' EPS of 20 sen, excluding the exceptional gain last quarter). At this PE, Haio is deemed fairly valued.

Techncial Outlook

Haio has been consolidating in a triangle for the past 10 months. It could be breaking to the upside of the triangle at RM2.20. For the breakout to be convincing, it needs higher volume.


Chart 2: Haio's weekly chart as at Dec 20, 2012_11.30am (Source: Quickcharts)

Conclusion

Based on satisfactory financial performance, reasonable valuation & potentially bullish technical outlook, Haio could be a good BUY for long-term investment.

Note:
In addition to the disclaimer in the preamble to my blog, I hereby confirm that I do not have any relevant interest in, or any interest in the acquisition or disposal of, Haio.

AEONCR- strong growth continued

Results Update

For 3-month ended 20/11/2012, Aeoncr's net profit increased by 9% q-o-q or 38% y-o-y to RM35 million while revenue increased by 85 q-o-q or 35% y-o-y to RM121 million. The improvement was attributable to growth in receivables & increased financing transaction volume.


Table: Aeoncr's last 8 quarterly results


Chart 1: Aeoncr's last 22 quarterly results

Valuation

AeonCr (closed at RM12.08 yesterday) is now trading at a PE of 14 times (based on last 4 quarters' EPS of 86.46 sen). At PE of14 times, AeonCr looks fairly valued. However, with CAGR of 18% over the past 3 years, its PEG ratio is 0.8 time. This means that the stock has room to appreciate- potentially another 25% to RM15.00 (until PEG ratio of 1 time).

Technical Outlook

AeonCr is still in an uptrend. Its immediate horizontal support is at RM11.00-11.10.


Chart 2: Aeoncr's weekly chart as at Dec 20, 2012_11.30am (Source: Quickcharts)

Conclusion

Based on satisfactory financial performance, reasonably attractive valuation & positive technical outlook, I revised the rating for AeonCr back to a good BUY for long-term investment.

Note:
In addition to the disclaimer in the preamble to my blog, I hereby confirm that I do not have any relevant interest in, or any interest in the acquisition or disposal of, AeonCr.

Topglov- hard slogging ahead

Result Update

Topglov reported its results for QE30/11/2012 last week. Its net profit increased 83% y-o-y but dropped 9% q-o-q to RM57.5 million while revenue increased 5% y-o-y but dropped 4% q-o-q to RM584 million. Topglov's topline dropped q-o-q due to lower selling price. This is in line with the 14%-drop in latex price. This plus greater efficiency resulted in an increase in net profit margin.

Pre-tax profit margin inched up from 11% in QE31/8/2012 to 12% in QE30/11/2012, despite the 14%-drop in latex price and greater efficiency. This is a sign that the fierce competition in this sector has caused the players to pass on the entire benefit of lower raw material price to the customers. The adjustment in the selling price more than offset the increased sales volume and this led to a decline in revenue.

The question to consider: How would the rubber glove producers perform if the raw material price start to rise? From Chart 1 below, we can see that rubber prices had broken its downtrend and could be poised for a rebound.

 
Table: Topglov's last 8 quarterly results


Chart 1: Rubber price chart as at Dec 18, 2012 (Source: Rubbernet)


Chart 2: Topglov's last 26 quarterly results

Valuation

Topglov (closed at RM5.73 today) is now trading at a PE of 15.5 times (based on last 4 quarters' EPS of 36.9 sen). At this PE, topglov is deemed fairly valued.

Technical Outlook

Despite breaking above the strong horizontal resistance at RM5.55, Topglov does not seem to rally. To me, this simply means that there is a big seller who is prepared to sell at this price. This is a battle between the bulls (buyers) who are attracted to Topglov for technical reason as well as to get the upcoming dividend of 9 sen. The bears (sellers) may be acting on their concern about the future prospect of the company. The outcome of this ongoing battle will be decided soon.


Chart 3: Topglov's weekly chart as at Dec 19 2012 (Source: Quickcharts)

Conclusion

Topglov will surely exercise the mind of many investors. Its financial performance has improved marginally but further improvement will be hard to come by. While the technical outlook is positive, this too may not be sustained. as such, investors will have to make their own judgment call. For now, I rate the stock a HOLD.

Note:
In addition to the disclaimer in the preamble to my blog, I hereby confirm that I do not have any relevant interest in, or any interest in the acquisition or disposal of, Topglov.

Wednesday, December 19, 2012

PWRoot- could be a trading BUY

PWRoot broke above its triangle at RM1.03 yesterday. This morning, it broke above its recent high of RM1.08. With this double breakout, the stock is expected to continue its uptrend. Rating revised from TAKE PROFIT to trading BUY


Chart: PWRoot's daily chart as at Dec 19, 2012_3.15pm (Source: Quickcharts)

 For previous report, go here.


Note: 
In addition to the disclaimer in the preamble to my blog, I hereby confirm that I do not have any relevant interest in, or any interest in the acquisition or disposal of, PWRoot.

Spritzr broke above its downtrend line

Results Update

For QE31/8/2012, Spritzr's net profit rose 56% q-o-q or 102% y-o-y to RM3.15 million while revenue increased by 2% q-o-q or 16% y-o-y to RM48 million. The increased revenue on y-o-y basis was attributable to higher sales volume (due to sales promotion) and higher selling prices. The increased bottom-line was due to higher sales volume and sales of higher margin products.


Table: Spritzr's last 8 quarterly results


Chart 1: Spritzr's last 25 quarterly results

Valuation

Spritzr (at RM1.03 as at 11.00am) is trading at a PE of 11 times (based on last 4 quarters' EPS of 9.31
 sen). At this PE, Spritzr is deemed fairly valued for a smallcap stock, albeit one that has potential for further growth due to recent plant expansion.

Technical Outlook

Spritzr broke above its downtrend line at RM0.90 a few days ago. With this breakout, Spritzr can continue with its long-term uptrend. Next target is the recent high at RM1.20.


Chart 2: Spritzrs weekly chart as at Dec 18, 2012 (Source: Tradesignum)

Conclusion

Based on good financial performance and positive technical outlook, Spritzr could be a good stock for long-term investment.

Note:
In addition to the disclaimer in the preamble to my blog, I hereby confirm that I do not have any relevant interest in, or any interest in the acquisition or disposal of, Spritzr.

Tuesday, December 18, 2012

SCGM- a reasonably attractive packaging stock

Background

SCGM Berhad is involved in manufacturing and trading plastic products, such as thermo-vacuum formed plastic packaging products and extrusion sheets that are used in the production of thermo-vacuum formed plastic packaging.

Recent Financial Results

For QE31/10/2012, SCGM's net profit rose 5% q-o-q or 68% y-o-y to RM2.3 million while revenue was mixed- down 10% q-o-q but rose 22% y-o-y to RM22.9 million. The explaination given by the company for the financial performance are:

Year-on-year performance

The sales performance was commendable as it is an improvement over previous year’s performance despite a challenging external environment. Aggressive marketing for new customers helped. The Hari Raya and Deepavali festivals falling in August and November respectively also boosted sales. The Profit before Tax was also very commendable compared to previous year’s performance as the input costs such as oil, power and raw materials continue to be quite stable in the current quarter. There was also better economies of scale which reduces the overall unit cost.

Quarter-on-quarter performance  

This quarter sales performance was less commendable but was not unexpected as the Hari Raya festival tend to be bigger festival than the Deepavali festival. Input cost such as labour, fuel and electricity which impacts on margins was stable in the current quarter of the financial year compared to the preceding quarter as world commodity prices remained stable. Economies of scale which reduces the overall unit cost also helped.

I always like a company that makes live easy for analyst.

 
Table: SCGM's last 8 quarterly results

 
Chart 1: SCGM's last 32 quarterly results

Financial Position

SCGM's financial position as at 31/10/2012 is deemed healthy, with current ratio at 4.3 times and gearing ratio at 0.06 time. Its working capital management is satisfactory, with inventory turnover & debtors' turnover of 63 & 96 days, respectively.

Private Placement Proposed

In March 2012, SCGM proposed a private placement of RM8.4 million for the following purposes:
  • Purchase of additional lines of production lines for thermo-vacuum forming process of RM2.3M
  • Acquisition of extrusion machines of RM2.0M
  • Repayment of bank borrowing of RM2.2M
  • Working Capital requirement of RM1.75M
  • Defraying expenses related to the private placement of RM0.15M
In view of its under-leverage position, SCGM can easily borrow to finance its fixed assets acquisition and working capital requirement. A case can be made that borrowing may be more cost-effective than equity financing. 

Valuation

SCGM (closed at RM0.50 yesterday) is now trading at a PE of 5.3 times (based on last 4 quarters' EPS of 9.48 sen). At this PE, SCGM is deemed reasonably valued.

Technical Outlook

SCGM has range-bound between RM0.43 & RM0.60 for 4 years, from 2008 to 2011. In early 2012, it broke the RM0.60 resistance to hit a high of RM0.80. In late November, the stock dropped back to its trading range for unexplained reason. SCGM is now resting at the horizontal line at RM0.50.

 
Chart 2: SCGM's weekly chart as at Dec 18, 2012_12pm (Source: quickcharts)

Conclusion

Based on good financial performance & position, reasonable valuation & trading at strong technical support, SCGM could be a good stock for long-term investment. One area of concern remained & that's the unexplained drop in the share price recently.

Note:
In addition to the disclaimer in the preamble to my blog, I hereby confirm that I do not have any relevant interest in, or any interest in the acquisition or disposal of, SCGM.

Magni- an attractive stock

Background


Magni-Tech Industries Bhd (‘Magni’) is involved in packaging & apparel businesses.

Recent Financial results

For QE31/10/2012, Magni's net profit increased by 23% q-o-q or 16% y-o-y to RM10.3 million while revenue increased by 2.5% q-o-q but declined by 4.1% y-o-y to RM135 million. Bottom-line improved q-o-q mainly attributed to lower operating expenses.


Table: Magni's last 8 quarterly results


Chart 1: Magni's last 15 quarterly results

Financial Position

Magni's financial position as at 31/10/2012 is deemed healthy, with current ratio at 2.6 times and no bank borrowings. Its working capital management is satisfactory, with inventory turnover & debtors' turnover of 37 & 53 days, respectively.

Valuation

Magni (closed at RM1.45 yesterday) is now trading at a PE of 4.8 times (based on last 4 quarters' EPS of 30.46 sen). At this PE, Magni is deemed fairly attractive.

Technical Outlook

Magni is in a gradual uptrend line. Its immediate support is at the horizontal line at RM1.30 & then the uptrend line at RM1.25.


Chart 2: Magni's weekly chart as at Dec 18, 2012_12pm (Source: quickcharts)

Conclusion

Based on good financial performance & position, attractive valuation & good technical outlook, Magni is a good stock for long-term investment.

Note:
In addition to the disclaimer in the preamble to my blog, I hereby confirm that I do not have any relevant interest in, or any interest in the acquisition or disposal of, Magni.

Thursday, December 13, 2012

Market Outlook as at December 13, 2012

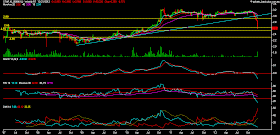
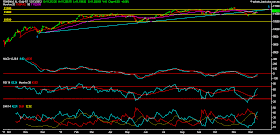
Despite Fed's announcement of QE4, most Asian markets are non-plus this morning. On the local front, FBMKLCI and FBMEmas were up marginally as at 12.00 noon. This is simply because the Asian market and our stock market have been up for the past few days. In fact, we can see from the charts below that FBMKLCI and FBMEmas were trying to climb above the previous uptrend line, SS. That this coincides with a strong horizontal resistance would make further upside move not very likely within the next few days. So, we can expect a mild correction to set in. Those, who had purchased some badly beaten stocks in late November that had risen smartly over the past few days, are well-advised to take some profit.


Chart 1: FBMKLCI's daily chart as at Dec 13, 2012_12.00pm (Source: Quickcharts)


Chart 2: FBMEmas's daily chart as at Dec 13, 2012_12.00pm (Source: Quickcharts)

Wednesday, December 12, 2012

GCB broke its uptrend line

Results Update

For QE30/9/2012, GCB (formerly, Guanchg)'s net profit dropped 22% q-o-q but rose 6% y-o-y to RM27.4 million while revenue rose 11% q-o-q but dropped 5% y-o-y to RM348 million. Bottom-line declined q-o-q due to lower gain on commodity futures contracts and net fair value loss on forex derivatives.


Table: GCB's last 8 quarterly results


Chart 1: GCB's last 32 quarterly results

Valuation

GCB (closed at RM1.70 yesterday) is now trading at a PE of 6.4 times (based on last 4 quarters' EPS of 26.57 sen). This means that GCB is now trading in the middle of its PE band of 4.5 & 8.5 times.

Technical Outlook

GCB broke its long-term uptrend line at RM1.86. Its next strong support is at the horizontal line at RM1.60 and thereafter at RM1.25. .


Chart 2: GCB's weekly chart as at Dec 12, 2012_12pm (Source: quickcharts)

Conclusion

Based on technical consideration, GCB is rated a trading SELL. However, GCB is a good stock and for those with patience, it is good buy if the stock finds support at the horizontal line at RM1.60 (or RM1.25).

Note:
In addition to the disclaimer in the preamble to my blog, I hereby confirm that I do not have any relevant interest in, or any interest in the acquisition or disposal of, GCB.

POS- broke above its all-time high (UPDATED)


POS broke above its strong horizontal resistance at RM3.25. From the charts below, you can see that this is the recent high as well as the all-time high. This could be the beginning a strong rally that could potentially hit RM4.00.

Based on technical consideration, POS could be a good trading BUY.


Chart 1: POS's daily chart as at Dec 12, 2012_10.15am (Source: Quickcharts)


Chart 2: POS's monthly chart as at Dec 12, 2012_10.15am (Source: Quickcharts)


Recent Financial Results (updated)

For QE30/9/2012, POS's net profit dropped 17% q-o-q but rose 12% y-o-y to RM30.4 million while revenue dropped 3.5% q-o-q but rose 2.7% y-o-y to RM300 million.


Table: POS's last 8 quarterly results


Chart 3: POS's last 28 quarterly results

Valuation (updated)

Based on current price of RM3.34, POS is trading at a PE of 15 times (based on last 4 quarters' EPS of 22.19 sen). At this PE, POS is deemed fully valued.

Note:
In addition to the disclaimer in the preamble to my blog, I hereby confirm that I do not have any relevant interest in, or any interest in the acquisition or disposal of, POS.

Tuesday, December 11, 2012

P&O- uptrend may continue

P&O broke above its September 2012 high of RM1.30 today. With this breakout, the stock is likely to continue with its prior uptrend. Its target price for the this move could be RM1.50.

Based on techncial breakout, P&O could be a trading BUY.


Chart 1: P&O's daily chart as at Dec 11, 2012_2.45pm  (Source: Quickcharts)


Chart 2: P&O's weekly chart as at Dec 11, 2012_2.45pm  (Source: Quickcharts)

Note:
In addition to the disclaimer in the preamble to my blog, I hereby confirm that I do not have any relevant interest in, or any interest in the acquisition or disposal of, P&O.

BJFood- doing jolly well


BJFood announced its acquisition of Jollibean Foods Pte Ltd, Singapore (“Jollibean”) for a cash consideration of SGD7.50 million (or about RM19.02 million). Jollibean is a Singapore-based company that owns a chain of 30 outlets that involved in the sales of soya products. For more, go here.

From the chart below, we can see that BJFood has recovered back above its uptrend line at RM1.31. If it can also break above its recent high of RM1.34, this stock may continue with its prior uptrend. Its next target is RM1.50. Amresearch, which has a strong buy recommendation on the stock, raised the fair value from RM1.40 to RM1.55 from the acquisition (here).

If BJFood can surpass its recent high of RM1.34, it could be a good trading BUY.


Chart 1: BJFood's daily chart as at Dec 11, 2012_2.45pm  (Source: Quickcharts)


Chart 2: BJFood's monthly chart as at Dec 11, 2012_2.45pm  (Source: Quickcharts)

Note:
In addition to the disclaimer in the preamble to my blog, I hereby confirm that I do not have any relevant interest in, or any interest in the acquisition or disposal of, BJFood

Thursday, December 06, 2012

Nokia- the recovery may begin?


Those days when Nokia communicator was a hot gadget are long gone. And, Nokia and its share price continue to welter and shrink. Nokia, once traded at USD60 apiece in 2000, was recently traded at less than USD2.00. All this thanks to the arrival of Apple Iphones and the army of Android phones.

However, all is not lost for Nokia. In Feb. 2011, Microsoft Corp. and Nokia Oyj paired up, with the goal of making the mobile market more of a “three-horse race” and to turn Microsoft’s Windows Phone operating system into a “challenger” to Apple’s iPhone and iOS software and phones powered by Google’s Android OS. The latest line of smartphone from Nokia which run on Windows Phone 8 received good review.


Chartwise, Nokia has broken above its 200-day SMA line three weeks ago. Yesterday, the stock broke above its recent high. This could be the beginning of the recovery for Nokia.


Chart 1: Nokia's daily chart as at Dec 5, 2012 (Source: Stockcharts)


Chart 2: Nokia's weekly chart as at Dec 5, 2012 (Source: Stockcharts)

Latitud- the recovery may begin?

Results Update

For QE30/9/2012, Latitud's net profit rose 32% q-o-q or 28-fold y-o-y to RM9.0 million while revenue rose 9% y-o-y but declined 2% q-o-q to RM140 million. The improved bottom-line is attributed to higher sales (y-o-y), better margin & favorable forex movement (with USD strengthening against MYR).


Table 1: Latitud's last 8 quarterly results


Chart 1: Latitud's last 29 quarterly results 

Industrial Outlook & Future Prospects

Latitud's export heavily to the US (as per its Annual report for FY2011, 95% of its sales is to the US).
Furniture sales are correlated to the housing market. Since the downturn in US housing market in 2008 - it actually peaked in 2006 - Latitud's revenue had stagnated. Over the past few months, there are tentative signs that the US housing market might have bottomed. There are even signs that the US housing market may be rebounding. This could be the driver for most sales for Latitud for the months to come.

Besides the poor US housing market affecting its sales, Latitud's bottom-line was also affected by the strengthening of the MYR vis-s-vis the USD and higher raw material. The recent strengthening of the USD, coupled with a drop in raw material cost and improvement in the US housing market, could drive up Latitud's earning.


Chart 2: US housing market (Source: Street Talk Live)


Valuation

Latitud (closed at RM0.74 yesterday) is now trading at a PE of 3.9 times (based on last 4 quarters' EPS of 19.2 sen). At this PE, Latitud is deemed fairly attractive.

Technical Outlook

this morning, Latitud has broken above its long-term downtrend line at RM0.75 - which happens to be the strong horizontal line. With this breakout, the stock may move sideway or move higher. The thin volume is a caution to all that this breakout may not sustain.


Chart 3: Latitud's weekly chart as at Dec 6, 2012_11am  (Source: Quickcharts)

Conclusion

Based on better financial performance, attractive valuation & potential positive technical outlook, Latitud is a good stock for long-term investment.

Note:
In addition to the disclaimer in the preamble to my blog, I hereby confirm that I do not have any relevant interest in, or any interest in the acquisition or disposal of, Latitud.