Wednesday, November 26, 2014

DLady: Improved performance but demanding valuation persists

Result Update

For QE30/9/2014, DLady's net profit increased by 18% q-o-q but dropped by 32% y-o-y to RM28.5 million while its revenue dropped by 10% q-o-q or 9% y-o-y to RM240 million. Revenue dropped q-o-q mainly contributed by lower volume sales. Nevertheless the profit before taxation for increased by RM5.8 million mainly due to cost management and favorable movement in raw material purchases


Table: DLady's last 8 quarterly results


Chart 1: DLady's last 26 quarterly results

Valuation

DLady (closed at RM45.90 yesterday) is now trading at a PE of 27 times (based on last 4 quarters' EPS of 169 sen). At this PE, DLady is deemed fully valued.

Technical Outlook

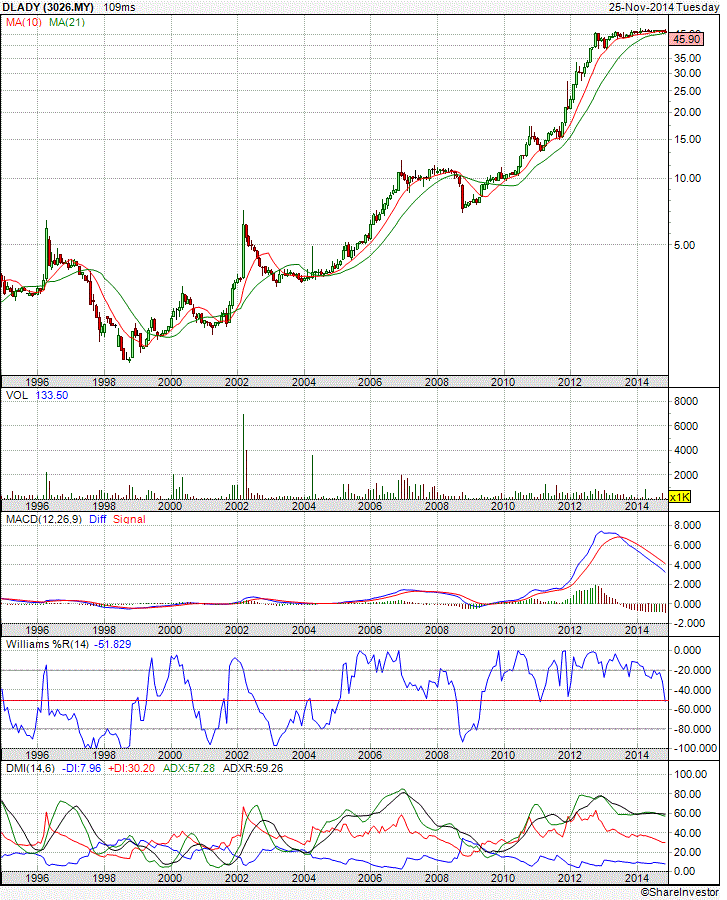
Since October 2012, DLady has been moving sideways around RM46-48. Its indicators have weakened steadily, with monthly MACD hooked down & William %R at the 50-mark. A breakout of the trading range of RM46-48 will point the way forward for the stock.


Chart 2: DLady's weekly chart as at Nov 25, 2014 (Source: Share Investor)

Conclusion

Based on demanding valuation & technical weakness, I would rate DLady as a REDUCE.

Note:
In addition to the disclaimer in the preamble to my blog, I hereby confirm that I do not have any relevant interest in, or any interest in the acquisition or disposal of, DLady.

Johotin: The recovery begins?

Results Update

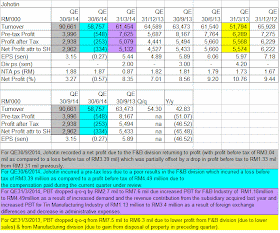
For QE30/9/2014, Johotin reported a pre-tax profit of RM4.0 million as compared to a pre-tax loss of RM548k incurred in QE30/6/2014. Revenue rose 54% q-o-q to RM91 million due to the commencement of operation if its new factory in Teluk Panglima Garang, Selangor. which is involved in milk powder business and the manufacturing of retail packs for milk powder.

In the past 2 quarters, its financial performance was affected by product quality issue in the F&B segment. This problem arose due to the cans not totally dry when they were passed through the dryer in its production process line. The water residue inside the cans led to yeast built-up & the contamination of the product.

In QE30/6/2014, Johore Tin replaced the affected which led to a drop in revenue fell to RM58.8 million from RM61.5 million and the ensuing losses. This issue was fully settled by QE30/9/2014 and would not have any impact on Johotin's results going forward.


Table 1: Johotin's last 8 quarterly results


Chart 1: Johotin's last 20 quarterly results 

Valuation
Johotin (closed at RM1.44 yesterday) is now trading at a trailing PE of 11 times (based on last 4 quarters' EPS of 13.2 sen). At this PE, the stock is deemed fully valued. However, the company expects revenue to grow to RM350 million in FY15 and based on profit margin of 8.6%, its net profit could be RM30 million. this would translate to a EPS of 32 sen. Assuming a conservative PE of 10 times, Johotin's fair value would be RM3.20.

Note: The revenue ot RM350 million in FY15 will consist of revenue from F&B segment of RM250 million (from new business operation carried out in the new factory in Selangor) and steady growth of 5-10% from tin manufacturing which will include a new 6-color flat sheet printing line to be commissioned in January 2015.

Technical Outlook

Johotin is in an uptrend line, with support at RM1.40.


Chart 2: Johotin's monthly chart as at Nov 25, 2014  (Source: Share Investor)

Conclusion

Despite the improving financial performance and positive technical outlook, Johotin is a good stock for long-term investment.

Note:
In addition to the disclaimer in the preamble to my blog, I hereby confirm that I do not have any relevant interest in, or any interest in the acquisition or disposal of, Johotin.

Tuesday, November 25, 2014

Brahim: Next upleg beckons?

Not long ago, Brahim was a hot stock. It has a fast-growing food business - supplying meals to airlines - and another sure winner waiting for take-off - the sugar refinery in Sarawak. After its biggest airline customer, MAS suffered the unprecedented loss of 2 planes in less than a year and has to undergo adrastic restructuring, Brahim's future looks rather bleak. It may have to lose the profitable airline meal supply business when the existing contract with MAS is renegotiated.

From the charts below, we can see that Brahim has dropped from its  recent high of RM2.70 recorded in March 2014 to a recent low of just below RM1.20. It tested its long-term uptrend line and rebounded.


Chart 1: Brahim's weekly chart as at Nov 24, 2014 (Source: Tradesignum)

From the daily chart, we can see that Brahim has broken above the downtrend. In addition, a short-term uptrend line has formed. If the stock on weakness does not break below the RM1.40, the recovery for Brahim could be starting.


Chart 1: Brahim's daily chart as at Nov 24, 2014 (Source: Tradesignum)

Based on technical breakout, Brahim could be a good stock for medium-term investment.

Note: 
In addition to the disclaimer in the preamble to my blog, I hereby confirm that I do not have any relevant interest in, or any interest in the acquisition or disposal of, Brahim.

NCB: Cheap enough?

New Development


It is reported in The Edge that Tan Sri Syed Mokhtar Albukhary's 51.76%-controlled MMC Corp Bhd is in talks with MISC Bhd to buy the latter’s 15.73%-stake in loss-making NCB Holdings Bhd. A source noted that NCB might be used as a listed vehicle for the backdoor listing of Syed Mokhtar’s port businesses, such as Port of Tanjung Pelepas (PTP) in southern Johor and Penang Port. For more, go here.

Recent Results Update

For QE30/9/2014, NCB reported a net loss of RM2.3 million as compared to a net profit of RM2.8 million recorded in QE30/6/2014 or RM27 million recorded last year. The loss was attributed to lower revenue registered for the third quarter plus higher operating, depreciation and amortization costs and interest expenses.

The results for NCB over the past 3 quarters was affected by adjustment made in the book of its ailing subsidiary, Kontena Nasional Bhd ('KNB'). It was reported that a special review of KNB's books by Pricewaterhouse Coopers had revealed that KNB's revenue was being inflated, while operating expenditure was being suppressed. KNB’s adjustments amounted to RM56.6 million, out of which RM32 million was accrual of costs while an additional RM24.6 million was over recognition of revenue spanning from 2010 to 2013.


Table: NCB's last 8 quarterly results


Chart 1: NCBs last 26 quarterly results

Valuation

NCB (at RM2.33 yesterday) is now trading at a PB of 0.8 time.As the company's earning is negligible, the PE computed is meaningless.

Technical Outlook

NCB has retreated back to its gradual long-term uptrend line at RM2.40. This coincides with its horizontal line of RM2.40.


 Chart 2: NCB's monthly chart as at Nov 24, 2014 (Source: Share Investors)


Conclusion

Despite the poor financial performance, NCB may be worth considering for a long-term investment due to its substantial decline. The drop has brought out value in the stock as it trades at 0.8x its NTA per share. It has tested its long-term uptrend line and could slowly recover from here.

Note: 
In addition to the disclaimer in the preamble to my blog, I hereby confirm that I do not have any relevant interest in, or any interest in the acquisition or disposal of, NCB.

Parkson: China Syndrome?

Results Update

For QE30/9/2014, Parkson's net profit dropped by 25% q-o-q or 34% y-o-y to RM20 million while revenue inched up 4% q-o-q or 2% y-o-y to RM848 million. Revenue increased q-o-q due Muslim's festive season in Malaysia & Indonesia. Pre-tax profit dropped due to the challenging retailing operations in China, which is the result of the proliferation of e-commerce operation & weak discretionary spending. This has a negative impact on Parkson China's SSS growth.


Table: Parkson's last 8 quarterly results


Chart 1: Parkson's last 31 quarterly results 

Valuation

Parkson (closed at RM2.48 yesterday) is now trading at a trailing PE of 20 times (based on last 4 quarters' EPS of 12.1 sen). If you expect the Chinese economy to recover in the near term, then we can expect Parkson's results to improve, leading to the rollback of the current high PE. Without an increased earning, Parkson's valuation is demanding.

Technical Outlook

Parkson has been in a downtrend since 2008. It is struggling to hang onto the support of RM2.50. If that support failed, then its next support is at the horizontal line of RM2.20 and then the psychological RM2.00 mark. Its immediate resistance is at RM3.00.


Chart 2: Parkson's monthly chart as at Nov 24, 2014 (Source: Share Investor)


Conclusion

Despite the poor financial performance for the past 2-3 years & bearish technical outlook, Parkson is a stock worth watching because it has dropped so much. I believe that the RM2.50 level is a strong support and the base for a bottoming phrase for this stock. If you are a contrarian, you might start to slowly accumulate this stock.

Note:
In addition to the disclaimer in the preamble to my blog, I hereby confirm that I do not have any relevant interest in, or any interest in the acquisition or disposal of, Parkson.

Monday, November 24, 2014

Evergrn: Poised for reversal?

Results Update
For QE30/9/2014, Evergrn returned to profitability with a net profit of RM10 million from anet loss of  RM8 million in the same quarter last year (or a net loss of RM22 million from the immediate preceding quarter). Revenue inched higher by 9% q-o-q or less than 1% y-o-y to RM234 million.

Revenue increased q-o-q mainly due to higher sales volume and average selling prices while net profit increased q-o-q mainly due to higher revenue & lower log & glue costs.


Table: Evergrn's last 8 quarterly results


Chart 1: Evergrn's last 39 quarterly results

Valuation

Evergrn (currently at RM0.54 last Friday) is trading at a PB of 0.35 times (based on NTA of RM1.56 as at 30/9/2014). As the company was a loss-making concern, we could not compute its PE. Based on attractive PB, the stock could rise steady once it has returned to profitability.

Technical Outlook

Evergrn is a trending stock; it is in either an uptrend or a downtrend. When reversal happens, the trend would change from uptrend to downtrend or vice versa.


Chart 2: Evergrn's monthly chart as at Nov 21, 2014 (Source: Share Investors)

Evergrn was in a steady downtrend for the past 4 years. It looks poised for a change to an uptrend. The good support is at RM0.55.


Chart 3: Evergrn's weekly chart as at Nov 21, 2014 (Source: Tradesignum)

Conclusion

Based on improved financial performance (albeit only one-quarter) and mildly positive technical outlook, Evergrn is worth close tracking for potential medium-term investment.

Note:
In addition to the disclaimer in the preamble to my blog, I hereby confirm that I do not have any relevant interest in, or any interest in the acquisition or disposal of, Evergrn.

Coastal: Bottom-line continued to rise

Result Update
Coastal's net profit increased by13% q-o-q or 37% y-o-y to RM54million while revenue was mixed- down 4% q-o-q but rose 19% y-o-y to RM232 million. The increased bottom-line was attributed to higher margin derived from the sale of vessels by Shipbuilding Division.


Table 1: Coastal's last 8 quarterly results


Chart 1: Coastal's last 41 quarterly results 

Valuation

Coastal (closed at RM3.46 last Friday) is now trading at a PE of 8.8 times (based on last 4 quarters' EPS of 39.5 sen). While Coastal's PE appears reasonably priced, its earning may be affected if the current crude oil prices continue to slide. This could lead to a slowdown in the O&G sector in general, which would affect the prospect of Coastal going forward.

Technical Outlook

Coastal is in an uptrend, with immediate support at RM3.50 & then at RM3.00.


Chart 2: Coastal's weekly chart as at Nov 21, 2014 (Source: Share Investor)

Conclusion

Based on satisfactory financial performance, fair valuation & positive technical outlook, Coastal is rated a HOLD. However its prospect and earning could be affected negatively if crude oil prices continue to weaken.

Note:
In addition to the disclaimer in the preamble to my blog, I hereby confirm that I do not have any relevant interest in, or any interest in the acquisition or disposal of, Coastal.

Friday, November 21, 2014

QL: Top-line & bottom-line continued to rise

Results Update

For QE30/9/2014, QL's net profit increased by 19% q-o-q or 14% y-o-y to RM48 million. Revenue improved by 8% y-o-y but remained unchanged q-o-q at RM656 million. All 3 segments showed improved q-o-q performance. PBT from Marine product manufacturing increased 14% q-o-q against preceding quarter due to new contribution from shrimp farming as well as better fish catch in Peninsular East Coast. PBT from Palm Oil Activities increased 23% q-o-q due to lower losses from Indonesia plantation operations and higher contribution from Associate (Boilermech). PBT from Integrated Livestock Farming increased 39% q-o-q against preceding quarter due to improved farming margin from Malaysia and Vietnam units.


Table: QL's last 8 quarterly results

Again, it is good to note that the profit margin has inched up in the past 4-5 quarters. This, plus the rising revenue, would lead to higher bottom-line going forward.


Chart 1: QL's last 26 quarterly results

Valuation

QL (closed at RM3.46 yesterday) is now trading at a PE of 22 times (based on last 4 quarters' EPS of 15.7 sen). Based on the PE of 22times & last year's earning growth of 22%, QL's PEG ratio stood at 1 time. This means that QL is fairly valued.

Technical Outlook

QL continued its uptrend after it surpassed the resistance at RM2.60. There are signs of weakness in the share price movement.


Chart 2: QL's weekly chart as at Nov 21, 2014 (Source: ShareInvestor.com)

Conclusion

Based on improved financial performance, QL is a good stock for long-term investment. However, its upside is limited as it is fairly valued with signs of technical weakness emerging. As such, I would rate the stock as a HOLD for now.

Note: 
In addition to the disclaimer in the preamble to my blog, I hereby confirm that I do not have any relevant interest in, or any interest in the acquisition or disposal of, QL.

MEGB: Good things come in three?!

Background

Last week, MEGB announced that it received "a notice of request from Strategic Ambience Sdn Bhd, a wholly-owned subsidiary of SMRT Holdings Berhad to conduct due diligence on the Company and its subsidiaries for a period not exceeding 30 days from the date of approval by the Board, with a further extension of 15 days upon request. The Due Diligence Request was pursuant to an undertaking from Mr. Siva Kumar a/l M Jeyapalan, a major shareholder and an Executive Director of the Company committing to accept any offer which SASB either by itself (or by companies related to it) in conjunction with another person may make for the purchase of Mr. Siva’s entire shareholding in the Company consisting 123,656,700 ordinary shares of RM0.20 each in the Company."

Later, we learned that SMRT will be teaming with Creador (a private equity fund) to acquire the 32.9% stake in MEGB from Siva Kumar. For more, go here. Creador is a fairly successful fund manager which invests in consumer stocks. For more on Creador & its founder & CEO, Brahmal, go here.

Results Update

Yesterday, MEGB announced its results for QE30/9/2014. It returned to profitably after 11 quarters of losses. The turnaround happened because of an extraordinary gain of RM13.7 million from the disposal of investment in HKEX. If this gain is excluded, MEGB's losing streak would continue for yet another quarter.

  Table 1: MEGB's last 8 quarterly results


Chart 1: MEGB's last 22 quarterly results 

Valuation

There is no denying that MEGB is a stock with good asset backing. Malaysia Finance has posted an article on this, where it computed MEGB's assets per share at RM1.02 (here). Being a loss-making concern, the PB is the only valuation matrix that we can look at since we can't compute its PE.

Technical Outlook

Yesterday, MEGB broke above its horizontal line at RM0.65. This is a strong resistance and yesterday's breakout could set the stage for a rally to RM1.00-1.20.


Chart 2: MEGB's weekly chart as at Nov 20, 2014 (Source: Tradesignum)

My take on MEGB

Once in a while, we come across a stock that ticks all the right boxes and becomes a "screaming" BUY. Before you jump into this stock, you must consider:
1. Why is Siva Kumar willing to sell MEGB at a price that is "almost a steal"? He knows the company better than anyone else?
2. You could remember that Siva Kumar tried to sell off his stake in MEGB in a call-and-put option agreement with one Gary How of Hong Kong in March this year (here or here). In that agreement, Siva Kumar has a put option to sell his then 27.96%-stake at an even higher price of RM1.10. Why did he choose to terminate that option?
2. Can SMRT turnaround MEGB? We need to consider the highly competitive environment in the education field which has affected even a good education group like SEG.
3. How did MEGB manage to make such a substantial profit from its HKEX investment? Bearing in mind, this is from a company that's struggling to put out the fire in its backyard.
4. What would happen if MEGB fails the Due Diligence test?
Conclusion
Based on positive news flow and technical breakout, MEGB could be a good trading BUY. However, I must caution that MEGB has been a very tricky stock from day one. Nothing about this stock is simple. Thus, I believe what we have been seeing for the past 10 days in MEGB must be taken with more than a pinch of salt. If you choose to trade this stock, you must exercise careful discretion.

Note:
In addition to the disclaimer in the preamble to my blog, I hereby confirm that I do not have any relevant interest in, or any interest in the acquisition or disposal of, MEGB.

Wednesday, November 19, 2014

Harta: Bottom-line & top-line dipped

Result Update

For QE30/9/2014, Harta's net profit dropped 16% q-o-q or 24% y-o-y to RM48 million on lower revenue - a decline of 1% q-o-q or 2% y-o-y to RM275 million. Revenue declined due to lower average selling price from declining raw material prices and more competitive selling price. The operating profit margin decreased q-o-q from 25.9% to 23.7% basically due to increase in price of nitrile material, increase in natural gas cost and increase in pre-operating expenses for NGC project.


Table: Harta's last 8 quarterly results

From Chart 1 below, we can see that the profit margin has been sliding since 2010. This capped the group's bottom-line since 2011. Now, we see revenue has also reached its tipping point. This means that supply has exceeded demand as the top producers ramped up their capacity. We may soon see a price war and this can lead to a sharper drop in profit margin.


Chart 1: Harta's last 28 quarterly results

Valuation

Harta (closed at RM6.80 yesterday) is trading at a PE of 24.1 times (based on last 4 quarters' EPS of 28.25 sen). At this PE multiple, Harta is deemed over-valued.

Technical Outlook

Harta's long-term uptrend over the past 6 years has been interspersed by periodic sideways movement, such as witnessed in 2010-2011 and recently in 2014. I believe the stock will have good support at RM5.80-6.00.


Chart 2: Harta's daily chart as at Nov 18, 2014 (Source: Share Investor)

Conclusion

Based on lack of growth in its financial performance, demanding valuation & mildly negative technical outlook, I would rate Harta as a SELL INTO STRENGTH.

Note: 
In addition to the disclaimer in the preamble to my blog, I hereby confirm that I do not have any relevant interest in, or any interest in the acquisition or disposal of, Harta.

Monday, November 17, 2014

CIMBC50: A ticket to ride the Chinese equity recovery


Over the past 1 year, one market which had performed very well is India. The Bombay Stock Exchange 30 Sensex Index ("BSE") has rallied from 20000 at the beginning of the year to 27000 today. This rally followed the breakout of the horizontal resistance at 20000. See Chart 1 & 2 below.


Chart 1: BSE's weekly chart as at Nov 14, 2014 (Source: Stockcharts)


Chart 2: BSE's monthly chart as at Nov 14, 2014 (Source: Yahoo Finance)

In July/August, the Shanghai Stock Exchange Composite Index ("SSEC")broke above its downtrend line at 2150. It has since risen to about 2400. See Chart 3.


Chart 3: SSEC's weekly chart as at Nov 14, 2014 (Source: Stockcharts)

If you look at Chart 4, we can see that SSEChas been in a mega uptrend since early 1990s. That uptrend had corrected back 3 times (R-R, R1-R1 & R2-R2). In the past 2 breakout above the intervening downtrend (R-R & R1-R1), the index had entered into long rally upward. This current breakout could be a precursor to another long rally.


Chart 4: SSEC's monthly chart as at Nov 14, 2014 (Source: Yahoo Finance)

There are a few way that we play this rally in SSEC. Investing directly in Chinese stocks is an obvious choice but there is too much hassle. The easier alternative is to invest in a basket of Chinese stocks via mutual funds or ETFs. On Bursa Malaysia, we have an ETF set up & managed by CIMB which is dedicated to the Chinese stocks. The ETF is CIMBC50 which invests in the top 50 stocks listed on HKEX. (Note: I made a mistake of naming it CIMBC25 earlier. The name has been changed from CIMBC25 to CIMBC50 in September this year when the benchmark index was changed from FTSE China 25 index to FTSE China 50 index. For more, go to here.)

CIMBC50 has been trending higher in the past 3 years. The price movement resembles an irregular upward channel. An upside breakout of the line connecting the peaks at RM1.12 could signal the beginning of a strong rally in CIMBC25. See Chart 5.


 Chart 5: CIMBC50's weekly chart as at Nov 14, 2014 (Source: Share Investors)

However, the immediate outlook for CIMBC50 is mildly negative, due to weak sentiment in the local bourse. It is likely that it may drift lower, potentially testing its RM1.00 support. See Chart 6.


 Chart 6: CIMBC50's weekly chart as at Nov 14, 2014 (Source: Tradesignum)

Based on the bullish breakout for SSEC, I believe that Chinese equity is poised to go higher. One of the ways to ride on the Chinese bulls is to invest in CIMBC50.

Note:
In addition to the disclaimer in the preamble to my blog, I hereby confirm that I do not have any relevant interest in, or any interest in the acquisition or disposal of, CIMBC50.

Tuesday, November 11, 2014

Takaful: A good exposure to the consumer sector

Results Update

For QE30/9/2013, Takaful's net profit rose 5% y-o-y but dropped 22% q-o-q to RM33 million. Operating revenue also showed the same pattern - increased by 5% y-o-y but dropped 7% q-o-q to RM394 million.

The q-o-q decline in profit before zakat & tax was attributed to lower surplus transfer from Family & General Takaful. YTD revenue dropped due to lower sales generated by Family Takaful Group Credit product and partly offset by the increase in sales of Group Medical and Group Term products.


Table: Takaful's last 8 quarters' results


Chart 1: Takaful's last 34 quarters' results

Valuation

Takaful (closed at RM11.44 yesterday) is now trading at a PE of 12.2 times (based on the last 4 quarters' EPS of 93.5 sen). At this PE multiple, Takaful is deemed attractive, given its high CAGR of 16-17%.

Technical Outlook

The stock has been in an uptrend line with support at RM11.50.


Chart 2: Takaful's weekly chart as at Nov 10, 2014 (Source: Tradesignum)

Conclusion

Based on the good financial performance, steady growth, attractive valuation and bullish technical outlook, Takaful is still a good stock for long-term investment.

Note:
In addition to the disclaimer in the preamble to my blog, I hereby confirm that I do not have any relevant interest in, or any interest in the acquisition or disposal of, Takaful.

Monday, November 10, 2014

Petgas: Time to SELL

Results Update

For QE30/9/2014, Petgas's net profit was mixed - dropped 4% q-o-q but rose 10% y-o-y- at RM419 million, while revenue was up 2% q-o-q or 10% y-o-y to RM1.123 billion.

Compared to the immediate preceding quarter (QE30/6/2014), revenue increased q-o-q by RM21 million to RM1.124 billion mainly driven by higher utilities revenue due to higher offtake by customers. re-tax profit decreased q-o-q by RM30 million primarily due to higher cost of revenue and other operating expenses partially cushioned by higher revenue.


Table: Petgas's segmental results for the quarter & YTD


Table: Petgas's last 8 quarterly results


Chart 1: Petgas's last 33 quarterly results

Valuation

Petgas (closed at RM22.00 last Friday) is now trading at a PE of 26x (based on last 4 quarters' EPS of 84 sen). At this PE multiple, Petgas is deemed overvalued.

Technical Outlook

Petgas broke its long-term uptrend line at RM23 in early August. Its immediate support is the horizontal line at RM21.00. Below that, it should find support at the psychological RM20.00 mark as well as the strong horizontal support at RM18.00.
 

Chart 2: Petgas's weekly chart as at Nov 7, 2014 (Source: Tradesignum) 

Conclusion

Based on weaker financial performance, negative technical outlook & demanding valuation, Petgas is rated a SELL.

Note: 
In addition to the disclaimer in the preamble to my blog, I hereby confirm that I do not have any relevant interest in, or any interest in the acquisition or disposal of, Petgas.

MISC: Results improved q-o-q

Result Update

In QE30/9/2014, MISC's net profit rose 63% q-o-q or 17% y-o-y to RM471 million while revenue was mixed- down 14% q-o-q but inched up 1% y-o-y to RM2.18 billion. Revenue dropped q-o-q due to lower revenue in the Heavy Engineering following lower progress on projects in hand during the quarter. Pre-tax profit increased q-o-q due to lower operating losses incurred in Petroleum business and improved freight rates in Petroleum business.


Table: MISC's last 8 quarterly results


Chart 1: MISC's last 33 quarterly results 

Valuation

MISC (closed at RM7.38 on Friday) is now trading at a PE of 14x its FY2013 EPS of 52 sen. At this PE multiple, MISC is deemed fairly valued.

Technical Outlook

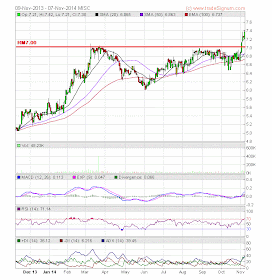
MISC broke above the RM7.00 horizontal line in early November. This could signal the continuation of its uptrend.


Chart 2: MISC's daily chart as at Nov 7, 2014 (Source: Tradesignum)
 
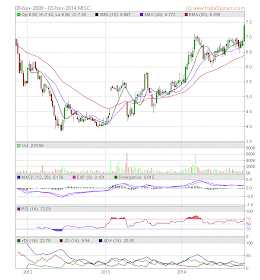
From the weekly chart (Chart 3), we can see that MISC is in an uptrend. Its next resistance is at RM7.80-8.00. 


Chart 3: MISC's weekly chart as at Nov 7, 2014 (Source: Tradesignum)

Conclusion

Based on satisfactory financial performance and bullish technical outlook, MISC is rated a HOLD.

Note:
In addition to the disclaimer in the preamble to my blog, I hereby confirm that I do not have any relevant interest in, or any interest in the acquisition or disposal of, MISC.

Wednesday, November 05, 2014

Market Outlook as at November 5, 2014

Our market has finally tested the underside of the violated long-term uptrend line at 1850 yesterday. After a 100-point rally off the low of 1766, the market is due for some profit-taking. The strong support would be at 1830-1835.

Until FBMKLCI has recovered above the uptrend line, the market uptrend is suspect.


Chart: FBMKLCI's weekly chart as at November 4, 2014 (Source: BTX)

Note:
In addition to the disclaimer in the preamble to my blog, I hereby confirm that I do not have any relevant interest in, or any interest in the acquisition or disposal of any of the stocks or indices shown above.

Tenaga: A slight dip in earning


Result Update

For QE31/8/2014, Tenaga's net profit increased by 5-fold y-o-y but dropped by 24% q-o-q to RM1.36 billion while revenue increased by 2% q-o-q or 23% y-o-y to RM11.72 billion. Revenue increased by RM589.9 million or 5.6% q-o-q as a direct result of the increase in the units sold of 4.6% in the Peninsula and 1.5% in Sabah. Net profit dropped q-o-q  mainly due to adjustment on revision of tax assessment during the quarter.


Table 1: Tenaga's last 8 quarterly results


Chart 1: Tenaga's last 27 quarterly results

Valuation

Tenaga (closed at RM13.50 yesterday) is now trading at a PE of 12 times (based on last 4 quarters' EPS of 115 sen). At this PE, Tenaga is deemed attractive.

Technical Outlook

Tenaga is in an uptrend line. It recently broke above the RM12.50 resistance.Its immediate resistance is likely to be the psychological RM15 mark.


Chart 3: Tenaga's weekly chart as at Nov 4, 2014 (Source: Tradesignum)

Conclusion

Based on improved financial performance, fairly attractive valuation, favorable regulatory regime & technical outlook, Tenaga is a good stock for investment- whether medium or long-term.

Note:
In addition to the disclaimer in the preamble to my blog, I hereby confirm that I do not have any relevant interest in, or any interest in the acquisition or disposal of, Tenaga.