Sunday, May 28, 2017

Ptaras: Poor Earnings Due to CNY

Results Update

In QE31/3/2017, Ptaras's net profit dropped 25% q-o-q or 19% y-o-y to RM8.4 million while revenue was mixed- down 12% q-o-q but rose 81% y-o-y to RM53million. Revenue dropped q-o-q due to lower contribution from the construction division as some on-going projects were at the tail end coupled with fewer working days during the CNY period  as well as lower investment income. However, contribution from the manufacturing division remained high.


Table: Ptaras's last 8 quarterly P&L

For 9-month ended 31/3/2017, revenue increased by 79% to RM172.1 million from RM95.9 million in the preceding year. Correspondingly, the PBT of RM41.6 million outperformed earnings for the same period last year by 155%, spurred mainly by better performance from the construction division as well as higher investment income. The construction division achieved a substantially higher revenue of RM148.8 million compared to RM70.4 million last financial year. Consequently, PBT soared by 336% to RM30.5 million from RM7.0 million last financial year. The increase in revenue and PBT were mainly due to increased volume of construction works. Revenue in the manufacturing division reduced by 9% to RM23.3 million from RM25.6 million compared to last financial year. The decline was mainly due to lower sales volume as well as lower selling prices. Nevertheless, the manufacturing division achieved a better PBT of RM3.9 million compared to RM3.6 million previous financial year, primarily due to lower material costs.


Graph: Ptaras's last 41 quarterly P&L

Financial Position

Ptaras's financial position is deemed very healthy as at 31/3/2017. Current ratio and gearing ratio stood at 0.21x and 0.21x respectively. Its cash in hand stood at RM163 million or RM1.00 per share.

Valuation

Ptaras (closed at RM3.87 last friday) is now trading at a PER of 16.6 times (based on last 4 quarters' EPS of 23.3 sen). If the cash in hand is deducted from the share price, then PER is lowered to 12.3 times. Based on this, Ptaras is deemed fairly valued.

Technical Outlook

Ptaras broke above the strong horizontal resistance at RM3.75 two weeks ago. This bulliah breakout could signal the begin of its next upleg.


Chart 1: Ptaras's weekly chart as at May 26, 2017 (Source: Shareinvestor.com)

Ptaras is still in its long-term uptrend line, with a possible hook-up in the monthly MACD. It certainly has come a long way since I first called a BUY on the stock in 2009 (here).


Chart 2: Ptaras's monthly chart as at May 26, 2017 (Source: Shareinvestor.com)

Conclusion
 
Based on satisfactory financial performance, attractive valuation & bullish technical outlook, Ptaras remains a good stock for long-term investment.

Note:

I hereby confirm that I do not have any direct interest in the security or securities mentioned in this post. However, I could have an indirect interest in the security or securities mentioned as some of my clients may have an interest in the acquisition or disposal of the aforementioned security or securities. As investor, you should fully research any security before making an investment decision.

Oldtown: Disappointing Result


Results Update

In QE31/3/2017, Oldtown's net profit plummeted 59% q-o-q or 47% y-o-y to RM10 million while revenue was mixed- down 8% q-o-q but rose 2% y-o-y to RM107 million. PBT dropped q-o-q due to 82%-decline in PBT from Café Chain operation and 52%-decline in PBT for the Beverage Manufacturing operation. Cafe Chain operation suffered mainly due to the provision of RM4.50 million on overdue trade receivable accounts while Beverage Manufacturing operation was affected by higher selling and distribution expenses.


Table: Oldtown's last 10 quarterly P&L

As a result of the poor financial performance, Oldtown's bottom-line is back to the low again.


Graph: Oldtown's last 14 quarterly P&L

Valuation

Oldtown (closed at RM2.78 last friday) is now trading at a PER of 21 times (based on last 4 quarters' EPS of 13.45 sen). At this PER, Oldtown is overvalued. I expect the share price to remain weka for many weeks as investors digest the unpleasant truth that Oldtown may not be a growth stock any time soon and does not deserve its high PE multiples given to it.

Technical Outlook

Oldtown share price plunged on Friday when the QE31/3/2017 result was released after the market closed on Thursday. the share price broke below the horizontal line at RM2.50 before recovery kicked in. I see the immediate support remains at RM2.50-2.60 while the immediate resistance is at RM2.80.


Chart 1: Oldtown's daily chart as at May 26, 2017 (Source: Shareinvetor.com)


Chart 2: Oldtown's monthly chart as at May 26, 2017 (Source: Shareinvetor.com)

Conclusion
 
Based on disappointing financial performance and demanding valuation, I revise my rating for Oldtown from a BUY to a SELL.

Note:


I hereby confirm that I do not have any direct interest in the security or securities mentioned in this post. However, I could have an indirect interest in the security or securities mentioned as some of my clients may have an interest in the acquisition or disposal of the aforementioned security or securities. As investor, you should fully research any security before making an investment decision.

Market Outlook as at May 26, 2017

Last week FBMKLCI ended on the 3rd fan uptrend line (S-S3) at 1770. Based on my previous analysis (here & here), this is a critical support which will determine the market outlook. As noted before, a breakdown of the 3rd fan uptrend line, S-S3 could signal the end of the uptrend. 


Chart 1: FBMKLCI's weekly & daily chart as at May 26, 2017 (Source: Shareinvestor.com)

I will go into the market next week with much apprehension, notwithstanding the technical rule that a trend remains in force until it has reversed. Two reasons make me worried about this market.

Firstly, our market breadth was quite negative last week. If you look at the table & graph below, you will see 2 weeks of market gainers, losers & unchanged stocks.


Graph: Bursa Scoreboard for 2 weeks to May 26, 2017

If you plot the market breadth against the FBMKLCI (30-min intra-day chart), you will see a divergence between the index and market breather. We may deduce that the top 30 stocks (represented by FBMKLCI) were holding up relatively well while the broad market was deteriorating.


Chart 2: FBMKLCI's 30-min intra-day chart as at May 26, 2017 & Market Scoreboard (Source: Shareinvestor.com)


If you look thru the individual indices by market cap & segment, you will see the relative strength of the top 30 stocks is shared by the second liner stocks. FBM70 – which represents the 2nd liner stocks – is also holding up relatively well. See the chart below.


Chart 3: FBM70's weekly & daily chart as at May 26, 2017 (Source: Shareinvestor.com)

Next, we can see the lower end of the market is poised to drop further. FBMSCAP, FBMFLG & FBMACE - representing the 3rd liner stocks, the fledgling stocks & the ACE stocks - have broken their immediate uptrend lines (S1-S1). These stocks may continue to slide all the way back to the intermediate uptrend lines (SS) before the prices may stabilize.  


Chart 4: FBMSCAP's weekly & daily chart as at May 26, 2017 (Source: Shareinvestor.com)


Chart 5: FBMACE's weekly & daily chart as at May 26, 2017 (Source: Shareinvestor.com)


Chart 6: FBMFLG's weekly & daily chart as at May 26, 2017 (Source: Shareinvestor.com)


Hence you have to be careful not to be caught up with the potential slide in the lower end of the market for the next few weeks. We can only hope that FBMKLCI will stay above the 1770 mark; thus providing investors with a measure of stability in a volatile market. If FBMKLCI were to break the support at 1770, then the market will be bearish for quite a while. Your approach should be to reduce your exposure if the market consolidates from hereon.

Thursday, May 25, 2017

Dayang: Who's Afraid Of A Bigger Loss!

Results Update

For QE31/3/2017, Dayang reported a higher net loss of RM42.6 million as compared to a net loss of RM26.4 million reported in QE31/3/2016. With greater dependence on vessel chartering business, the first quarter has become a challenging quarter as vessel utilization got hammered by the monsoon season.

In addition, bottom-line was affected by lower work orders received (due to the decline in crude oil prices and well as the monsoon season) and realized and unrealized foreign exchange losses of RM2.1 million and RM6.0 million respectively (as opposed to RM41.3 million in unrealized foreign exchange gain in the preceding quarter).


Table: Dayang's last 8 quarterly results


Graph: Dayang's last 14 quarterly results

Prospects

Dayang's comment on its prospect has turned decidedly positive this quarter. It highlighted its contracts in hand of RM2.6 billion as well as tenders outstanding of RM5.0 billion which dovetailed nicely with the expected increased in topside maintenance business as per Petronas Activity Outlook for 2017-2019. Lastly, it offers a reward to its shareholders by distributing its shares in Perdana Petroleum Bhd as a dividend in specie by August this year.


Valuation

Dayang (closed at RM1.10 yesterday) is now trading at a trailing PER of 25x (based on last 4 quarters' EPS of 4.42 sen). At this PER, Dayang is deemed fully valued. However, the company's earning may be coming out of a trough and it could pick up steadily in line with improved outlook for the Oil & Gas sector.

Technical Outlook

Dayang appears to have bottomed out at RM0.80-0.90 in late 2016. The share price is likely to recover as its monthly MACD has already hooked up. Since MACD is still in negative territory and +DMI is still below -DMI, I do not expect a strong rally to begin any time soon.

  
Chart 1: Dayang's monthly chart as at May 25, 2017 (Source: ShareInvestor.com)


Chart 2: Dayang's weekly chart as at May 25, 2017 (Source: ShareInvestor.com)

Note: This morning Dayang dropped 10 sen to a low of RM1.00 and recovered convincingly to RM1.09 at the close of the morning session. Investors could have taken advantage of the sudden price drop (induced by the reported net loss) & scooped up the shares.   

Conclusion

Despite the seasonally poor financial performance, Dayang is a good stock for long-term investment in view of the recovery in the Oil & Gas sector.

Note:
I hereby confirm that I do not have any direct interest in the security or securities mentioned in this post. However, I could have an indirect interest in the security or securities mentioned as some of my clients may have an interest in the acquisition or disposal of the aforementioned security or securities. As investor, you should fully research any security before making an investment decision.

Coastal: Earning Soared!

Result Update

For QE31/3/2017, Coastal's net profit rose more than 4 times q-o-q or 64% y-o-y to RM27 million while revenue was mixed- up 11% q-o-q but down 67% y-o-y to RM64million. The Group reported a higher profit before tax of RM31.5 million in QE31/3/2017, an increase of over 2 times q-o-q from RM9.1 million, owing to higher operating margin earned as well as incidental income derived from the charter of JUGCSU. Profit before tax has leaped 69% y-o-y from RM18.6 million. The better showing was principally due to lower share-based payment expenses recognized and higher income generation from the charter of JUGCSU.


Table: Coastal's last 8 quarterly results


Graph: Coastal's last 51 quarterly results 

Valuation

Coastal (closed at RM1.36 yesterday) is now trading at a PE of 15 times (based on last 4 quarters' EPS of 9.03 sen). If the EPS for QE31/3/2017 can be maintained, Coastal's full-year EPS would be about 20 sen. This means Coastal's PER going forward could be lowered to 7 times! At this PER, Coastal looks attractive.

Technical Outlook

Coastal may have found strong support at the horizontal line at RM1.20. Its immediate resistance will be at the horizontal line at RM1.50. From MACD & ADX indicators, I surmise that Coastal has found its bottom and is poised for recovery.


Chart: Coastal's monthly chart as at May 24, 2017 (Source: Shareinvestor.com)

Conclusion

Based on satisfactory financial performance, Coastal is now a good stock for long-term investment. I revise my rating from a HOLD to a SLOW ACCUMULATION.

Note:
I hereby confirm that I do not have any direct interest in the security or securities mentioned in this post. However, I could have an indirect interest in the security or securities mentioned as some of my clients may have an interest in the acquisition or disposal of the aforementioned security or securities. As investor, you should fully research any security before making an investment decision.

CIMB: Earning Soared!

Results Update

For QE31/3/2017, CIMB's net profit rose 38% q-o-q or 45% y-o-y to RM1.18 billion while revenue rose 1% q-o-q or 17% y-o-y to RM4.36 billion. Four divisions saw better q-o-q PBT contribution:
  • Regional Commercial Banking (494%) due to the higher provisions in Thailand and Singapore in 4Q16
  • Wholesale Banking (30%) due to a stronger performance in corporate banking and improved capital market activity
  • Group Asset Management & Investments (64%) due to absence of investment impairments
  • Group Funding (46%) due to the goodwill impairment in 4Q16 and FX gains
The division with a lower PBT contribution is Consumer Banking and that's because of the absence of its Indonesia bancassurance fees which was recognized in 4Q16.


Table: CIMB's last 8 quarterly results

As a result of the improved performance, we can see that CIMB's bottom-line is now fast approaching the level of profit achieved in early 2014.


Graph: CIMB's last 23 quarterly results

Valuation

CIMB (closed at RM6.13 yesterday) is now trading at a trailing PER of 13.6x (based on last 4 quarters' EPS of 44.79 sen). At this PER, CIMB is deemed fairly valued.

Technical Outlook

CIMB is recovering nicely after testing its long-term uptrend line in early 2016. Its immediate resistance is at RM6.20-6.25. Can it surpass this level to test the next resistance at RM7.00? We will have to wait and see.

  
Chart: CIMB's monthly chart as at May 25, 2017 (Source: ShareInvestor.com)

Conclusion

Based on satisfactory financial performance & bullish technical outlook, CIMB could be a good stock for long-term investment.

Note:
I hereby confirm that I do not have any direct interest in the security or securities mentioned in this post. However, I could have an indirect interest in the security or securities mentioned as some of my clients may have an interest in the acquisition or disposal of the aforementioned security or securities. As investor, you should fully research any security before making an investment decision.

Wednesday, May 24, 2017

GDEX: Earning Dropped After The Festive Seasons

Recent Results

For QE31/3/2017, GDEX's net profit dropped 13% q-o-q but rose 9% y-o-y to RM8 million while revenue dropped 7% q-o-q but rose 14% y-o-y to RM61 million. Profits dropped q-o-q mainly due to decline in sales performance as a result of lesser e-commerce shipments after the festive season. At the same time, the Group reported increase in operating costs related to manpower, rental expenses and supplies costs on the back of business expansion and growth in e-commerce business transactions. Sales dropped q-o-q mainly due to lower e-commerce transactions after the festive season, as compared to immediate preceding quarter.


Table: GDEX's last 8 quarterly results

 
Graph: GDEX's last 33 quarterly results
 
Valuation

GDEX (closed at RM3.03 yesterday) commands a PER of 109 times (based on last 4 quarters' EPS of 2.78 sen). At this high PER, GDEX is very expensive.

Technical Outlook

GDEX had a scorching run after it broke above its horizontal line at RM1.80 in March this year. This came on the heel of its proposal for a 3-to-1 bonus (here). The ex-date has now been fixed at June 7 (here). The near-vertical rally is crazy & unsustainable.


Chart 1: GDEX's monthly chart as at May 23, 2017 (Source: ShareInvestor.com)


Chart 2: GDEX's daily chart as at May 23, 2017 (Source: ShareInvestor.com)
 
Conclusion

Despite the good financial performance & exciting prospect of the e-commerce sector, GDEX's high valuation is simply hard to justified. I recommend a SELL INTO STRENGTH.

Note:

I hereby confirm that I do not have any direct interest in the security or securities mentioned in this post. However, I could have an indirect interest in the security or securities mentioned as some of my clients may have an interest in the acquisition or disposal of the aforementioned security or securities. As investor, you should fully research any security before making an investment decision.

Tuesday, May 16, 2017

Market Outlook as at May 16, 2017


Two weeks ago I posted my market outlook which is likely to be "a decelerated uptrend market based on 3-fan uptrend lines". (here). One of the rules for the use of a 3-fan uptrend lines is that "(t)he violated uptrend line shall act as a resistance capping subsequent price rise".

Looking at the daily chart, we can see that FBMKLCI imay soon test the resistance from the violated uptrend line, S-S2 at 1795-1800. For example, it went to an intra-day high of 1787 this morning before correction set in. Where can FBMKLCI go in the near term?  


Chart: FBMKLCI's daily chart as at May 16, 2017_11.00 (Source: Shareinvestor.com)

If FBMKLCI can surpass the resistance of 1795-1800, it means that the sustainable uptrend line of S-S2 has prevailed. In that scenario, the market uptrend will be strong and outlook will be bullish.

The alternative scenario is that the test of the resistance at 1795-1800 will not succeed and the market will pullback. That's a neutral scenario of a market correction (a short-term negative) within an uptrend market (medium-term positive). I feel this is the more likely scenario. To work with this scenario, you should sell into strength for the next few days. I am talking about a partial profit-taking and not total sell-out.

In the medium-term (over 2-4 weeks time frame), we shall watch out for FBMKLCI staying above the uptrend line, S-S3 (currently at 1755). A breakdown of this uptrend line will be decidedly bearish for the market because "violation of S-S3.... would mean the end of the uptrend. There will not be another uptrend line, S-S4".

Good luck!

Tuesday, May 09, 2017

Harta: Bullish Breakout


In the past few weeks, I have noticed the steady decline in the share prices of Kossan & Topglov. I attribute the weakness in the share price to the strengthening of our MYR. Exporters receiving foreign currency proceed will be getting proceed in MYR. If they can sell forward in the past to protect their revenue (and assured themselves of their profit), this safeguard was withdrawn by BNM a few weeks ago. Hence. exporters are losing out as our MYR strengthens. All's fair in business & economy; what goes up must comes down!!


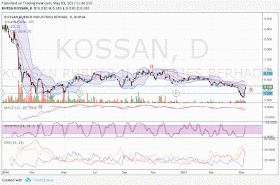
Chart 1: Kossan's daily chart as at May 9, 2017_11.45 (Source: Malaysiastock.biz)


Chart 2: Topglov's daily chart as at May 9, 2017_11.45 (Source: Malaysiastock.biz)
 
Strangely, Harta was able to maintain its share price at RM4.80-4.90 while Kossan & Topglov were sliding during that period. I noted the anomaly but did nothing about it. Yesterday Harta broke above the RM5.00 psychological after Kossan & Harta had a strong rebound over the past 2 days. 

 
Chart 3: Harta's daily chart as at May 9, 2017_11.45 (Source: Malaysiastock.biz)  

Today we are faced with the age-old dilemma in the stock market: Do you buy a stock that has declined or one had a bullish breakout? If we rephrase that choice between buying a cheaper stock versus a pricey stock, the answer is obvious! However, we "koew" why Kossan & Topglov dropped earlier but we don't know why Harta didn't drop. We "know" why Kossan & Topglov are rebounding but we don't know why Harta is breaking out to the upside. Again, we tend to go with what we know (or think we know). Thus, the choice is obvious. If you have been in the market long enough, and have a memory of an elephant, you will know that if you can't invest based on the obvious case.

My choice is to go with technical analysis. I will choose Harta for a bullish breakout, and to avoid Kossan & Topglov as their prices are in an intermediate downtrend. Good luck!

Friday, May 05, 2017

Commodities Complex In Trouble

When investors want to know the state of commodities complex, they will look at the Thomson Reuters/CoreCommodity CRB Index (TR/CC CRB or simply CRB). According to Wikipedia, this index provides dynamic representation of broad trends in overall commodity prices (here). After ten revisions, CRB index today is made up of 19 commodities that are quoted on the NYMEX, CBOT, LME, CME and COMEX exchanges. The 19 commodities that made up the index are Aluminum, Cocoa, Coffee, Copper, Corn, Cotton, Crude Oil, Gold, Heating Oil, Lean Hogs, Live Cattle, Natural Gas, Nickel, Orange Juice, Silver, Soybeans, Sugar, Unleaded Gas and Wheat.

These commodities are sorted into 4 groups:
  • Petroleum based products (based on their importance to global trade, always make up 33% of the weightings)
  • Liquid assets
  • Highly liquid assets
  • Diverse commodities.
CRB broke the line connecting its low for the past 12 months at 182 in late April. It struggled to hang onto the psychological 180 level for nearly 2 weeks. Yesterday it finally broke thru the 180 level and closed at 177.01.


Chart 1: CRB's daily chart as at April 4, 2017 (Source: Stockcharts.com)

The breakdown of CRB coincides with the breakdown of the uptrend line for WTIC on May 2. Yesterday, WTIC dropped 5% and broke thru the low of USD47 recorded in March to USD45.52!! Where's happening!

 
Chart 2: WTIC's daily chart as at April 4, 2017 (Source: Stockcharts.com)

Between Dow Jones trading near its all-time high and WTIC & CRB index breakdown, somewhere somethings are not going right! Of course, China!! We can see from the chart below, SSEC has broken below its uptrend line.
  

Chart 3: SSEC's daily chart as at April 4, 2017 (Source: Stockcharts.com)

The weakness in commodities and Chinese stocks could come to our shore. We should be careful in our investing approach and must avoid over-trading in the near term.

PRKCORP: Risk & Reward Go Together

All listed companies have 4 months to submit their Annual Reports ('ARs') to the exchange. If a company failed to do so, it will be given 5 market days to rectify its failure. The fifth day is known as the Suspension Deadline.

PRKCORP's FY2016 fell on Dec 31. It should have released its AR by 30 April 2017. The exchange has issued to PRKCORP a Suspension Deadline to submit the 2016 AR on or before 8 May 2017. Failure to do so would lead to the suspension of the trading in its shares with effect from 9.00 a.m., Tuesday, 9 May 2017 until further notice.

For the following reasons, you should not rush to sell your shares in PRKCORP.

1. PRKCORP is a profitable company, albeit reporting a loss in FY2016.

Diagram 1: PRKCORP's last 10 years' P&L (Source: Shareinvestor.com)

2. PRKCORP is financially healthy, with low borrowing & high liquidity position.

Diagram 2: PRKCORP's last 4 years' current & gearing ratios (Source: Shareinvestor.com)

3. For the above reasons, PRKCORP was subject to a privatization offer by its major shareholder, PKNP in 2014. The offer price was RM3.90! For more, read www.thesundaily.my/news/923309

4. This is not the first time the company exceeded its 4-month deadline for AR submission. It had happened 5 years in a row, in FY2010, FY2011, FY2012, FY2013 & FY2014.


via BursaMalaysia

In fact, you may consider buying the stock at the current price as the share price is not far from its long-term uptrend line. I think it is fairly a good buy at RM1.70-1.80.


Chart: PRKCORP monthly chart as at May 4, 2017 (Source: Shareinvestor.com)

Good luck!

Thursday, May 04, 2017

Market Outlook as at May 4, 2017

On April 11, I posted that FBMKLCI had broken its intermediate uptrend line (here). Fortunately, Morgan Stanley upgraded Malaysian stocks on April 21 (here), and that helped to power up our market until this week.

From Chart 1 below, you can see that the index nearly went above the violated uptrend line, SS. The failure to stay above the uptrend line, SS could lead to 3 possible price directions:
1) A bearish reversal into a downtrend (which I rate as an unlikely scenario)
2) A neutral sideways market (which I rate as a probable scenario)
3) A deceleration of the uptrend market (which I also rate as a probable scenario)


Chart 1: FBMKLCI's daily chart as at May 4, 2017 (Source: Malaysiastock.biz)

Between the 2 probable scenarios, I believe we are likely to see a decelerated uptrend market based on 3-fan uptrend lines (see the re-drawn FBMKLCI chart below). The idea behind the 3-fan uptrend lines is very simple: Markets continuously search for a sustainable uptrend line. Our current bullish market began with a steep uptrend line, S-S1, which was violated in mid-February. After that, the market transitioned into a more gradual uptrend line, S-S2, which was also violated in early April. Since then, the market could have potentially entered into its third uptrend line, S-S3.


Chart 2: FBMKLCI's daily chart as at May 4, 2017 (Source: Malaysiastock.biz)

There are 2 rules to follow:
1) The violated uptrend line shall act as a resistance capping subsequent price rise.
2) There could only be 3-fan uptrend lines; from S-S1 to S-S2 & finally to S-S3. The violation of S-S3, at 1745 would mean the end of the uptrend. There will not be another uptrend line, S-S4.

Hence, it is important that FBMKLCI should stay above S-S3 at 1745.

Note: I am very reluctant to use the 3-fan uptrend lines. The reason being I'm unable to attribute the rules governing this idea to anyone. I remember reading about it in a book a long time ago. Unfortunately I can't remember who's the author (possibly, Murphy) nor can I find it on the internet. I have to highlight this point because its veracity is uncertain. I also don't want anyone to think that I made it up for my convenience. Because it's not illogical, I continue to use it in my technical analysis.

FGV: What's Up!


FGV tumbled down badly over the past 3 days, from a high of RM2.10 on April 28 to an intra-day low of RM1.79 today. From the daily chart, we can see that FGV has broken its intermediate uptrend line, SS at RM2.00. It has just tested the support at the horizontal line at RM1.80.


Chart 1: FGV's daily chart as at May 4, 2017_4.00pm (Source: Malaysiastock.biz)

If it breaks below the RM1.80 support, it may go to RM1.40-1.50!


Chart 2: FGV's weekly chart as at May 4, 2017_4.00pm (Source: Malaysiastock.biz) 

The reason for the sharp decline is not because of the decline in CPO prices. Though CPO is still in an intermediate downtrend line, it has rebounded a bit in the past few days. In any event, other plantation stocks are holding up quite well.


Chart 3: CPO's chart as at May 4, 2017_4.00pm (Source: ifs.marketcenter.com)  

I believe the reason for the sharp decline is that Felda, the parent of FGV, is putting a squeeze on FGV to get a better deal on the land lease  agreement with FGV. This being an election year, only turn the heat up on Felda's political masters to get a good deal from the land lease agreement in order to reward the settlers. Any good deal for Felda will likely be a bad deal for FGV. For more, go here.

But the politicians must also be mindful that any excessive drop in FGV share price will anger these settlers, who are also shareholders of FGV. How to structure a win-win deal will be a true test for these politicians!

Based on the sharp decline in the share price over the past 3 days, FGV should be due for a rebound. Any further drop to the horrific low of RM1.50 will not be tolerated by anyone. If you are having FGV in your portfolio, you may be better off just holding on it than joining the sell side now.

MKH-OR: What's The Fair Value?

MKH is carrying out its rights issue exercise. The rights issue share costs RM1.89 each and there will also be a bonus issue "on the basis of two (2) Bonus Shares for every one (1) Rights Share subscribed for".

Whenever there is a rights issue exercise, you can compute the theoretical ex-right price after the entitlement date has passed. In practice (for trading purpose), we called it the ex-date to distinguish it from the entitlement date when the shares appear or remain on the list of shareholders.

MKH is well-passed the need to compute the theoretical ex-right price as the share has gone ex on April 28. Today is the first day of trading of the rights issue share entitlement or MKH-OR. MKH is now trading at RM2.35 & MKH-OR is trading at RM4.92 (as at 9:25am). Is that correct? How much is the MKH-OR?

The formula to compute MKH-OR (assumed to be "a") is as follows:

Cost of rights issue shares  + Cost of bonus shares = Value of new shares
1000 (OR price + subscription price) + (2000 x 0)  = (3000 x share price)
1000 (a + 1.89)                                   +  0               =   3000 x 2.35
a + 1.89                                                                    =    7050/1000 
a                                                                               =    7.05 - 1.89
a                                                                               =    5.16         

Of course, the market price of MKH-OR will always be at a slight discount to the computed value above but it shouldn't be too far away. Be guided accordingly in your trading.

Wednesday, May 03, 2017

IWCITY: A Bridge Too Far


In December 2015, TRX City Sdn Bhd (TRX City) announced that it had entered into the share sale agreement with IWH CREC Sdn Bhd (IWH CREC) for the latter to take a 60%-stake in the 485-acre Bandar Malaysia project. IWH CREC is a 60:40 JV company owned by Iskandar Waterfront Holdings Sdn Bhd (IWH) and China Railway Engineering Corp (M) Sdn Bhd (CREC).

In March this year, IWH announced a proposed merger of with its listed associate Iskandar Waterfront City Bhd (IWCity). This will effectively give the new IWH/IWCity a 36%-stake in the Bandar Malaysia project.

In addition to its stake in TRX City, the new IWH/IWCity will also own up to 7,400 acres of land fronting the sea between Johor Baru and Singapore. IWH currently owns 1,072 acres mainly located in Tebrau, Johor as well as 3,900 acres of waterfront land, of which 80% has been reclaimed.

TRX City announced 3 hours ago that that the Bandar Malaysia development agreement with IWH CREC has lapsed due to failure to meet the payment obligations outlined in the Conditions Precedent under the SSA. For more, go here.

Interestingly, IWH CREC has disputed claims by TRX City about 1 hour ago (here). It stated categorically: “IWH CREC is concerned with the content of the termination notice and the subsequent press release issued by TRX City, which, given the factual matrix, does not fully and accurately reflect the circumstances and conduct of the parties in this matter.” (Or, in plain English, you are not telling the truth!) I wonder whether there is a political angle to this break up. Maybe, too much drum-banging by this guy?

Happily Ever After It Was Not...

Without the Bandar Malaysia project, the IWH/IWCity merger could still go thru. However, the centerpiece of the merger is of course the stake in Bandar Malaysia. The potential collapse of the Bandar Malaysia deal would reduce IWH/IWCity to be just another Johor property stock. With that, I believe we could see a sharp correction in IWCity share price tomorrow. As the strong support is at RM1.75 - a long way down from its high perch above RM3.00 - I advise caution if you want to trade on this stock.  

Chart: IWCity's monthly chart as at May 3, 2017 (Source: Malaysiastock.biz)