Thursday, July 27, 2017

Pantech: Earning Imrpoved Further


Result Update

For QE31//5/2017, Pantech's net profit rose 24% q-o-q or 73% y-o-y to RM14 million while its revenue was mixed - down 1% q-o-q but up 22% y-o-y - to RM152 million. Net profit rose due to higher profit margin as a result of better product mix achieved.


Table: Pantech's last 8 quarterly results


Graph: Pantech's last 41 quarterly results

Valuation

Pantech (closed at RM0.635 yesterday) is now trading at a PE of 13 times (based on last 4 quarters' EPS of 4.99 sen). Dividend yield is decent at 3.4%. At these multiples, Pantech is priced fairly for a stock in the O&G sector where recovery is still a work in progress.

Technical Outlook

Pantech's monthly chart shows that the stock is on a recovery path.


Chart 1: Pantech's monthly chart as at July 26, 2017 (Source: Shareinvestor.com)

Its immediate resistance is the May high of RM0.66 & immediate support is its uptrend line at RM0.61.

 
Chart 2: Pantech's daily chart as at July 26, 2017 (Source: Shareinvestor.com)

Conclusion

Based satisfactory financial performance, fair valuation & positive technical outlook, Pantech is a good stock for long-term investment.

Note:

I hereby confirm that I do not have any direct interest in the security or securities mentioned in this post. However, I could have an indirect interest in the security or securities mentioned as some of my clients may have an interest in the acquisition or disposal of the aforementioned security or securities. As investor, you should fully research any security before making an investment decision.
Wednesday, July 26, 2017

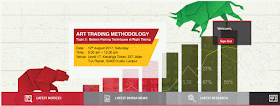
Kenanga To Host A Workshop On Art Trading Methodolgy

Kenanga has organized a workshop entitled "Art Trading Methodology: Bottom Fishing Techniques at Right Timing".


In ART Trading Methodology, traders are taught to look for specific trade setups, and to trade them regardless of the market conditions. That means traders can trade every single day whether the market is volatile or quiet, or the market is trending or ranging.

Agenda


Course Outline

C1. Identify Resistance
C2. Identify Support
C3. Bottom Fishing@ Right Timing: Buy on Dips Strategies
C4. Profit Taking@ Right Timing: Sell on Rally Strategies

Trainer Profile

Dr Thiti Tharasuk
Founder of "ART Trading Methodology"

Date & Time

Aug 12, 2017 (Saturday), 9:30am to 12:30pm

Venue

Kenanga Training Centre,
Level 17, Kenanga Tower,
237, Jalan Tun Razak
50 400 Kuala Lumpur

Restriction & Fee Payable

The workshop is free for clients of Kenanga with 6 months or more trading history. Clients who do not meet the requirement can still attend on payment of a small fee of RM120. Registration is compulsory.

For more detail, go here.

Gtronic: Earnings Continued To Rise

Result Update

For QE30/6/2017, Gtronic's net profit rose 51% q-o-q or 8% y-o-y to RM7.1 million while revenue rose 26% q-o-q or 10% y-o-y to RM63 million. Revenue & profits rose q-o-q due to higher volume loadings and commencement of mass production of new products from certain customers in the Group.


Table: Gtronic's last 8 quarterly results


Chart: Gtronic's last 46 quarterly results

Valuation 

Gtronic (closed at RM6.17 yesterday) is now trading at a PE of 64 times (based on last 4 quarters' EPS of 9.66 sen). At this elevated PER, Gtronic is priced to perfection. Any slightest shortfall in earnings will lead to huge disappointment and punishing price adjustment.

Technical Outlook

Who would have thought Gtronic could have such a strong rally over the past 12 months. From the low of RM2.60 in August 2016, Gtronic is ast approaching the January 2016 high of RM6.50.


Chart 1: Gtronic's monthly chart as at July 25, 2017 (Source: Shareinvestor.com)

A closer look at the daily chart reveals bearish divergence in the MACD as well as weakening of the uptrend momentum (with a drop-off in ADX). While indicators can alert us to be careful, there is still no breakdown in term of price action.


Chart 2: Gtronic's daily chart as at July 25, 2017 (Source: Shareinvestor.com)

However, when you compared the price chart with the earnings track record, you will see that there is a huge difference in Gtronic's profits recorded in 2016 & that's recorded today. That's why I am very wary of the super-bullish report for this stock.


Chart 3: Gtronic's monthly chart as at July 25, 2017 & its quarterly profits track record

Conclusion

Based on improving financial performance, Gtronic can be a good stock for long-term investment. However, its demanding valuation & the sharp rebound may lead to a correction in the near-term. Thus I am maintaining my rating of SELLING INTO STRENGTH to take profit if you have gotten into the stock in 2016 as I had recommended (here).

Note:

I hereby confirm that I do not have any direct interest in the security or securities mentioned in this post. However, I could have an indirect interest in the security or securities mentioned as some of my clients may have an interest in the acquisition or disposal of the aforementioned security or securities. As investor, you should fully research any security before making an investment decision.

Tuesday, July 25, 2017

Kenanga To Hold KenTrade Trading Challenge III

Kenanga will be hosting the third iteration of its popular trading game known as KenTrade Trading Challenge. The first game was held in 2015, and it drew in 15,000 participants. This year, Kenanga expects higher number of participants as investors become more tech-savvy, and are eager to use the opportunity to put into practice the investment techniques and lessons that they have learned. For more detail, go here.


I urge everyone who are keen in investing, to try out the game. You do not have to be a trader to know that there are many disciplines in trading that are equally applicable to investing. In fact, the adoption of these disciplines - money management, timing entry & exit and position sizing - could make for more successful medium-term investing. And, if you do well in the game, the rewards are very attractive.


Nexttrade will support gamers with trading ideas based on trend following, pattern breakout and range breakout. The challenge will begin on July 31. If you want to know how to take part, go here.

Presbhd: Game Changer Can Wait

In August last year, I posted a trading BUY call for Presbhd. At that point of time, Presbhd has tendered for a contract to upgrade our immigration system. Last week, Presbhd has announced that its 70%-owned subsidiary, Prestariang Services Sdn Bhd has finally secured the contract (here). The cost of developing the system is about RM1 billion and the work will take about 3 years. After that, it's entitled to collect RM294.7 million per annum for the next 12 years.

Market reaction to this game-changer for Presbhd was a big disappointment. Instead of a sharp price rally, we have a price drop! This obviously shows that investors are lukewarm about any project that involves large sum of investment and long gestation period. Then again, one should not be too surprised by the price drop if you look at the occasional bouts of selling over the past 2 years. However, if you draw a line connecting the recent bottoms, the stock should have support at RM1.85-1.90. If Presbhd can rebound back and stay above its long-term uptrend line at RM2.00, the technical outlook would still be positive. (As at 2.45pm, Presbhd was trading at RM1.95.)

Based on the project secured, I believe Presbhd is a good stock to consider for long-term investment.


Chart 1: Presbhd's weekly chart as at July 24, 2017 (Source: ShareInvestor.com)


Chart 2: Presbhd's monthly chart as at July 24, 2017 (Source: ShareInvestor.com)

Note:

I hereby confirm that I do not have any direct interest in the security or securities mentioned in this post. However, I could have an indirect interest in the security or securities mentioned as some of my clients may have an interest in the acquisition or disposal of the aforementioned security or securities. As investor, you should fully research any security before making an investment decision.

Tuesday, July 18, 2017

Padini: Possible Bullish Breakout

Padini may have a bullish breakout at RM3.65. Its immediate target could be RM4.00. For those who are keen to trade this breakout, I would suggest that you stagger your entry by buying in 2-4 tranches between RM3.70-3.80. A pullback to RM3.70 is possible but a drop below the breakout level of RM3.65 should be a warning that the play is over. (Note: Padini is at RM3.75 as ta 4.40pm.)


Chart: Padini's daily chart as at July 18, 2017_4.30pm (Source: Shareinvestor.com)

IBhd: Earnings Maintained But Unbilled Sales Dropped Further

Result Update

For QE30/6/2017, IBhd's net profit rose 6% q-o-q or 34% y-o-y to RM19.6 million while revenue rose 24% q-o-q or 47% y-o-y to RM128 million. IBhd's revenue and profit before tax rose q-o-q due to "the continuous growth of the Property Development segment".


Table: IBhd's last 8 quarterly P&L


Graph 1: IBhd's last 20 quarterly P&L

The company was upbeat about its future prospects due to the success of the Hill10 Residence @ i-City (previously named Converse @ i-City), a 204 exclusive luxury residences located above the DoubleTree by Hilton @ i-City Shah Alam, which has attained a current take-up rate of 70% after its launch in April. Nevertheless we can see that unbilled sales has been on the decline since June 2016. In term of quarters of sales, unbilled sales peaked in September 2015 at 12 quarters of sales and it has since declined to less than 3 quarters of sales in June 2017.
 

Graph 2: IBhd's unbilled Sales for last 20 quarters
 
Valuation

I-Bhd (traded at RM0.615 this morning) has a trailing PER of 8.7x (based on last 4 quarters' EPS of 7.04 sen). At this PER, I-Bhd is deemed fairly valued.

Technical Outlook

IBhd's gradual uptrend seems to have ended with the decline last week. For now, IBhd is likely to move sideways between RM0.56 & RM0.60.


Chart 1: I-Bhd's weekly chart as at Jul 17, 2017 (Source: Shareinvestor.com)


Chart 2: I-Bhd's monthly chart as at Jul 17, 2017 (Source: Shareinvestor.com)

Conclusion

Based on good financial performance and fair valuation, I assign a rating of HOLD for IBhd. Its share price performance is likely to be unexciting for the next few quarters due to mildly negative technical outlook and weaker revenue.

Note:

I hereby confirm that I do not have any direct interest in the security or securities mentioned in this post. However, I could have an indirect interest in the security or securities mentioned as some of my clients may have an interest in the acquisition or disposal of the aforementioned security or securities. As investor, you should fully research any security before making an investment decision.
 

Wednesday, July 12, 2017

Market Outlook: Is The Rally Over?

Yesterday I updated on the outlook of our market where I have noted that FBMKLCI has broken its intermediate uptrend line while FBM70, FBMSCAP & FBMFLG have broken their horizontal support or have a downside breakout of their price pattern. Thus the market outlook has turned negative for the next few weeks.

However I am cautiously optimistic that market may continue to go higher after this period of consolidation. After all, we should be rallying like the US markets. From the chart below, we can see that FBMKLCI is closely correlated to S&P500. I have pinpointed the peaks (A, B, C) & bottoms (X, Y, Z) for both markets. You may notice that we failed to follow US lead in the past 12 months. Why? You may also notice that we were trending lower in 1998 while US was in an uptrend. In both occasions, our ringgit was exceptional weak.


 Chart 1: S&P500 & FBMKLCI as at June 2017

If you look at the next chart - the USD-MYR pair and FBMKLCI - you will notice that FBMKLCI rallied strongly in 1999 after the MYR has stabilized. Today we can argue that the MYR has also stabilized. Thus there is a high chance that our market may do catching up with the US markets.


 Chart 2: FBMKLCI & USD-MYR as at June 2017

Now I will make an argument that we are poised to enter into the next up-cycle in the market- provided the MYR stabilizes and the US markets do not crash. Based on the 30-year chart of FBMKLCI, we can see that we had experienced 4 cycles; the peaks were in 1981, 1997, 2007 & 2014 while the bottoms in 1986, 1999, 2009 & 2016.


Chart 3: FBMKLCI 30-year chart

When will the developing cycle peak & the subsequent bottom? Based on the chart above and perusing the interactive chart of Shareinvestor.com, I arrived at the month the market peaked & bottomed in the last 4 cycles. After that, I did the following:
1) I counted the gap between the peaks as well as the bottoms (in months)
2) I averaged the gap between peaks & between bottoms in each cycle
3) I noted the narrowing of the gaps from one cycle to the next cycle
4) I assumed the narrowing persists for next cycle at the same rate as the immediate preceding cycle  


 Table: FBMKLCI: Cycles & Gaps

In the last column, you will see the gap to the next peak/bottom shall be 59 months after we take into account the narrowing of the gap of 26 months. With that, the next peak & bottom will be around April 2019 & September 2021.

I would advise you to take in my work with caution because cycle analysis is a tricky thing. In addition, the new cycle may be substantially change if MYR fails to stabilize or US markets crash. Nevertheless I believe that the prospect of the market entering its next up-cycle is not far-fetched. We would do well in the market if we avoid being overly bullish or overly bearish on the market. The best attitude to have is to be cautiously optimistic about the market.

Refinery Stocks: Crack Spread Error!

On June 21, I posted about the end of the rally for refinery stocks. The post coincided with the tail end drop in the two listed refinery stocks, PetronM & Hengyuan. Subsequently, both stocks recovered.


Chart 1: PetronM & Hengyuan's daily chart as at July 12, 2017 (Source: Shareinvestor.com)

For the next 2 weeks, I went back & checked on the chart for RBOB Gasoline Crack Spread Futures, Continuous Contract #1 at quandl.com (here) and I was perplexed by the recovery in our refinery stocks while the crack spread was still hooking down. After closer examination, I discovered that the chart on quandl.com was not updated. I was misled by the refreshed date (denoted as A) and data time period (denoted as B). In actual fact, the data points on the chart stopped somewhere in early March (look closely at the box denoted as C).


Screenshot of chart from quandl.com

That mistake prompted me to search for a new source of chart for crack spread. I found it at cmegroup.com (here) for the crack spread futures traded on NYMEX. The current weekly chart is given here. If you look at the chart below, you can see clearly that the crack spread futures recovered substantially in the past 3 weeks. That accounts for the recovery in the share prices of PetronM & Hengyuan.


Chart 2: Crack spread futures as at Jul 9, 2017 (Source: CMEGroup)

When I put the charts for crack spread futures and WTIC next to each other, I discovered the close correlation between crude oil prices and crack spread futures. How do refinery companies make abnormal profit?


Chart 3: WTIC & Crack spread futures as at Jul 9, 2017 (Source: Stockcharts.com & CMEGroup)

I found this comment in Quora to explain the outsize profit for refinery stocks:
Fuel prices tend to rise immediately upon news of higher oil prices, but refineries have often hedged against oil price rises and carry significant inventory.  During periods of rising prices, you can see modest increases in refinery profitability due to more valuable inventory and the positive effects of hedges made during low price periods.
The truly good times for refineries come when prices fall.  Margins explode because fuel prices will fall much more slowly than crude prices, and refineries delay their product price falls as much as possible in order to maximize profits.  This is common on the retail side of fuels as well, where a period of falling prices is often the only time retail fuel stations make better than break even on fuel.
Now we know better. So, the next time crude oil prices drop, you should consider buying refinery stocks.

Tuesday, July 11, 2017

Market Outlook as at July 11, 2017

Since my last post on market outlook on June 16, the market outlook has turned decidedly negative. In the last 2 days, FBM70 & FBMSCAP have broken their horizontal support. FBMFLG has broken the lower line of its symmetrical triangle. All in all, these 3 indices are poised to begin their downtrend.


Chart 1: FBM70's daily chart as at Jun 11, 2017_3.00 (Source: Shareinvestors.com)


Chart 2: FBMSCAP's daily chart as at Jun 11, 2017_3.00 (Source: Shareinvestors.com)


Chart 3: FBMFLG's daily chart as at Jun 11, 2017_3.00 (Source: Shareinvestors.com)

Before we get to FBMKLCI, let's look at the odd index in our market - FBMACE. This index consists of many technology stocks are able to stay near its May high. It performance is similar to the Technology index, which comprises technology stocks on the Main Board. I have put them side-by-side.


Chart 4: FBMACE & Technology's daily chart as at Jun 11, 2017_3.00 (Source: Shareinvestors.com)

FBMKLCI has broken below its "uptrend line" at 1775 in late June. Now it is struggling to stay above the horizontal line at 1760. If it fails to stay above this line - it is at 1754 now - then it may drop to 1720-1730. That was a strong resistance earlier and hopefully it will now play the role of a strong support.


Chart 5: FBMKLCI's daily chart as at Jun 11, 2017_3.00 (Source: Shareinvestors.com)


Chart 6: FBMKLCI's weekly chart as at Jun 11, 2017_3.00 (Source: Shareinvestors.com)

LPI: Steady Earnings Continued

Result Update

For QE30/6/2017, LPI's net profit dropped 3.5% q-o-q or 68% y-o-y to RM68 million while revenue rose 1.5% q-o-q or 4.0% y-o-y to RM353 million. PBT rose marginally q-o-q due to better underwriting experience, primarily driven by 18.6% growth in net earned premium income. PBT dropped 61.6% y-o-y mainly due to realized gain of RM150.4 million on  disposal of investment in quoted equities.


Table 1: LPIs last 8 quarterly results

For the past 2 years, LPI's earnings had been erratic due to realized gain from the disposal of quoted securities, mainly PBBank shares. I have presented below, the reported & adjusted earnings. We can see that bottom-line is rising in a steady manner.


Graph: LPI's last 46 quarterly results

Valuation

LPI (closed at RM18.60 yesterday) is now trading at a trailing PE of 20.7times (based on last 4 quarters' EPS of 89.72 sen which is substantially free from gain from sale of equity investment). LPI paid out dividend totaling 82 sen during the period. This means LPI has a decent DY of 4.4%.

Technical Outlook

LPI is in a long-term uptrend, with support from the 10-month SMA line at RM17.00.


Chart: LPI's monthly chart as at July 10, 2017 (Source: ShareInvestor.com)

 Conclusion

Based on good financial performance, fair valuation & positive technical outlook, LPI is still a good stock for long-term investment. I maintain my rating as BUY ON WEAKNESS at the 10-month SMA line at RM17.00.

Note:

I hereby confirm that I do not have any direct interest in the security or securities mentioned in this post. However, I could have an indirect interest in the security or securities mentioned as some of my clients may have an interest in the acquisition or disposal of the aforementioned security or securities. As investor, you should fully research any security before making an investment decision.

Wednesday, July 05, 2017

AEONCR: Earnings Stayed Strong

Result Update

For QE30/5/2017, AEONCR's net profit dropped 5% q-o-q but rose 21% y-o-y to RM76 million while revenue rose 4% q-o-q or 16% y-o-y to RM302 million. Revenue rose 16% y-o-y due to 17.4%-increase in financing receivables to RM6.669 billion. Other operating income, consisting of bad debts recovered, commission income from sale of insurance products and AEON Big loyalty program processing fees, rose 13% to RM31.16 million. This led to a 21%-increase in PBT as operating costs were well-controlled. For example, funding costs rose 17.7% due to increased borrowings (in line with increased financing receivables); NPL provisions crept up to 2.43% from 2.42% previously; and the ratio of total operating expense against revenue dropped to 58.2% as compared to 60.5% previously, due to higher growth in interest income and corresponding lower increase in operating expenses.


Table: AEONCR's last 8 quarterly results

As noted previously, AEONCR's net profit is at a new "high" territory! Other things to note are profit margin turning up again after a long slide and growth in revenue & profit continue to accelerate.


Graph: AEONCR's last 44 quarterly results

Proposed Capital Exercise

In late March, AEONCR announced a proposal for a Bonus Issue of 1-for-2 plus a Rights Issue of ICULs of 2-for-1 (which may be revised to 3-for-1 in the event the bonus issue is terminated). I highlighted the proposal which led to a price drop - which I rate as a buying opportunity (here). The first leg of this exercise will happen in less than 2 weeks' time. The ex-date of the 1-for-2 bonus issue has been fixed on July 14.

Valuation

AEONCR (closed at RM19.08 yesterday) is now trading at a PE of 10.34 times (based on last 4 quarters' EPS of 183.6 sen). At this PER, AEONCR is deemed fairly attractive. In addition, it pays a decent dividend with DY of 3.3% (based on last year dividend of  63 sen).

Technical Outlook

AEONCR is now at all-time high territory- after it broke above the 2013 high of RM18.80. It's in a descending triangle formation, with support at the lower line of RM19.00 & resistance at the sloping line at RM19.50. An upside breakout will lead to the continuation of the prior uptrend.


Chart 1: AEONCR's monthly chart as at july 4, 2017 (Source: Shareinvestor.com)


Chart 2: AEONCR's daily chart as at july 4, 2017 (Source: Shareinvestor.com)

Conclusion

Based on satisfactory financial performance, fairly attractive valuation, exciting growth prospect, generous bonus issue & positive technical outlook, AEONCR is a good stock for long-term investment.

Note:

I hereby confirm that I do not have any direct interest in the security or securities mentioned in this post. However, I could have an indirect interest in the security or securities mentioned as some of my clients may have an interest in the acquisition or disposal of the aforementioned security or securities. As investor, you should fully research any security before making an investment decision.

Tuesday, July 04, 2017

IWCITY: Broke the RM1.60 Support

IWCITY finally broke below the temporary support from the horizontal line at RM1.60 yesterday.


Chart 1: IWCity's monthly chart as at July 3, 2017 (Source: Shareinvestor.com)

With this breakdown, IWCITY is likely to slide to the next support at the horizontal line at RM1.40. The slow and long decline has recommenced. If the RM1.40 support is violated, it may go to the next horizontal line at RM1.20.


Chart 2: IWCity's weekly chart as at July 3, 2017 (Source: Shareinvestor.com)

By now, all hope of getting a slice of the Bandar Malaysia development is gone. IWCITY has returned to earth be just another property developer. The sweet memory of those heady days when it was Primus Inter Pares will linger on.  

Monday, July 03, 2017

Prlexus: Earning Plunged!

Results Update

For QE30/4/2017, Prlexus's net profit plunged 79% q-o-q or 54% y-o-y to RM1.6 million on the back of lower revenue which dropped 43% q-o-q or 15% y-o-y to RM62 million. Revenue dropped q-o-q mainly due to lower revenue from the apparel division. This led to the q-o-q drop in profits.

  
Table: Prlexus's last 8 quarterly results


Graph: Prlexus's last 35 quarterly results

Valuation

Prlexus (closed at RM1.55 last Friday) is now trading at a PE of 10.2 times (based on last 4 quarters' EPS of 16.25 sen). At this PER, Prlexus is deemed fairly valued. 

Technical Outlook

Prlexus has been consolidating between RM1.35 & RM1.65 for the past 1 year. In view of the poor result, the share price is likely to drop to the support at RM1.35. If the support at RM1.35 failed, Prlexus's downtrend may continue.


Chart 1: Prlexus's monthly chart as at Jun 30, 2017 (Source: ShareInvestor)


Chart 2: Prlexus's weekly chart as at Jun 30, 2017 (Source: ShareInvestor)

Conclusion

Despite the poor financial performance, Prlexus is rated a HOLD as it is trading at reasonable valuation. If Prlexus breaks below RM1.35, the HOLD rating will be revised to a SELL. 

Note:

I hereby confirm that I do not have any direct interest in the security or securities mentioned in this post. However, I could have an indirect interest in the security or securities mentioned as some of my clients may have an interest in the acquisition or disposal of the aforementioned security or securities. As investor, you should fully research any security before making an investment decision.