Wednesday, August 30, 2017

Spritzer: Earning Dropped

Result Update

For QE30/6/2017Spritzer's net profit rose 2.3% q-o-q but dropped 32% y-o-y to RM5.1 million. Revenue was mixed - rose 8.2% q-o-q but dropped 8.3% y-o-y to RM79 million. Profit before tax increased 8% q-o-q from RM7.1 million to RM7.6 million mainly due to higher revenue, which increased q-o-q mainly due to increased in average selling prices as well as sales volume increase due to festive season and hot weather. The increased revenue had more than offset 9%-increase in cost of sales and other operating expenses which was contributed by continued increase in PET resin costs and higher spending on advertising and promotion, in particular on SEA Games sponsorship.


Table: Spritzer's last 8 quarterly results


Graph: Spritzer's last 38 quarterly results

Valuation

Spritzer (closed at RM2.16 yesterday) is now trading at a PE of 9.8 times (based on last 4 "full" quarters' EPS of 22 sen). At this PER, Spritzer is still deemed very attractive for a consumer stock.

(Note: I have excluded the period ended 31/12/2016, which is actually a 1-month accounting period to reflect the change in financial year-end, in computing the last 4 quarters EPS.)

Technical Outlook

Spritzr is in a long-term uptrend line, with support at RM2.10.
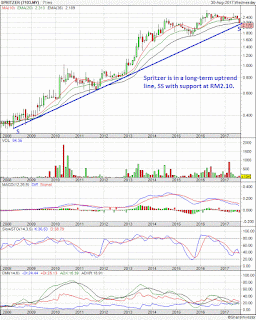

Chart 1: Spritzer's monthly chart as at Aug 30, 2017_11.30  (Source: ShareInvestor.com)

Spritzer is however trending lower for the past 12 months as the share price is trapped in a downward channel. The lower line may provide support for the share price at RM2.15. This plus the support from the long-term uptrend line, SS (as noted above) at RM2.10 means that the share price is likely to stabilize soon.


Chart 2: Spritzer's weekly chart as at Aug 30, 2017_11.30  (Source: ShareInvestor.com)

Conclusion

Despite weaker financial performance, Spritzer is a good stock to consider for long-term investment based on attractive valuation and positive technical outlook.

Note:
I hereby confirm that I do not have any direct interest in the security or securities mentioned in this post. However, I could have an indirect interest in the security or securities mentioned as some of my clients may have an interest in the acquisition or disposal of the aforementioned security or securities. As investor, you should fully research any security before making an investment decision.

Tuesday, August 29, 2017

Dialog: Breaking New High

Background

Dialog Group Berhad ("Dialog") is an investment holding company. Its subsidiaries are involved in the provision of engineering, procurement, construction and commission services and plant maintenance services. Dialog is also involved in the retailing of petroleum to oil, gas and petrochemical industries and marketing of specialty chemical and equipment.

Historical Financial Performance

Since its listing in 1996, Dialog's revenue has been on a steady growth path except for two periods: 2002-2006 and 2015-2016.


Graph 1: Dialog's last 19 years' P&L

Results Update

In QE30/6/2017, Dialog's net profit rose by 9.7% q-o-q or 32.9% y-o-y to RM104 million while revenue rose 6.1% q-o-q or 35.1% y-o-y to RM969 million. While revenue is still below the RM1 billion mark, Dialog has achieved a milestone as its net profit has surpassed the RM100 million!

The improved financial performance was “mainly attributable to higher contributions from the Group’s joint ventures which recorded an increase by 51.1% to RM107 million from RM70.8 million recorded in previous financial year”.

The Group’s Malaysia operation was “busy in the midstream and downstream activities with engineering, construction and fabrication works from various on-going projects such as the Pengerang Deepwater Terminal Phase 2, Jetty Topside works for Samsung in Pengerang and the construction of plasticizer plant for UPC Chemicals in Kuantan”.

The Group’s International operation also recorded a better financial performance “primarily driven by the increased downstream activities in Singapore and Saudi Arabia”.


Table: Dialog's last 8 quarters' P&L


Graph 2: Dialog's last 14 quarters' P&L

Latest Financial Position

Dialog's financial position as at 30/6/2017 is deemed satisfactory with current ratio at 1.7x while gearing ratio at 0.8x. Its cash & cash equivalent stood at RM1.425 billion- which nearly matches total borrowings of RM1.423 billion. If borrowings were netted off, gearing ratio would drop to 0.38x.

Valuation

Dialog (closed at RM2.03 yesterday) is now trading at a trailing PER of 30x (based on last 4 quarters' EPS of 6.7 sen). At this PER, Dialog is deemed fully valued. However, Dialog's earning grew by 26% last 4 quarters- which gives the stock a reasonable PEG ratio of 1.2x.

Technical Outlook

Dialog has broken above the psychological RM2.00 level. It also happens to be the upper line of a flag formation. This could mean that the stock could continue with its prior uptrend. If the breakout can gain sufficient support, the target price for this rally could be RM2.50.


Chart 1: Dialog's weekly chart as at Aug 28, 2017 (Source: ShareInvestor.com)


Chart 2: Dialog's monthly chart as at Aug 28, 2017 (Source: ShareInvestor.com)

Conclusion

Based on good financial performance and position, fair valuation for a growth stock & potential bullish technical outlook, Dialog could be a good stock for long-term investment.

Note:
I hereby confirm that I do not have any direct interest in the security or securities mentioned in this post. However, I could have an indirect interest in the security or securities mentioned as some of my clients may have an interest in the acquisition or disposal of the aforementioned security or securities. As investor, you should fully research any security before making an investment decision.

Monday, August 28, 2017

N2N: Earnings Boosted By Its New Subsidiary, AFE


Result Update

In QE30/6/2017, N2N's net profit rose 174% q-o-q or 247% y-o-y to RM9.9 million while its revenue rose 164% q-o-q or 182% y-o-y to RM30 million. Revenue rose y-o-y as a result of full consolidation of AFE Solutions Ltd's ("AFE") profit after its acquisition. In addition, the increase was also due to higher monthly variable matched trades.

Net profit rose y-o-y due to the full consolidation of AFE's results, the unrealised foreign exchange gain on USD loan of approximately RM3.85 million and fair value change on financial assets at fair value through profit or loss of RM0.79 million. Excluding the last 2 items, N2N's net profit would have been RM5.3 million for QE30/6/2017 - a 85%-increase from same quarter last year.


Table: N2N's last 8 quarters' P&L


Graph: N2N's last 15 quarters' P&L

Latest Financial Position

As at 30/6/2017, N2N's financial position is satisfactory, with current ratio of 8x and gearing ratio of 0.55x. In addition, it has net cash, FDs & financial assets totaling RM49 million (or, 10 sen per share).

Valuation

N2N (closed at RM0.73 last Friday) is now trading at a PER of 17x (based on annualized core EPS 4.4 sen). At this PER, N2N is deemed fairly attractive.

(Note: Annualized EPS is arrived at by dividing annualized net profit by number of shares outstanding of 477 million. Annualized net profit is computed by multiplying core net profit for QE30/6/2017 of RM5.30 million by 4.)

Technical Outlook

N2N is in a long-term uptrend line (SS) with support of RM0.70.


Chart 1: N2N's monthly chart as at Aug 25, 2017 (Source: ShareInvestor)


Chart 2: N2N's weekly chart as at Aug 25, 2017 (Source: ShareInvestor)

Conclusion

Based on good financial performance, healthy financial position, fairly attractive valuation & still positive technical outlook, N2N could be a good stock for long-term investment.

Note:
I hereby confirm that I do not have any direct interest in the security or securities mentioned in this post. However, I could have an indirect interest in the security or securities mentioned as some of my clients may have an interest in the acquisition or disposal of the aforementioned security or securities. As investor, you should fully research any security before making an investment decision.

Friday, August 18, 2017

IFCAMSC: Riding The Property Dragon

Background

IFCA MSC Bhd ("IFCMSC") is involved in the provision of IT business solution. Its area of specialty is the property industry where its solutions have found ready acceptance. It has expanded to other ASEAN countries as well as China.

Recent Financial Performance

IFCAMSC's financial performance was on a steady uptrend from 2008 until 2013. In 201, its revenue & profits took off. It peaked in 2015 and crashed down in 2016. The trajectory of its revenue & profits mirrors the health of the Malaysian property market, which peaked in 2015.

The sharp drop in IFCAMSC's profit in FY2016 was due to the following:
1) Drop in revenue due to the slump in the property market; and
2) Recognition of depreciation & amortization charges for developing its online portal Property365


Graph 1: IFCAMSC's last 10 years P&L

Recent Quarterly Result

In QE30/6/2017, IFCAMSC's net profit rose 50% q-o-q to RM2.5 million while revenue increased by 7% to RM20.6 million. In the same quarter last year, the company reported a net loss of RM535k. Revenue increased y-o-y mainly attributable to the higher sales contribution from our overseas segment and this has resulted in a higher profit before tax for the quarter.


Table: IFCAMSC's last 14 quarters P&L


Graph 2: IFCAMSC's last 14 quarters P&L

Financial Position

IFCAMSC's financial position as at 30/6/2017 is deemed healthy with current ratio at 3.9x and total liability to equity at 0.3x. Its cash reserve stood at RM69.6 million or RM0.11 per share.

Valuation

IFCAMSC (closed at RM0.41 yesterday) is now trading at a PER of 26x (based on last 4 quarters' EPS of 1.60 sen) or at a Price to Book of 2.3x (based on NTA per share of 18 sen). IFCAMSC paid out a 0.5 sen dividend last year- a drop from 1 sen dividend paid out in FY2015 & FY2014. If the dividend payment remains at 0.5 sen per share, then the dividend yield is only 1.2%. Overall, IFCAMSC is deemed fully valued. If its profit recovery can continue, then its share price will look more attractive and the price recovery can begin in earnest.

Technical Outlook

IFCAMSC rallied from a low of RM0.10 in 2014 to a high of RM1.80 in 2015- a dream came true for the lucky investors who owned the stock. Its long decline to a low of RM0.25 in 2016 is a nightmare that all investors would want to avoid.


Chart 1: IFCAMSC's monthly chart as at Aug 17, 2017 (Source: Shareinvestor.com)

IFCAMSC may have broken above its downtrend line, RR. If it can surpass the RM 0.50 level (from the line, AB), IFCAMSC recovery may begin.


Chart 2: IFCAMSC's weekly chart as at Aug 17, 2017 (Source: Shareinvestor.com)

Conclusion

Based on improving financial performance and healthy position, IFCAMSC could be a good stock for long-term investment.

Note:

I hereby confirm that I do not have any direct interest in the security or securities mentioned in this post. However, I could have an indirect interest in the security or securities mentioned as some of my clients may have an interest in the acquisition or disposal of the aforementioned security or securities. As investor, you should fully research any security before making an investment decision.

Vitrox: Earnings Continued To Rise

Result Update

For QE30/6/2017, Vitrox's net profit increased by 15% q-o-q and 48% y-o-y to RM21million while revenue increased by 12% q-o-q or 37% y-o-y to RM78 million. Both revenue and profit before tax have recorded an increase of 12% and 16% respectively. The increase in PBT was due to increase in revenue recorded for Machine Vision System (MVS) and Automated Board Inspection (ABI) plus other operating income generated from grant income.


Table: Vitrox's last 8 quarterly results


Chart 3: Vitrox's last 39 quarterly results

Valuation

Vitrox (closed at RM4.80 uesterday) is now trading at a PE of 30 times (based on last 4 quarters' EPS of 15.96 sen). At this PER, Vitrox is deemed fully valued. [Note: Vitrox has completed its 1-for-1 bonus issue in early July. Like most listed companies who carried out their bonus issue, the date of the bonus is conveniently put right after the end of a financial quarter. This gives rise to misleading comparison between EPS & share price. If you are not an existing shareholder, you will compare the share price with the reported but unadjusted EPS and come to the wrong conclusion on valuation.] 

Technical Outlook

Vitrox rose sharply after it broke above the RM2.00 horizontal line in late February (which coincided with its strong result for QE31/12/2016). The rise went exponential when the company proposed its bonus issue in May.

 
Chart 1: Vitrox's weekly chart as at Aug 17, 2017 (Source: Shareinvestor.com)

Vitrox may be pressing against the upper line of its upward channel. This line may act as a resistance, capping its upside until it has been taken out.


Chart 2: Vitrox's monthly  chart as at Aug 17, 2017 (Source: Shareinvestor.com)

Conclusion

Based on improving financial performance & bullish technical outlook, Vitrox could be a good stock for long-term investment. However, it may be a good idea to take some profit as the share price upside may be constrained by technical resistance.

Note:

I hereby confirm that I do not have any direct interest in the security or securities mentioned in this post. However, I could have an indirect interest in the security or securities mentioned as some of my clients may have an interest in the acquisition or disposal of the aforementioned security or securities. As investor, you should fully research any security before making an investment decision.

Thursday, August 17, 2017

PMetal: Earnings Stayed Strong

Results Update

For QE30/6/2017, PMetal's net profit increased by 1% q-o-q or 3% y-o-y to RM150 million while revenue rose 3% q-o-q or 31% y-o-y to RM2.079 billion.  Higher profit was mainly due to the strengthening of metal price during the current year quarter under review and continuous improvement in reducing the production costs


Table: PMetal's last 8 quarterly results


Graph: PMetal's 39 quarterly results

Aluminium Outlook


Contrary to my earlier post on aluminium outlook, prices shot up in the past 2 weeks from USD1985 a tonne to USD2100 a tonne today. Its immediate resistance is at the horizontal lines at USD2100 and USD2200.


Chart 1: Aluminium's monthly chart from 2009 to Aug 2017 (Source: Investing.com)

Prospect

PMetal is fairly confident that its financial performance this year will be satisfactory. This is based on the following:
Aluminium price continues to increase as more and more production cuts are being announced in China according to the government supply reform policy. As a result, the China smelting production is expected to slow down and the world’s supply and demand will tilt towards a deficit situation which will support long term aluminium price performance.
 Our smelting operations will continue to run at full capacity for the remaining of the year with demand continues to be well supported. We will remain focused on expanding our value-added products and improving the overall operation efficiency.


Valuation

PMetal (closed at RM3.34 at end of morning session today) is now trading at a PER of 21 times (based on last 4 quarters' EPS of 16.25 sen). Based on this PER, PMetal is deemed fairly valued.

Technical Outlook

PMetal broke above its recent high of RM3.00. This leads to the continuation of its prior uptrend.


Chart 2: PMetal's weekly chart as at Aug 16, 2017 (Source: ShareInvestor.com)

PMetal was rising in a long-term upward channel up until January this year. At the start of the year, PMetal broke above the upper line at RM1.70 and shot up.


Chart 3: PMetal's monthly chart as at Aug 17, 2017 (Source: ShareInvestor.com)

Conclusion

Based on strong financial performance, fair valuation and bullish technical outlook, PMetal is a good stock for long-term investment.

Note:

I hereby confirm that I do not have any direct interest in the security or securities mentioned in this post. However, I could have an indirect interest in the security or securities mentioned as some of my clients may have an interest in the acquisition or disposal of the aforementioned security or securities. As investor, you should fully research any security before making an investment decision.

Thursday, August 10, 2017

CEPAT: Too Slow For Comfort

Result Update

For QE30/6/2017, Cepat's net profit increased by 56% q-o-q or 91% y-o-y to RM9.7 million while turnover rose 19% q-o-q or 37% y-o-y to RM70 million. Profits rose q-o-q due mainly to an increase in FFB production and export of electricity by 27% and 21% respectively while the oil mill also contributed by giving a higher milling margin. CPO and PK selling price decreased by 14% and 39% respectively.

 
Table: Cepat's last 8 quarterly results

Graph: Cepat's last 43 quarterly results

Valuation

Cepat (at RM0.84 yesterday) is trading at a PE of 8 times (based on adjusted last 4 quarters' EPS of 10.48 sen) as well as trading at only 0.5x its book value (based on NTA of RM1.57 per share as at 30/6/2017).At these multiples, Cepat is deemed fairly attractive.

Technical Outlook

Cepat is still in an intermediate downtrend line. If it can break above this downtrend line at RM0.94, Cepat may begin its next upleg.

Chart: Cepat's monthy chart as at November 16, 2016 (Source: Malaysiastock.biz)

Conclusion

Based on improving financial performance & attractive valuation, Cepat could be a good stock for long-term investment.

Note:

I hereby confirm that I do not have any direct interest in the security or securities mentioned in this post. However, I could have an indirect interest in the security or securities mentioned as some of my clients may have an interest in the acquisition or disposal of the aforementioned security or securities. As investor, you should fully research any security before making an investment decision.

Wednesday, August 09, 2017

Harta: Earning Growth Continued

Result Update

For QE30/6/2017, Harta's net profit rose 8% q-o-q or 72% y-o-y to RM96 million while revenue rose 14% q-o-q or 50% y-o-y to RM601 million. Revenue rose q-o-q due to increase in sales volume and average selling price. Profit before tax dropped 2.3% q-o-q mainly due to higher upkeep cost, depreciation expense, packaging material cost, chemical cost and term loan interest expense.


 Table: Harta's last 8 quarterly results


Graph: Harta's last 39 quarterly results

Valuation

Harta (closed at RM7.15 yesterday) is trading at a trailing PER of 36 times (based on last 4 quarters' EPS of 19.68 sen). At this PER, Harta is overvalued.

Technical Outlook

Harta is in a long-term uptrend line, with strong support at the 20-month EMA line at RM5.00. Harta needs to consolidate its recent gain and/or wait for its profit to grow further before the uptrend can continue.


Chart: Harta's monthly chart as at Aug 8, 2017 (Source: shareinvestor.com)

Conclusion

Based on improved operating performance, strong leadership in the rubber glove sector & capable management team, Harta is considered a good stock for long-term investment. Its rating is kept at HOLD due to its demanding valuation.

Note:
I hereby confirm that I do not have any direct interest in the security or securities mentioned in this post. However, I could have an indirect interest in the security or securities mentioned as some of my clients may have an interest in the acquisition or disposal of the aforementioned security or securities. As investor, you should fully research any security before making an investment decision.

Tuesday, August 08, 2017

Market Outlook as at August 8, 2017

With each passing day, our main index is becoming more and more like a Potemkin village- a beautiful facade that hides the carnage unseen by the general public. Today is no different: The index - by that I mean FBMKLCI - was up 3.7 points while the scoreboard was showing losers outnumbering gainers by 602 to 269! Who can we believe- the index or the scoreboard?! 


Chart 1: FBMKLCI's daily chart as at Aug 8, 2017_12.30 (Source: Shareinvestor.com) 

After you've glanced at FBM70, FBMSCAP & FBMFLG, the true state of the market revealed itself. Our market has weakened steadily over the past few weeks. The sudden selldown for some high-flyers is a warning sign of more selling to come.


Chart 2: FBM70's daily chart as at Aug 8, 2017_12.30 (Source: Shareinvestor.com) 


Chart 3: FBMFLG's daily chart as at Aug 8, 2017_12.30 (Source: Shareinvestor.com) 


Chart 4: FBMSCAP's daily chart as at Aug 8, 2017_12.30 (Source: Shareinvestor.com) 

Even the brave FBMACE may be waving the white flag. It could have broken below its uptrend line. This is supported by the -DMI trending above the +DMI. Fortunately, MACD is still above the zero line, which means that the downtrend has not started for FBMACE.


Chart 5: FBMACE's daily chart as at Aug 8, 2017_12.30 (Source: Shareinvestor.com) 

Two months ago I wrote about the weakness in the market and the possible correction that will come which will present better opportunity to buy stocks at more attractive prices. Our market has been correcting ever since and prices are definitely more attractive now than in June. In times like this, you must avoid the urge to trade for small gain. Instead you must stiffen your resolve to invest for the long-term and to weather the short-term pain that will inevitably come as some of your stocks will sustain short-term losses before the market comes back. Good luck!

AEONCR: Rights Issue Selling

AEONCR's share price has risen substantially from a low of RM2.00 in 2011 to RM13.00 today. The price rally was due to the company's impressive profit track record (see the chart below).


Chart 1: AEONCR's monthly chart as at Aug 7, 2017 & quarterly profit during that period

A cursory glance at the above chart will reveal the fact that the share price from 2013 till today has been rather disappointing compared to the profit increase. The main reason for the lag in the share price performance is because of the sharp increase in gearing ratio as the company borrowed to fund its advances. See the next graph and table below.


Graph: AEONCR's gearing ratio over the past 10 years


Table: AEONCR's Financial Position over the past 10 years

The above table actually masked the acute increase in borrowing as part of the borrowing took the form of Perpetual Private Debt Securities, which has been classified under Total Equity. This PDS - amounted to RM276 million as at May 31, 2017 - is due for settlement in 2018. The interest rate of this debt instrument is rather high at 6.5%.

AEONCR is now carrying out a Rights Issue of ICULS in order to retire the PDS. The ex date of this Rights Issue is August 11. The ICULS is convertible to share at an exercise price of RM10.99. The mode of conversion is by surrendering 10990 ICULS in exchange for 1000 ordinary shares. The theoretical ex rights price should be about RM12.50 (assuming the share price is at RM12.80 on the last cum date).


Note on the mode of exercising the conversion of ICULS to shares

Due to poor market sentiment, AEONCR is now under heavy selling as investors are trying their best to avoid owning a stock where they will have to cough out money to subscribe for its Rights Issue.


Chart 2: AEONCR's daily chart as at Aug 8, 2017_12.30 (Source: Shareinvestor.com)

Before you join this charge of the Light Brigade, there are 2 things that you need to consider:

1) The Rights Issue is extremely small. 

If you own 1000 AEONCR now, you are entitled to subscribe for 2000 ICULS at RM1.00 each (or, total amount of the subscription money of RM2000 only). If you don't want to subscribe for the rights, you can sell it off but the price will be very minimal (about RM0.13 per unit). If you choose to just ignore it, it also fine as the opportunity loss is about RM260 for 2000 rights (though it's a sin to throw good money away).

2) The Rights Issue will rectify the gearing position somewhat

As mentioned above, the concerned about AEONCR's gearing ratio - the irony of paying a stiff  price being too successful - will be somewhat addressed. I say "somewhat addressed" because AEONCR is growing at such rapid pace, it will soon need to raise more fund. Thus investors have to ask them this question: Are you investing in good companies that's growing at rapid pace or companies that's good at financial engineering initiatives like bonus issue & share splits. The sad fact is that Bursa Malaysia today is rewarding companies in the latter categories and that will not make us a world class exchange.

Instead of charging in to sell your AEONCR, you may want to consider getting into this stock which has grown steadily over the past 6-7 years while paying out good dividend (at a yield of 4.9%).
Note:

I hereby confirm that I do not have any direct interest in the security or securities mentioned in this post. However, I could have an indirect interest in the security or securities mentioned as some of my clients may have an interest in the acquisition or disposal of the aforementioned security or securities. As investor, you should fully research any security before making an investment decision.

Tuesday, August 01, 2017

UTDPLT: Earning Soared

Background

Unoted Plantation Bhd ("UTDPLT") is involved in the cultivation and processing of palm oil, coconut and other plantation crops in a sustainable manner. Its estates are located in Malaysia and Indonesia, covering a total area of 50,855 hectares. For more, go here.

Historical Financial Performance

UTDPLT's top-line and bottom-line are both approaching the high recorded in FY2011. If profits can surpass the level achieved in FY2011, UTDPLT's share price may break to new high- similar to the 2010 upside breakout of the RM12.00 mark which led to the rally to RM27 by 2015. This is the basis for a call to track UTDPLT financial performance fro the next 1-2 quarters in anticipation of profit & price breakout.


Graph: UTDPLT's last 52 quarters' P&L
 
Recent Financial Results

For QE30/6/2017, UTDPLT's net profit rose 41% q-o-q or 52% y-o-y to RM110 million while revenue was mixed - down 6% q-o-q but up 28% y-o-y - to RM355 million. Profits rose q-o-q due to better financial results from its plantation & refinery divisions. The plantation division registered a 41.8% increase in the profit before tax in the current quarter from the previous quarter mainly due to a combination of higher production of CPO and PK, lower cost of production of CPO and a higher average CPO price achieved. The refinery recorded a 36.3% increase in profit before tax mainly due to more favorable hedging and trading positions.


Table: UTDPLT's last 8 quarterly P&L

Prospects For FY2017

Like other plantation companies, UTDPLT enjoyed recovery in palm oil production after the passing of El Nino in 2015-2016. To cap it off, crude palm oil prices had rallied due to concern that the recovery in overall palm oil production for the full year 2017, may not be as large as initially expected. Higher prices and output are likely to lead to a satisfactory year for FY2017.

Valuation

UTDPLT (closed at RM28.20 in the morning session) is now trading at a PER of 15.2x based on last 4 quarters' EPS of RM1.85. Its dividend yield is quite decent at 4.1%.

Technical Outlook

UTDPLT is in an uptrend with support from its 10-month SMA line at RM27.00. That support also coincides with the support from the horizontal line.


Chart 1: UTDPLT's monthly chart as at July 31, 2017 (Source: ShareInvestor.com)


Chart 1: UTDPLT's monthly chart as at July 31, 2017 (Source: ShareInvestor.com)

Conclusion

Based on good financial performance, fair valuation & positive technical outlook, UTDPLT could be a good stock for long-term investment.

Note:

I hereby confirm that I do not have any direct interest in the security or securities mentioned in this post. However, I could have an indirect interest in the security or securities mentioned as some of my clients may have an interest in the acquisition or disposal of the aforementioned security or securities. As investor, you should fully research any security before making an investment decision.

Perstim: Earnings Dropped Sharply


Results Update

For QE30/6/2017, Pertima's net profit dropped 82% q-o-q or 76% y-o-y to RM2.8 million while revenue rose 2% q-o-q or 35% y-o-y to RM237 million. Revenue rose q-o-q due to higher selling price despite lower sales volume. Profit dropped q-o-q due to lower profit margin coupled with lower sales volume. Profit margin declined as the Group was not able to pass through the production cost hike to customer in order to maintain price competitiveness for the period under review.


Table: Perstim's last 8 quarterly P&L


Graph: Perstim's last 52 quarters' P&L

Future Prospects

The comment in the accounts highlighted the "operating environment to remain challenging and competitive due to greater presence of imports from overseas, in addition to the volatility of Ringgit Malaysia against the United States Dollar". This coupled with the heightened competition - where it is unable to pass through the production cost hike to customer - means that the Group may go thru a period of lower profit.

Tin Prices Trend

Tin prices are at 18-month high. If this price regime persists, Perstim's profit may remain weak going forward.

Chart 1: Tin's monthy chart as at July 25, 2017 (Source: Infomine)

Valuation

Perstim (closed at RM8.10 yesterday) is now trading at a trailing PER of 17 times (based on last 4 quarters' EPS of 46.5 sen). With a dividend payout of 40 sen, Perstim's DY is at an attractive 4.9%. However the dividend payout may not be sustainable if the Group's profit doesn't rebound back quickly.

Technical Outlook

Perstim is in a long-term uptrend line with support at the 10-month SMA line of RM7.50. 


Chart 2: Perstim's monthly chart as at July 31, 2017 (Source: ShareInvestor.com)  

Conclusion

Based on challenging operating environment, weaker financial performance & demanding valuation, I believe it is a good idea to take some profit on Perstim.

Note:

I hereby confirm that I do not have any direct interest in the security or securities mentioned in this post. However, I could have an indirect interest in the security or securities mentioned as some of my clients may have an interest in the acquisition or disposal of the aforementioned security or securities. As investor, you should fully research any security before making an investment decision.