Wednesday, December 29, 2021

SCGM: Earnings Continued To Stall

 Results Update

In QE31/10/2021 (2Q22), SCGM's net profit dropped 6% q-o-q or 19% y-o-y to RM7.8 million while revenue increased 5% q-o-q or 19% y-o-y to RM72.5 million. 

For 2Q22, the Group revenue increased 5% q-o-q "resulting from higher sales of F&B packaging and extrusion sheet. Local sales increased by 4.7% to RM49.207 million from RM46.990 million in 1Q22 while export sales increased by 4.6% to RM23.335 million from RM22.312 million in 1Q22. Despite the 4.7% increase in Group revenue, the Group’s profit before tax decreased marginally by 0.1% to RM9.872 million in 2Q22 compared to profit before tax of RM9.880 million in 1Q22 mainly due to costs of COVID-19 vaccination exercise and related expenses for workers and loss on foreign exchange during the current quarter. The Group recorded 5.6% lower net profit of RM7.825 million in 2Q22 versus RM8.289 million in the preceding quarter due to higher deferred tax expenses".

 
Table: SCGM's last 8 quarterly results

 
Graph: SCGM's last 51 quarterly results

Financial Position

SCGM's financial position is deemed healthy with current ratio at 1.65 times while gearing ratio is elevated at 0.55 time.

Valuation

SCGM (closed at RM2.42 yesterday) is now trading at a PE of 15X (based on the last 4 quarters' EPS of 16.54sen).  At this PE, SCGM is deemed fairly attractive.

Technical Outlook

SCGM's medium-term uptrend may have ended after the share prices went below the uptrend line, SS. Its next support should be at the horizontal line at RM2.35.


Chart 1: SCGM's daily chart as at  Dec 28, 2021 (Source: iSaham.my)


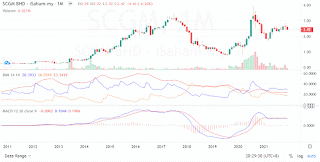
Chart 2: SCGM's monthly chart as at  Dec 28, 2021 (Source: iSaham.my)

Conclusion

Despite the weaker financial performance, SCGM is still a good stock for long-term investment based on healthy financial position & fair valuation,

Note:

I hereby confirm that I do not have any direct interest in the security or securities mentioned in this post. However, I could have an indirect interest in the security or securities mentioned as some of my clients may have an interest in the acquisition or disposal of the aforementioned security or securities. As investor, you should fully research any security before making an investment decision.

Friday, December 10, 2021

Topglov: Revenue & Profits Have Landed

Result Update

For QE30/11/2021 (1QFY2022), Topglov's net profit dropped 69% q-o-q or 92% y-o-y to RM186 million while revenue dropped 25% q-o-q or 67% y-o-y to RM1.584 billion. The Group’s weaker quarter-on-quarter performance for 1QFY2022 was mainly attributed to declining average selling prices ('ASPs') and higher operating costs as a result of lower utilisation rates, while raw material costs reduced at a much slower pace in comparison to glove ASPs, thereby impacting profit. Raw material prices for the quarter ended 1QFY2022 have reduced from 4QFY2021, with average natural latex concentrate prices reducing by 8% from RM5.54/kg to RM5.09/kg, whilst nitrile latex price fell 19% from USD2.21/kg to USD1.79/kg.


Table: Topglov's last 8 quarterly results

Looking at the quarterly result graph below, we can see that revenue, profits and even profit margins are now lower than QE31/5/2020. Not surprisingly, dividend is lower than that paid out in QE31/5/2020.


Graph: Topglov's last 77 quarterly results

The perennial qustion - are we there yet? - has to be asked. To be frank, I don't think anyone has a quick answer. The mismatched between increased supply and reduced demand could lead to a period of lower ASPs. If that's a serious problem, imagine what would happen if a price war broke out. You may ask why would anyone engage in a price war at a time like this. The need to increase sales to match the increased capacity, would drive the players to engage in a price war! 

The price war would lead to lower revenue & lower contribution. With lower contribution, you would not be able to cover the increased overhead expenses from the increased capacity. You may note that Topglov's Property, Plant & Equipment has risen by 42% from RM2.874 billion as at May 2020 to RM4.090 billion as at November 2021. 

Based on the above, I think the prospect of further decline in profit cannot be ruled out.

Financial Position

As at 30/11/2021, Topglov's financial position is deemed healthy with current ratio at 2.0 times and Total liabilities to Total equity at 0.30 time.

Valuation

Topglov (closed at RM2.18 as at 4.05 pm) is now trading at a PE of 23 times (based on annualized EPS of 9.28 sen). That's a fair valuation if we assumed that Topglov's profit remains steady at current level. As discussed above, the prospect of lower profits or even losses, could not be discounted.

Its planned listing on the HKEX may give an indication of the management's "outlook" for the share price (here). The amount it plans to raise from its proposed Hong Kong listing is about RM2.21 billion. The number of shares it will issue for the Hong Kong listing remains at 793.5 million shares. That means the IPO price will be about RM2.785 per share. However, things are moving so fast that the expected share price may not be achieved. Nevertheless, this is an indication of the internal thinking of its management.

Technical Outlook

Topglov's downtrend after peaking in October 2020, is still intact. The immediate support is the psychological level of RM2.00.


Chart: Topglov's daily chart as at Dec 10, 2021 (Source: isaham.my)

Conclusion

Based on the current poor financial performance and industrial outlook, Topglov is a stock to be avoided.

Note:

I hereby confirm that I do not have any direct interest in the security or securities mentioned in this post. However, I could have an indirect interest in the security or securities mentioned as some of my clients may have an interest in the acquisition or disposal of the aforementioned security or securities. As investor, you should fully research any security before making an investment decision.

Wednesday, June 30, 2021

HIAPTEK: Earnings Remained Strong

Results Update

For QE30/4/2021, Hiaptek's net profit rose 117% q-o-q or 12-fold to RM66 million while revenue was mixed- down 7% q-o-q but up 100% y-o-y to RM330 million. Its revenue decreased by 7% q-o-q due to lower sales volume for both the Trading and Manufacturing divisions attributable to the Chinese New Year holidays in February 2021. Despite the lower revenue, Profit from Operations increased by 67% to RM63.53 million due to higher steel prices and cost optimization efforts undertaken during the quarter under review. "Together with an improved contribution from the JV entity of RM19.81 million in the current quarter as compared to RM2.88 million in the immediate preceding quarter, the Group recorded a 114% improvement in Profit before Tax to RM80.16 million in 3Q2021 as compared to RM37.42 million in 2Q2021". 

The company is positive on its outlook, post lockdown, given the strength of steel prices and the JV entity’s continuous investments in plant and equipment to achieve cost efficiencies. The JV entity’s first 200,000 tonnes of coke oven plant is expected to complete by the second half of 2021, in which substantial cost savings can be achieved. For more, go here.


Table: Hiaptek's last 8 quarterly results


Graph: Hiaptek's last 70 quarterly results

Financial Position

Hiaptek's financial position as at 30/4/2021 is deemed satisfactory with current ratio at 1.63 times and gearing ratio at 0.49 time. 

Valuation

Hiaptek (closed at RM0.565 yesterday) is now trading at a PE of 6.8 times (based on last 4 quarters' EPS of 8.29 sen). At this PE ratio, Hiaptek is deemed fairly attractive.

Technical Outlook

Hiaptek has broken above its long0term downtrend line at RM0.20 in September 2020.

 
Chart 1: Hiaptek's monthly chart as at Jun 29, 2021 (Source: Kenanga BTX)

Hiaptek then rallied to a high of RM0.70 in May 2021. Like other steel stocks, Hiaptek has corrected substantially in the past few weeks. However it is still in an uptrend line with support at RM0.52. 


Chart 2: Hiaptek's weekly chart as at Jun 29, 2021 (Source: Kenanga BTX)

Conclusion

Based on improved financial performance & financial position, reasonable valuation and mildly bullish technical outlook, Hiaptek is a good stock for medium-term investment.

Note:

I hereby confirm that I do not have any direct interest in the security or securities mentioned in this post. However, I could have an indirect interest in the security or securities mentioned as some of my clients may have an interest in the acquisition or disposal of the aforementioned security or securities. As investor, you should fully research any security before making an investment decision.

Tuesday, June 29, 2021

Market Outlook as at 29 June 2021

Yesterday, FBMKLCI dropped 15 points to close at 1545. The break below 1550 level may lead to an acceleration of the decline in our market. While the index may rebound back above the 1550 mark, the steady flow of negative news has instilled a level of fear among investors and traders, which until recently were driven by unchecked greed. If the market failed to climb back above 1550, then it will quickly slide to the next support at 1520 or the immediate psychological level of 1500.  

Chart 1: FBMKLCI's daily chart as at Jun 28, 2021 (Source: Kenanga BTX)

Chart 2: FBMKLCI's weekly chart as at Jun 28, 2021 (Source: Kenanga BTX)

Thus yesterday's announcement by the Prime Minister of a new aid package, known as the National People’s Well-Being and Economic Recovery Package (PEMULIH) totaling RM150 billion is critical in the effort to help the people & businesses that have been badly hit by the pandemic (here). If this belated aid package can achieve its objectives, then our economy can stabilize and will have a decent chance of recovery once the pandemic has been brought under control. If it failed to do so, then our economic recovery, post the pandemic, will be a Herculean task.

SCGM: Steady Earnings Growth Continued

Results Update

In QE30/4/2021(4Q21), SCGM's net profit dropped 6% q-o-q or rose 11% y-o-y to RM7.6 million while revenue increased 5% q-o-q or 32% y-o-y to RM66 million. 

The Group Revenue increased q-o-q resulting from 13%-increase in local sales to RM46.106 million from RM40.757 million (due to higher deliveries of F&B packaging due to higher demand in general) which offset the 9.8% decline in export sales to RM19.638 million from RM21.768 million (due to lower sales of F&B packaging, in line with the past trend in which export sales would be higher during the few months prior to Christmas and New Year). 

The Group recorded a 24% higher profit before tax of RM9.792 million, which is in line with higher local sales recorded in 4Q21. Despite the increase in revenue, the Group recorded 6% lower net profit of RM7.621 million due to higher income tax expense and deferred tax expense.

 
Table: SCGM's last 8 quarterly results

 
Graph: SCGM's last 49 quarterly results

Financial Position

SCGM's financial position is deemed healthy with current ratio at 1.55 times while gearing ratio is elevated at 0.62 time.

Valuation

SCGM (closed at RM2.45 yesterday) is now trading at a PE of 14 X (based on the last 4 quarters' EPS of 17.36 sen).  At this PE, SCGM is deemed fairly attractive.

Technical Outlook

SCGM has been on a steady rise, from the low of RM1.69 recorded in March this year. It is rising on an uptrend line, with support at RM2.30.


Chart 1: SCGM's daily chart as at Jun 28, 2021 (Source: Kenanga BTX)

Prior to this, it had a big drop from its all-time high of RM3.95 in August 2020. 


Chart 2: SCGM's weekly chart as at  Jun 28, 2021 (Source: Kenanga BTX)

Conclusion

Based on improved financial performance, healthy financial position & fairly attractive valuation, SCGM is a good stock for long-term investment. 

Note:

I hereby confirm that I do not have any direct interest in the security or securities mentioned in this post. However, I could have an indirect interest in the security or securities mentioned as some of my clients may have an interest in the acquisition or disposal of the aforementioned security or securities. As investor, you should fully research any security before making an investment decision.

Monday, June 28, 2021

Expiry of warrants

One of the most regrettable oversight that any remisier can make is the failure to inform your clients that his warrant is about to expire. This information is available in Bursa website. 

To get the list of company-issued warrants that will be expiring within 30 days, you click on "Company Announcements" and then click on "Expiry/Maturity/Termination of Securities". See the steps below or just go here.


To get the list of structured warrants that will be expiring within 30 days, you click on "Structured Warrants" and then click on "Expiry/Maturity/Termination of Securities". See the steps below or just go here.

Bursa Malaysia does not make any distinction between call or put structured warrants.

****

You may have noticed that warrants with short expiry period tend to trade at very low prices. Some even trade at a discount. In order to get a better price for your warrant, you should try to sell them earlier than the last 30 days to expiry. One of the way of doing that is to use the warrant screener of klsescreener.com (here).

If you want to test out this filter, just select "CALL" under Type and key in "30" for "max days" under Maturity (leave min days as "0"). This should give you the list of company-issued and structured call warrants expiring within 30 days. An example is given below.


If you want to select call warrants with expiry dates between 30 & 60 days, you need to select "CALL" under Type and key in "30" for min days and "60" for max days under Maturity. This should give you the list of company-issued and structured call warrants expiring between 30 & 60 days. An example is given below.


The above steps are for filtering out expiring call warrants. You can easily do the same for expiring put warrants (note: they are mainly put structured warrants). However, the latter seldom happens as most investors or traders deal with call warrants, and not put warrants.

Sunday, June 27, 2021

ASTINO: Good Earnings in a Weak Market

Result Update

In QE30/4/2021, Astino's net profit rose 22% q-o-q or 447% y-o-y to RM22.8 million while its revenue dropped 11% q-o-q but rose 70% y-o-y to RM156 million. Revenue has decreased q-o-q primarily due to decrease in local market demand. Profit before taxation increased by RM8.9 million to RM29.8 million, due to higher selling prices and improved operating cost. In addition, the allowance for diminution in value of inventories was RM2.3 million lower than the immediate preceding quarter. (Note: Astino is essentially a building material producer. For more, go here).


Table: Astino's last 8 quarters' results


Graph: Astino's last 52 quarters' results

Financial Position

Astino's financial position as at 30/4/2021 is deemed healthy with current ratio at 5.56x and gearing ratio at 0.15x.

Valuation

Astino (closed at RM1.40 last Friday) is now trading at a trailing PER of 6.4x (based on last 4 quarters' EPS of 21.74 sen). At this PER, Astino is deemed fairly attractive.

Technical Outlook

Astino has rallied strongly off its March 2020 low of RM0.37 ti make a high of RM1.70 in May 2021.


Chart 1: Astino's weekly chart as at Jun 25, 2021 (Source: Malaysiastock.biz)

From the monthly chart, we can see that Astino  has been moving within a large expanding triangle since 2014. Until it can break above the upper line at RM1.60, Astino is likely to move within the triangle. Since it has just tested the upper line, the more likely move is downward notwithstanding the good financial results achieved.


Chart 2: Astino's monthly chart as at Jun 25, 2021  (Source: Kenanga's BTX)

Conclusion

Based on good financial performance & financial position and fairly attractive valuation, Astino is a good stock for long-term investment. The near-term upside potential is limited as the share price will face strong resistance from the upper line of the expanding triangle.  

Note:

I hereby confirm that I do not have any direct interest in the security or securities mentioned in this post. However, I could have an indirect interest in the security or securities mentioned as some of my clients may have an interest in the acquisition or disposal of the aforementioned security or securities. As investor, you should fully research any security before making an investment decision.

Wednesday, June 23, 2021

CMSB: Another Irregular Affair

Another stock which has been hit with financial irregularity is CMSB. On April 22, CMSB’s Deputy Chairman resigned from the company amid allegations of conflict of interest (here). Shortly thereafter, its CFO was suspended on May 5 (here).

CMSB’s management did the right thing to quickly appoint KPMG to probe the allegations of financial mismanagement in relation to its investments and operations (here). This sent a strong signal to the market that the management is working to resolve the problem, if any.

Two days ago, two of its non-executive directors, Yam Kong Choy and Ho Heng Chuan resigned from the company (here). This development threw a spanner in the works. Why did these 2 non-executive directors resign from the board? Is the financial mismanagement in CMSB bigger than expected? Are there other serious problems in the company?

Meanwhile the share price has continued to decline. It went below the uptrend line, AB at RM1.28. It may revisit the Oct-Nov 2020 low of RM1.06.

Chart: CMSB's daily chart as at Jun 23, 2021_2.45pm (Source: Kenanga's BTX)

Hopefully by then, the KPMG probe would have been completed, and the management of CMSB can announce its plans to tackle any problem or weaknesses that have been unearthed.

CMSB is a solid conglomerate with exposure to good business segments that benefit strongly from continued economic development in the State of Sarawak. The shareholders of CMSB are well-aware of its major shareholder’s political connection. Whatever the stance of the investors on this political connection, no one can deny that the connection has benefited the group as much as it has weighed down on the share price generally, except for periods of heightened political interest ahead of election times.

Until the dust has settled, it is best to avoid the stock for now. If you are however stuck with it, the share price is low enough that you might as well just hang onto the shares. After all, the management appears to be ready to bite the bullet even though the resignation of the 2 non-executive directors has raised more questions about the seriousness of the financial mismanagement in CMSB.

SERBADK: A Lost Cause!

Serba Dinamik has been in the news since May 25 when it was first reported that the company's external auditor, KPMG had filed a complaint to the company's independent directors regarding a matter of serious concern. How did the company's management handle this complaint?

Let me give you a bit of background of my training & experience in the field of accountancy & auditing. My first job was as an audit clerk in Ernst & Young (formerly, Ernst & Whiney) in its Sandakan office in 1983. It was a very exciting time for me as I had the opportunity to work with the audit team that handled such diverse clients like Harrison Holdings (M) Bhd (formerly, Harrison & Crosfield), Kretam & WMG (formerly, Tekala). As a result of this working experience, I decided to pursue a career in accountancy & auditing. I went to Tunku Abdul Rahman College to obtain a professional accountancy qualification.

Now back to the story: Accountancy is a highly regulated profession with strict rules to follow. One has to know all the accounting standards to ensure that the correct treatment is applied to the recording & presentation of accounting information. To the uninformed laymen, an accountant is often mistaken as a book-keeper. This applies even to some worldly businessmen too (think Donald Trump). These businessmen want the accountants to report whatever they wish to reveal to the world- be it their bankers or the tax authorities. Alas, we have been witnessing the same behaviour exhibited by Serba Dinamik, the one time O&G darling stock in Bursa Malaysia. 

Since the report of irregularity filed by KPMG more than 3 weeks ago, the investing public has learned very little about the problem or issue at hand. This is a very unfortunate affair for Serba Dinamik and its shareholders. And, it is entirely the fault of the major shareholder & management of Serba Dinamik. It is not the fault of KPMG as the publication of damaging information that could cause further harm to the company and its many stakeholders is professionally prohibited.

Let me venture a guess as to what actually happened: KPMG has discovered something in the course of the auditing of the company (or, the group) and it wished to report these in the financial statement. If these were irregular transactions, KPMG wants to include these in the report together with management's explanation. If these could lead to losses to the company (or, the group), KPMG wants to make a provision for the losses. I am confident that the KPMG team leader has brought the matter up to the management in order to seek an explanation and then he would have recommended the proper course of action. The management disagreed with the recommendation. What could KPMG team leader do? It must have been a very serious matter which may jeopardise KPMG’s professional reputation as well as exposing it to professional liability if it chose not to do anything. As such, it has no choice but to bring the matter to the audit committee comprising of independent directors of the company. And, that's when the whole thing blew up. 

The best course of action for Serba Dinamik would have been to appoint an independent audit firm to investigate the matter. The fact that this option was initially considered, however reluctantly but now no longer pursued, is simply because it is a dead-end. The named independent audit firm, Ernst & Young would in due course come to the same conclusion as did KPMG. So what can Serba Dinamik's management team do?

Yesterday, Serba Dinamik announced that it has hired a lawyer to sue KPMG. I read thru the news with incredulity (here). Even more shocking are the Q&A during the press conference following the press briefing (here). The gem is this exchange:

Some say the suit against KPMG is a distraction to the actual issue by Serba Dinamik. Can you comment?

Mohamed Ilyas: I don't know where you get your information from, but I think you should verify your information. If KPMG can mislead our directors, Bursa and the SC with trivial issues, I don't think we are supposed to work with them anymore. This is why we took the decision to take legal action on them. 

Plus they (KPMG) mentioned they were going to stop the audit process. How can you work with your auditor when you pay them a few hundred thousand ringgit and they dictate what to do? They should be working with us, not taking our money and behaving like this.

They are behaving like official gangsters, hiding behind the veil of whatever act they have. I have got all the information, I spoke to SC and I spoke to Bursa. I think you better clarify your information.

Hiring a fancy lawyer to sue KPMG looks less like the Charge of the Light Brigade but more like Don Quixote battling out with the windmills. But, I digress...

If you are holding shares in Serba Dinamik, you should seriously consider doing what EPF has been doing in the past few days- disposing of the shares (here). Sad to say, this one is a lost cause!

Sunday, June 20, 2021

BAUTO: Strong Earnings Due to Better Domestic Operation

Results Update

For QE30/4/2021, BAuto's net profit rose 102% q-o-q or 26-fold y-o-y to RM67 million while revenue rose 7% q-o-q or 114% y-o-y to RM641 million.

Group revenue improved 7%  q-o-q largely due to improvement in sales volume from the domestic operations. Higher sales volume from the domestic operations was achieved when the consumers rushed to buy new vehicles in the new calendar year 2021 and before the end of the SST Exemption in June 2021. The Group pre-tax profit for the current quarter under review has increased by RM41.3 million or 97.8% mainly because of improvement in the profit contributions from the domestic operations, higher share of profit contribution from Mazda Malaysia Sdn Bhd ("MMSB"), partly offset by lower contribution from the Philippines operations. Higher profit contribution from the domestic operations was mainly attributed to higher gross margin as a result of the discontinuation of aggressive promotional campaign, favourable foreign exchange of Japanese Yen against Malaysian Ringgit and other cost savings. Higher profit contribution from MMSB was mainly due to the improvement in gross profit and reversal of over-accrued provisions. Lower contribution from the Philippines operations, despite higher revenue, was mainly due to lower margin arising from higher promotional activities being carried out during the quarter.


Table: BAuto's last 8 quarters' financial performance


Graph: BAuto's last 36 quarters' financial performance  

Financial position

As at 31/4/2021, BAuto's financial position has deteriorated with current ratio at 2.41 times and total liabilities to total equity at 1.18 times.

Valuation

BAuto (closed at RM1.48 last Friday) has a fair PER of 12.8 times (based on last 4 quarters' EPS of 11.53 sen). BAuto paid quarterly dividends which totaled 6.5 sen over the past 4 quarters. This translates to a decent dividend yield of 4.4%. Based on the above, BAuto is deemed fairly valued.

Technical Outlook

BAuto has been trading sideways for about 12 months. If it can go above the line connecting the recent reaction high at RM1.50-1.52, its uptrend may finally begin.

Chart 1: BAuto's daily chart as at Jun 18, 2021 (Source: Malaysiastock.biz)


Chart 2: BAuto's weekly chart as at Jun 18, 2021 (Source: Malaysiastock.biz)

Conclusion

Based on improved financial performance & strong financial position, I revised my rating for BAUTO to a HOLD. If BAUTO can go above the resistance at RM1.50-1.52, its uptrend will turn bullish.

Note:

I hereby confirm that I do not have any direct interest in the security or securities mentioned in this post. However, I could have an indirect interest in the security or securities mentioned as some of my clients may have an interest in the acquisition or disposal of the aforementioned security or securities. As investor, you should fully research any security before making an investment decision.

Sunday, June 13, 2021

TOPGLOV: Top-line & Bottom-line Finally Reversed

Result Update

For QE31/5/2021 (3QFY2021), Topglov's net profit dropped 29% q-o-q but rose 485% y-o-y to RM2.036 billion while revenue dropped 22% q-o-q but rose 147% y-o-y to RM4.163 billion. The Group’s softer quarter-on-quarter performance for 3QFY2021 came on the back of adjustments in line with glove market pricing trends, after ASPs had peaked in February 2021. The Sales Volume (Quantity Sold) dropped 4% quarter-on-quarter mainly due to reduction in sales to the U.S., following a temporary halt in shipments to the U.S. from Malaysia, in compliance with requirements of the U.S. Customs and Border Protection. Raw material prices for the quarter ended 3QFY2021 rose from 2QFY2021, with average natural latex concentrate prices up by 8% from RM5.85/kg to RM6.31/kg, whilst nitrile latex price increased marginally by 0.4% from USD2.30/kg to USD2.31/kg.

There you have it; lower sales volume coupled with lower ASPs mean lower revenue, and lower ASPs coupled with slightly higher raw material cost mean lower profit margins.  


Table: Topglov's last 8 quarterly results


Graph: Topglov's last 60 quarterly results

Financial Position

As at 31/5/2021, Topglov's financial position is deemed healthy with current ratio at 1.9 times and Total liabilities to Total equity at 0.50 time.

Valuation

Topglov (closed at RM4.72 last Friday) is now trading at a trailing PE of 4.4 times (based on last 4 quarters' EPS of 106.80 sen). This exceptionally low PE ratio reflects investors' perception that Topglov's future earnings must decline in the near term due to average selling prices & profit margins normalization. This is not unreasonable given the glove demand has been driven by the Covid-19 pandemic, which is expected to be brought under control with the arrival of vaccines worldwide.

I wrote about the possible scenarios of ASPs & profit normalization in my last post on Topglov (here). If Topglov were to trade at its past PE of 31-32 times, then the market is now projecting its 4-quarter net profit of RM1.344 billion in next few quarters. That means its quarterly net profit would be about RM336 million. 

As noted in that post, if the above projection is proven to be too pessimistic, then the market will revise its outlook and the share price will go up, or vice versa

Technical Outlook

Topglov's immediate support is at the horizontal line of RM4.70. If that support failed, the next support is at the horizontal line of RM4.50.


Chart: Topglov's daily chart as at June 11, 2021 (Source: Malaysiastock.biz)

Conclusion

Based on the current strong financial performance, healthy financial position and fairly attractive valuation, Topglov makes a very appealing case as a value stock for long-term investment. However the arrival of vaccines and their positive impact in controlling the spread of the pandemic have changed the narrative of investing in pandemic stocks. The question of whether Topglov is a value stock or a value trap still remain unchanged for now.

Note:

I hereby confirm that I do not have any direct interest in the security or securities mentioned in this post. However, I could have an indirect interest in the security or securities mentioned as some of my clients may have an interest in the acquisition or disposal of the aforementioned security or securities. As investor, you should fully research any security before making an investment decision.

Wednesday, June 02, 2021

Webinar: Foundation of Technical Analysis

This evening, I will be presenting on the topic of Technical Analysis as part of Bursa Webinar 2021. 

The title:  The Foundation of Technical Analysis

Date: 2 Jun 2021 (Wed)

Time: 8.30pm - 10pm

Learning Outcomes:

✅ Learn what is technical analysis

✅ Understand the basic tenets of technical analysis

✅ Know how to draw trend lines and and recognize important chart patterns

✅ Learn the basic technical indicators and overlays

If you like to attend the webinar, you can register: https://us02web.zoom.us/webinar/register/1716222791266/WN_JDfGE6hrSzulyUvY4DiU2A


Wednesday, May 26, 2021

AMWAY: Attractive Enough for Long Term Investing

Result Update

For QE31/3/2021, Amway's net profit rose 371% q-o-q or 97% y-o-y to RM20 million while revenue rose 12% q-o-q or 51% y-o-y to RM354 million. Revenue was higher than the preceding quarter by due to stronger demand for nutrition and wellness products, home appliances and new customer segment namely Amway Privileged Customer (APC) program launched in January 2021. The Group’s profit before tax increased by 433% as compared to the preceding quarter due to higher sales volume and lower selling and administrative expenses.


Table: Amway's last 8 quarterly results


Graph: Amway's last 54 quarterly results

Financial Position

As at 31/3/2021, Amway's financial position is deemed healthy with current ratio at 1.4 times while total liabilities to total equity appeared high at 1.2 times. However, it has cash balance of RM162 million or about RM0.99 per share.

Valuation

Amway (closed at RM5.19 yesterday) is trading at a trailing PER of 15 times (based on last 4 quarters' EPS of 34.6 sen). At this PER, Amway is deemed fairly attractive. In addition, investors may take comfort in receiving a decent dividend yield of 5.3%.

Technical Outlook

Amway has dropped from a high of RM12.50 in 2013 to a recent of RM4.50 in Mar 2020 (during the selldown at the start of the pandemic).


Chart 1: Amway's monthly chart as at May 25, 2021 (Source: Malaysiastock.biz)

From the daily chart below, Amway has been rising slowly in an uptrend line (in blue) with support at RM5.20.


Chart 2: Amway's daily chart as at May 25, 2021 (Source: Malaysiastock.biz)

Conclusion

Based on decent financial performance, good financial position, attractive valuation & a constructive technical outlook after a long decline, Amway could be a good stock to consider for recovery play. 

Note:
I hereby confirm that I do not have any direct interest in the security or securities mentioned in this post. However, I could have an indirect interest in the security or securities mentioned as some of my clients may have an interest in the acquisition or disposal of the aforementioned security or securities. As investor, you should fully research any security before making an investment decision.

Wednesday, May 12, 2021

Selamat Hari Raya Aidilfitri

 I wish all my readers a safe and blessed Hari Raya Aidilfitri.


PBBANK: Quarterly Profits Soared

Result Update

For QE31/3/2021, PBBank's net profit rose 333% q-o-q or 15.1% y-o-y to RM1.530 billion while revenue was mix- up 2.3% q-o-q but down 8.8% y-o-y to RM5.03 billion. The improved performance on a q-o-q basis was mainly attributable to lower loan impairment allowance of RM358.1 million (+64.3%), higher net interest income and net income from Islamic banking business of RM137.6 million (+7.1%) and RM61.4 million (+16.5%) respectively, and higher net fee and commission income of RM52.9 million (+9.8 %). These were partially offset by lower other operating income of RM78.6 million and higher other operating expenses of RM36.1 million.


Table: PBBank's last 8 quarterly results

From the graph below, we can see that PBBank's profits & profit margins have reached the all-time high achieved in QE30/6/2011.


Graph: PBBank's last 61 quarterly results

Valuation

PBBank (closed at RM4.10 yesterday) is now trading at a PE of 15.7 times (based on last 4 quarters' EPS of 26.13 sen). At this PE multiple, PBBank is deemed fully valued. It pays a decent dividend yield of 3.2%.

Technical Outlook

PBBank has been rising in an irregular upward channel (see parallel blue lines in Chart 1). Immediate support is at the horizontal line at RM4.10 while immediate resistance is at the horizontal line at RM4.50. 


Chart 1: PBBank's daily chart as at May 11, 2021(Source: MalaysiaStock.biz)


Chart 2: PBBank's weekly chart as at May 11, 2021(Source: MalaysiaStock.biz)

Conclusion

Based on good financial performance and fair valuation, PBBank is still a good stock for long-term investment. 

Note:
I hereby confirm that I do not have any direct interest in the security or securities mentioned in this post. However, I could have an indirect interest in the security or securities mentioned as some of my clients may have an interest in the acquisition or disposal of the aforementioned security or securities. As investor, you should fully research any security before making an investment decision. 

Friday, April 30, 2021

LCTITAN: Earnings Soared

Background

Lotte Chemical Titan Holdings Bhd ("LCTitan") is a petrochemical producer. Its main products are polyolefins and olefins.Polyolefin products accounts for 18% & 9% of revenue & segmental results respectively while olefins & derivative products accounts for 82% & 91% of revenue & segmental results respectively.

Financial Performance

For QE31/3/2021, LCTitan's net profit rose 191% q-o-q to RM440 million on the back of a 23%-increase in revenue to RM2.367 billion. As compared to the results in the corresponding quarter last year, LCTitan has returned to the black due to increased sales volume & selling price. This, combined with higher plant utilization of 88%, helped to results of the group.


 Table: LCTitan's last 8 quarterly results

Looking at the graph below, we can see that LCTitan's profit has exceeded the high achieved in QE30/6/2016.

Graph: LCTitan's last 21 quarterly results

Financial Position

As at 31/3/2021, LCTitan's financial position is deemed healthy with current ratio at 7.03 times while gearing ratio was at only 0.14 time. 

Valuation

LCTitan (closed at RM2.99 last Wednesday) is now trading at a PE of 9 times (based on last 4 quarters' EPS of 33 sen). Based on this, LCTitan is deemed to be an attractive investment.

Technical Outlook

Looking at the weekly chart below, we can see that LCTitan broke above its downtrend line (in red) at RM1.80 in May 2020. Its uptrend since then has been capped just below RM3.00 (to be more precise at RM2.95). Last Wednesday's results announcement boosted the share price passed the resistance of RM2.95-3.00. This may mark the continuation of the uptrend in LCTitan's share price.


Chart: LCTitan's weekly chart as at April 28, 2021 (Source: Malaysiastock.biz)

Conclusion


Based on the good financial performance & position, attractive valuation & positive technical outlook, LCTitan is a good stock for long-term investment.

Note:

I hereby confirm that I do not have any direct interest in the security or securities mentioned in this post. However, I could have an indirect interest in the security or securities mentioned as some of my clients may have an interest in the acquisition or disposal of the aforementioned security or securities. As investor, you should fully research any security before making an investment decision.

Wednesday, March 10, 2021

TOPGLOV: Fantastic Earnings For Now? (UPDATED)

Result Update

For QE28/2/2021, Topglov's net profit rose 20.8% q-o-q or 24-fold y-o-y to RM2.869 billion while revenue rose 12.7% q-o-q or 336% y-o-y to RM5.365 billion. The Group’s strong and healthy Sales figures were attributed to the continued demand for gloves globally while the improved Profit came on the back of higher sales output, high utilisation levels which amplified production efficiency, coupled with higher average selling prices (ASPs) in line with market pricing. The Group’s healthy profit was also attributed to ongoing enhancements across its operations, through digital transformation, continuous R&D and innovation, quality and productivity initiatives and talent acquisition and development.

 
Table 1: Topglov's last 8 quarterly results


Graph: Topglov's last 74 quarterly results

Financial Position

As at 28/2/2021, Topglov's financial position is deemed healthy with current ratio at 1.9 times and Total liabilities to Total equity at 0.51 time.

Valuation

Topglov (closed at RM5.19 yesterday) is now trading at a trailing PE of 6 times (based on last 4 quarters' EPS of 85.89 sen). This exceptionally low PE ratio reflects investors' perception that Topglov's future earnings must decline in the near term due to average selling prices & profit margins normalization. This is not unreasonable given the glove demand has been driven by the Covid-19 pandemic, which is expected to be brought under control with the arrival of vaccines worldwide.

My previous 2 earnings reports on Topglov prior to the pandemic were in June 2019 (here) and October 2018 (here). In these reports, Topglov was trading at a PE of 31-32 times. Assuming that Topglov's fair PE is 32 times, the only way that Topglov's current share price can be justified is for its quarterly earnings to drop by a whopping 81% from RM2.869 billion to RM545 million! Is that too extreme?! 

To get a better feel of how much Topglov's net profit has risen, let's compare the financial performance in the last 4 quarters against the performance in the preceding 4 quarters. Ssee Table 2 below. 

Table 2: Topglov's latest 4 quarterly results compared to the previous 4 quarterly results

The first thing that would jump up is the staggering 18-fold increase in net profit from RM382 million to RM6.885 billion! This was achieved on the back of a 210%-increase in revenue from RM4.819 billion to RM14.922 billion. From the foregoing, I would highlight 2 points:

(a) Topglov's net profit margin has shot up from a mere 7.9% to 46.1%.  

(b) As a result, quarterly net profit rose from an average of RM95 million to RM1.721 billion. 

With the pandemic being brought under control, it is likely that the abnormally high net profit margin will decline over the next few quarters. I have computed 4 scenarios of lower net profit margin. See Table 3 below.

Table 3: Topglov's 4 possible scenarios of net profit margin & valuation estimate

If we accept that Topglov would eventually trade at its past PE of 31-32 times, then the market is now projecting its 4-quarter net profit would go down to RM1.344 billion in next few quarters. That means its quarterly net profit would be about RM336 million. 

Nothing is a sure thing in investing. If the above computation and assumptions are too pessimistic and proven wrong later, then the market will revise its outlook and the share price will go up, or vice versa. For now, this is what's the market is telling us.

Technical Outlook

Topglov has peaked at RM9.76 in early August, and then went into a gradual decline. If you plot a semi-log chart, it is possible to draw an uptrend line, SS with support at RM4.60.


Chart 1: Topglov's semi-log daily chart as at Mar 9, 2021 (Source: Malaysiastock.biz)

Conclusion

Based on the current strong financial performance, healthy financial position and fairly attractive valuation, Topglov makes a very appealing case as a value stock for long-term investment. However the arrival of vaccines and their positive impact in controlling the spread of the pandemic have changed the narrative of investing in pandemic stocks. Is Topglov a value stock or a value trap? Only time will tell. 

Note:

I hereby confirm that I do not have any direct interest in the security or securities mentioned in this post. However, I could have an indirect interest in the security or securities mentioned as some of my clients may have an interest in the acquisition or disposal of the aforementioned security or securities. As investor, you should fully research any security before making an investment decision.