This is a personal weblog, reflecting my personal views and not the views of anyone or any organization, which I may be affiliated to. All information provided here, including recommendations (if any), should be treated for informational purposes only. The author should not be held liable for any informational errors, incompleteness, or delays, or for any actions taken in reliance on information contained herein.
Wednesday, February 28, 2007
Market Outlook as at February 28
Is there more to come? This morning, we have more bad news. The Dow average sank 416.02, or 3.3 percent, to 12,216.24. The S&P 500 retreated 50.33, or 3.5 percent, to 1399.04. The Nasdaq Composite Index dropped 96.66, or 3.9 percent, to 2407.86. This is the worst one-day performance for the U.S. stocks since 2001.
A look at the 2 charts below will reveal the severity of yesterday's sell-off. In just one day, our KLCI had broken below the 8-day SMA as well as the 20-day SMA (see Chart 1). It will probably test the 30-day SMA at 1210 level soon. From Chart 2, we can see that the KLCI had broken below the immediate uptrend line at 1265 level & nearly tested the next uptrend line at the 1220 level.
Chart 1: KLCI's daily chart overlaid with 8-, 20- & 30-day SMA
Chart 2: KLCI's daily chart overlaid with uptrend lines
Since our market sell-off has now been overtaken by external events, its recovery would be determined by the satisfactory resolution of these events. Our market may witness forced liquidation by local retail players as well as overseas funds, that have invested here. A break of the immediate uptrend line at the 1220 level may bring the KLCI to the psychological 1200 level. If that also failed, the KLCI may slide to its medium-term uptrend line at 1120, with some supports at 1190, 1170 & 1140.
Monday, February 26, 2007
PIE reported a steady growth for FY2006
PIE is involved in the manufacturing of cables & wires for electrical devices, cable moulding components & PCB assemblies, cable & wireharness for computer, communication, consumer electronic industry & cable assembly.
Recent Financial Results
PIE has just reported its results for FYE31/12/2006. For the QE31/12/2006, net profit grew by 50% q-o-q or 29% y-o-y to RM10.6 million. Its turnover has also increased by 19% q-o-q or 43% y-o-y to RM85.4 million.
For FY2006, net profit jumped by 54% to RM26.1 million while turnover grew by 26% to RM277 million.
Valuation
Based on PIE's closing price of RM3.20 & its FY2006 EPS of 42.0 sen, PIE is now trading at a PE of about 8 times.
Technical Outlook
The share price is very near its recent high of RM3.28. If the share can surpass this high, there is good chance that the share price may continue its steady rise.
Chart: PIE's daily chart as at Feb 26
Conclusion
Based on steady growth in PIE's topline & bottomline, undemanding valuation & nice technical set-up, PIE is a good stock to invest in for the medium-term.
Tong Herr's bottomline declined q-o-q despite higher sales
Tong Herr Resources Bhd ('Tongher') is involved in the manufacture & sale of stainless steel fasteners such as nuts, bolts, screws & other threaded items. [I've recommended a BUY of this stock in November last year when the stock was trading at RM4.00.(go here)]
Recent Financial Results
Tongher has just announced its results for FYE31/12/2006. For QE31/12/2006, its topline continued to show impressive growth but its bottomline has declined marginally when compared to the preceding quarter. The company attributed the drop to escalating raw material costs.
For the FY2006, Tongher's net profit has increased by 87% to RM55.8 million, which was achieved on a 51%-increase in turnover to RM303 million.
Valuation
Based on its FY2006 EPS of 60.15 sen & its closing price of RM4.42, Tongher is now trading at a PE of 7.4 times.
Technical Outlook
Today, Tongher's share price has broken above its recent high of RM4.36, which is equivalent to its high in December 2004 (see Chart 1 & 2 below). The breakout leading to this new all-time high is a very bullish development. You will note that the share was attracting steady buying for the past 4 weeks prior to today's breakout. If the share price can hold above the breakout level of RM4.36/38, I expect the share price is likely to continue its steady rise from hereon.
Chart 1: Tongher's daily chart from March 2006 to 26 Feb 2007
Chart 2: Tongher's daily chart from Dec 2004 to 26 Feb 2007
Conclusion
Based on strong growth in topline & bottomline as well as a bullish technical outlook, Tongher is a very good BUY for the medium-term.
KSL's uptrend may accelerate
Chart: KSL's daily chart as at Feb 23
Sunday, February 25, 2007
TM & its 3 related CWs poised to go higher
Telekom Malaysia Bhd posted an impressive set of results for fiscal year ended Dec 31, 2006, recording net profit of RM2.07 billion, up 155% from a year ago, boosted by higher group revenue, better cost and financial management and foreign exchange gain.
It said on Feb 23 group revenue rose 17.6% to RM16.4 billion, driven primarily by the cellular, data services, Internet and multimedia segments. Overseas operations contributed 25% to the group’s revenue, up from only 13% in 2005.
It recommended a final dividend of 30 sen per share, bringing the total dividend payout of 2006 to RM1.14 billion, representing 55% of TM’s profits.
For full report, go here.
I believe this good results will likely to push TM's share price above its current resistance of RM11.00, thereby triggering a bullish breakout. In such an event, a technical 'BUY' would be issued and one should act accordingly. See Chart 1 below.
Chart 1: TM's daily chart as at February 23
One reader has posted a question about the performance of TM's related CWs, in particular TM-CB. I believe all the CWs of TM are giving the same potentially bullish picture, like its underlying share. If you look at the 3 following charts, you will see that TM-CA & TM-CB have broken out on Friday, albeit closing at their respective breakout level. TM-CC is a tad slower, but I expect it to do the same if TM were to surpass RM11.00 on Monday.
Chart 2: TM-CA's daily chart as at February 23
Chart 3: TM-CB's daily chart as at February 23
Chart 4: TM-CC's daily chart as at February 23
I think that many are concerned about TM-CB since it is expiring on March 16 (less than 20 trading days to go). You may recall that even if a CW is nearing its expiry date, the CW will still go up if the underlying share has a strong move. See the example of Astro-CA & BJToto-CA. In any event, TM-CB is a cash-settled CW & you need not worry about coughing out a large sum to exercise your call option.
Watch TM & its CWs closely tomorrow. Buy them if TM has broken above RM11.00. If you are concerned about the short tenor for TM-CB, then buy TM-CA or TM-CC. Of these 3 CWs, TM-CC has the highest premium of 4.6% (not excessively high) while TM-CB trades at a slight discount and TM-CA at a parity.
Saturday, February 24, 2007
DRBHicom's recovery begins
DRBHicom is a conglomerate with core businesses in automotive; property & construction; and, concession & financial services. It is controlled by Syed Mokhtar.
Recent Financial Results
DRBHicom has reported “positive results over the last three quarters of the current financial year. This momentum is expected to be maintained in the fourth quarter and thus the Board (of DRBHicom) is confident that the full year’s results for the current financial year ending 31 March 2007 will be positive as compared to a loss in the previous financial year.” (as per the results announcement for QE31/12/2006). See Table 1 below for DRBHicom's last 8 quarterly results.
Table 1: DRBHicom's past 8 quarterly results
DRBHicom's results has been affected by its automotive division, which is involved in the manufacturing, assembly, distribution and sales of motorcycles, passenger cars, utility vehicles and commercial vehicles. Amongst the global names which DRBHicom has formed business arrangement with are Audi, Honda, Mitsubishi, General Motors, Isuzu, Mahindra, Kawasaki, Suzuki and Tata. Nevertheless, its biggest money-earner in the past i.e. EON has been performing very poorly in the past few quarters and this has dragged down DRBHicom. See Table 2 for DRBHicom's 9 months' results ending 31/12/2006.
Table 2: DRBHicom's segmental results for 9-month ended 31/12/2006
Valuation
Assuming that DRBHicom can repeat its performance of the past 2 quarters, it is expected to earn about 13.6 sen per annum. Based on its closing price as at February 23 of RM2.24 & the aforesaid EPS of 13.6 sen, DRBHicom is now trading at a PE of 16.5 times. At this multiple, I believe DRBHicom is fairly valued.
Technical OutlookAs highlighted in this post on February 6, DRBHicom appears to have broken above its medium-term downtrend line at the RM2.00 level. The share's next 2 resistance levels are RM2.50 & RM3.00
Chart: DRBHicom's daily chart as at February 23
Conclusion
Based on bullish technical outlook & improving fundamental picture, DRBHicom is a good buy for the medium-term. I expect steady newsflow (read: rumors) on this stock to boost its share price in the immediate term.
3 new CWs to be listed on Monday- IOI-CC, KLK-CC & Resorts-CB
Based on their IPO prices, these are my comments regarding these new CWs:
- IOI-CC & KLK-CC are priced at a premium just slightly lower than the recently-issued IOI-CB & KLK-CB. While they offer higher gearing than the recently-issued IOI-CB & KLK-CB, their tenors are shorter. Amongst the IOI & KLK's CWs, my preference is for KLK-CA.
- Resorts-CB is more pricey than the existing Resorts-CA but it offers higher gearing & longer tenor. Is the higher premium justifiable?
NPC shows steady growth
NPC is involved in the operation of oil palm plantations and palm oil milling. Its operations are carried out solely in
Recent Financial Results
NPC has just announced its results for FY2006, which shows a 57%-increase in net profit from RM12.3 million to RM19.2 million. This is achieved on a marginally higher turnover of RM205 million. The better performance was due to higher CPO prices.
Valuation
Based on NPC's closing price of RM1.59 & its EPS of 16 sen for FY2006, the stock is now trading at a PE of 10 times. When compared to bigger plantation stocks that trade at PE multiples of 15 times, the PE multiples of NPC is undemanding.
Technical Outlook
NPC's share price has been capped by the overhead resistance of RM1.70. If this stock can break above this resistance, there is good chance that it may test the recent high of RM2.10.
Chart: NPC's daily chart as at Feb 23
Conclusion
Based on undemanding PE multiple, NPC could be one of the few remaining cheap plantation stocks on our exchange. If the share price can surpass the RM1.70 level, the technical 'BUY' call would be issued.
Friday, February 23, 2007
Camerlin about to test its uptrend line
On February 16, Camerlin has announced its proposal to undertake a capital distribution of up to 303.14 million BIL International Ltd ('BIL') shares to its own shareholders, via a capital reduction exercise and cancellation of its share premium reserve.
You may also like to check out the recent renewed interest in Camerlin (here), which has a lot to do with its associate, BIL's aggressive plan to be a significant player in
Prior to the announcement, the share price of Camerlin was rising steadily but this has since been reversed. Next week could be an interesting week for Camerlin. Its share price could test its immediate uptrend line support at RM2.35. A break of this support might bring the share price down to the strong horizontal support of RM2.28/30. If that also could not hold up this stock, the next support would be the medium-term uptrend line support as well as a horizontal support of RM2.10.
Chart: Camerlin's daily chart as at Feb 23
Watch the share trading for this stock carefully next week. If the share can rebound from any one of the above support level with good volume, it could be a signal to buy into this stock.
HLBank's uptrend may accelerate
Chart: HLBank's daily chart as at Feb 22
2 new CWs to be listed today- UMW-CA & IOI-CB.
IOI-CB is superior to IOI-CA in term of longer tenor (i.e. expiring in November this year for IOI-CB versus April this year for IOI-CA) but its premium is higher. Based on the IPO price of RM0.75, IOI-CB has a premium of 13.0% as compared to 1.3% for IOI-CA.
UMW-CA is compared to Sime-CA, another conglomerate that is its closest peer in the CWs universe, in my mind. Like IOI-CB, UMW-CA will have a longer tenor (just slightly over 2 months) but again priced at a premium. Based on its IPO price of RM0.78, it has a premium of 11.60% versus Sime-CA's premium of 3.51%.
Despite the higher premium, I believe both CWs will trade higher today. However, you may observe that the higher premium has been a drag on the price performance of newly-listed CWs for the first month of their trading. As such, I believe that newly-listed CWs should only be purchased if their premium has dropped below 10% (ideally, 6%) or if the underlying share has an exciting development.
Wednesday, February 21, 2007
Market Outlook as at February 21, 2007
A look at the monthly chart below shows that the CI is now at the February 1997 high of 1278/79 level. If the CI can surpass this level, it may revisit the January 1994 high of 1332. However, I believe the 1278/79 level will be a strong resistance & the market may not be able to breakthrough this resistance on the first attempt. A failure to do so could set the stage for a correction of the market's recent sharp run-up.
Chart: CI's monthly chart as at Feb 16
Tuesday, February 20, 2007
Market Outlook as at Feb 16, 2007
Current Market Outlook
From Chart 1 below, we can see that the CI is supported by its immediate short-term uptrend line, with support at the 1240. The next uptrend line support is at 1195/1200.
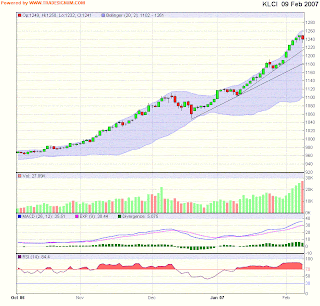
Chart 1: CI’s daily chart as at Feb 16 (overlaid with uptrend lines, SMAs & Bollinger Band)
From Chart 2 below, we can see that the CI is well-supported by the 8-day SMA. The current 8-day SMA support will be at 1245.
Chart 2: CI’s daily chart as at Feb 16 (overlaid with SMAs)
Comparison with 1993 bull run
We can study the 1993 bull run to seek some insights into the current bull run. The 1993 bull run started in April 1993, after a breakout above the 680 level, and ran for a period of 8 & 1/2 months until it peaked in the 1st week of January 1994 (see Chart 3 below). During that period, there were 2 consolidation phases i.e. in June & July 1993 & November 1993. The consolidation phases were noted for 2 things i.e. the CI dropped below the 30-day SMA & the contraction in volume of shares traded.
Chart 3: CI’s daily chart from 1st March 1993 to 1st February 1994
A closer look at the period from 1st March 1993 to 1st October 1993 may be useful as it is fairly similar the present stage of the current bull market. The current bull run encountered its 1st consolidation phase in December last year while the 1993 bull run encountered its 1st consolidation phase in June & July 1993. Since that 1st consolidation phase in June & July 1993, the 1993 bull run went up for another 3 months before encountering the 2nd consolidation phase in November 1993. If the same strong run-up repeats itself in the current bull run, we can expect the next consolidation to occur only in early April (i.e. another 1 month to go). In the stock market, nothing is ever smooth sailing. Even in the 1993 bull run, in between the 2 consolidation phases, there was a very nasty correction in the month of September 1993. So, even in the current bull market, we can expect some sharp corrections now & then.
Chart 4: CI’s daily chart from 1st March 1993 to 1st October 1993
Conclusion
In a bull run, the risk is on the upside. We should buy on market weakness. Selling should only be carried out after a share has hit its pre-determined target or a sell signal has been issued based on technical consideration.
Saturday, February 17, 2007
Ranhill may have a bullish breakout
The Ranhill Group is involved in the energy, power, water and infrastructure businesses.
It currently has on-going oil and gas explorations in
Its investments in the power and water concession businesses have ensured recurring income from these sectors. The recent power and water tariff adjustments will also have a positive result to the Group’s power and water businesses.
Recent Financial Results
Ranhill's topline & bottomline have improved considerably in the last 2 quarters i.e. 1H2007. For the latest quarter i.e. QE31/12/2006, Ranhill reported a net profit of RM27.6 million on a turnover of RM417.6 million. In the QE31/3/2006, Ranhill reported a net loss of RM49 million due to certain acquisition costs associated with a proposed power plant acquisition.
Valuation
If Ranhill's current performance can be maintained, its EPS for FY2007 could be about 22 sen. Based on this & its closing price of RM1.42 as at Feb 16, Ranhill is now trading at a PE of about 6.5 times.
Technical Outlook
Ranhill share price may have broken above its long-term downtrend line, which stretched back to 2003. From a high of RM3.30 then, Ranhill share price slid all the way to a low of RM0.70 in December 2005. If Ranhill can stay above the breakout level of RM1.40, Ranhill could be on the way to higher price level.
Chart 1: Ranhill's daily chart from Jun 2003 until Feb 16, 2007
Chart 2: Ranhill's daily chart from Jan 2006 to Feb 16, 2007
Conclusion
Based on improving fundamentals & potentially bullish breakout, Ranhill could be a good buy for the medium-term.
Wednesday, February 14, 2007
Willow reported better results for QE31/12/2006
Willowglen MSC Bhd ("Willow") is involved in the research, development & supply of computer-based control systems. Its systems can cater for a wide range of applications in key areas such as water management industry, oil & gas pipeline systems public utility systems & ntegrated monitoring systems.
Recent Financial Results
From the table below, you can see that Willow's net profit for the last 4 quarters has increased by 86% to RM8.0 million when compared to the preceding 4 quarters. This was achieved on a 8.5%-increase in turnover form RM36.4 million to RM39.4 million. EPS has increased from 1.75 sen to 3.25 sen.
Valuation
Based on the closing price of RM0.245 for February 14 & the EPS of 3.25 sen for the last 4 quarters, Willow is trading at a PE of 7.5 times. At that multiple, Willow is deemed relatively inexpensive for a Mesdaq stock.
Technical Outlook
Willow has been in an uptrend since May 2005. This medium-term uptrend line will provide support at the RM0.17 level while the immediate uptrend line support at RM0.22.
Chart: Willow's daily chart as at February 14
Conclusion
Based on reasonable valuation & nice technical outlook, Willow would be a good buy (though not a screaming buy) if you believe that Mesdaq stocks may be poised to go higher.
Lion Corp has a bullish breakout
Like UEM Builder & DRB Hicom before this, Lion Corp is a trading buy recommendation which is based strictly on technical consideration alone. I have not looked into their financial performance nor their financial position before making this recommendation.
Chart: Lion Corp's daily chart as at Feb 14
Tuesday, February 13, 2007
AIGB reported good results for 4Q2006
If AIGB can duplicate its 4Q2006 performance again for the FY2007, we can expect the company to earn about 36 sen per share. Based on its closing price today of RM1.89, AIGB would be trading at a prospective PE of 5.3 times. This is very attractive.
Notwithstanding the current bullish sentiment in our stock market, I do not believe AIGB can repeat its good performance in 4Q2006 for FY2007. A more likely earning scenario for FY2007 is one that lies between 4Q2006 & 3Q2006. If we annualized that EPS (i.e. 2H2006 figure), we can arrive at an earning of about 29 sen per share for FY2007. This will give AIGB a PE of 6.5 times, still quite cheap..... (added at 8.00 a.m. on February 14, 2007)
Table: AIGB's 8 quarterly results up to 4Q2006
AIGB share price is still trapped in its medium-term downtrend line, with resistance at RM1.90. In the past few days, it has tested & exceeded that downtrend line. Unfortunately, it fell below that line again this week due to price correction. A break above the RM1.90 (or, even RM2.00) could signal the beginning of the bullish phase for AIGB.
Based on the above, I would recommend slow accumulation of AIGB at the current level. Your buying should accelerate if the share price break above the RM1.90 (or, RM2.00).
Chart: AIGB's daily chart as at Feb 13
Titan reported good result for 4Q2006
For the full year FY2006, Titan has reported a net profit of RM773 million, an increase of 145% over the net profit of FY2005. Even if the one-off exceptional gain from the excess of group's interest in the net fair value of Chemicals Brothers Ltd of RM341 mil were excluded, Titan's net profit would still have increased by 35%. Similarly, the indicative FY2006 EPS of 44 sen would be lowered to 24 sen.
Based on today's closing price of RM1.55 & the amended EPS of 24 sen, Titan would be trading at a PE of 6.5 times, a multiple which I would consider to be undemanding. Titan has also raised its dividend from 6% in FY2005 to 7.5% in FY2006. At this dividend payout, Titan's dividend yield is acceptable at 4.8%.
Based on the above, I believe Titan is a good medium-term buy at RM1.45-1.50.
Table: Titan's 8 quarterly results up to 4Q2006
Chart: Titan's daily chart as at Feb 13
Mesdaq has a bullish breakout
From the chart below, we can see that Mesdaq has broken above the slanting resistance (aa) at the 126 level last week. Yesterday, it may have also broken above the potential long-term downtrend line (AA) at the 129 level. The next resistance for Mesdaq will be the overhead horizontal resistance of 143, 152 & 162.
Chart: Mesdaq's weekly chart as at Feb 12
Sunday, February 11, 2007
Market Outlook for W/E Feb 16, 2006
From Table 1 below, we can see that the immediate uptrend line support is at 1215-1220, while the next uptrend line support is at 1185. Given the strong bullish undertone in the market, I do not foresee a break of the 1185 uptrend line support at this moment.
Chart 1: CI's daily chart overlaid with uptrend lines
In the preceding rally from October to December 2006, the 8-day SMA has acted as a good support for the CI. A break below the 8-day SMA in mid-December 2006 was followed by a sharp correction which brought the CI down to its 30-day SMA (before recovery). This 8-day SMA may again act as a support for any potential correction in the market in the coming days. From Table 2 below, we can see that the 8-day SMA is at 1220. A break below this level could lead to a more pro-longed market consolidation.
Chart 2: CI's daily chart overlaid with 8-, 20- & 30-day SMA
Friday, February 09, 2007
Call Warrant updates as at February 9, 2007
Table 1: Changes in Call warrants' prices, underlying share prices & premium from Feb 2 to Feb 9
From Table 2 below, we can see that the majority of the CWs are trading at or below 6% (my rough guide for what's a reasonably-priced CW). Those above the 6%-mark are mostly the new CWs with a few exceptions such as Airasia-CA & -CB, MISC-CA, PLUS-CA, Proton-CA & YTL-CA.
While many CWs look very attractive, is this a good time to buy them? Is the low premium an indication of their future price expectation as well as those of their underlying shares? Only time will tell.
Table 2: Call warrants' intrinsic value & premium as at Feb 9
Market Outlook as at February 9, 2007
The increased volume happens when there is an influx of new buyers, which enable the existing holders of shares to sell their shares at acceptable prices. In a very bullish market, distribution can be absorbed & the market may re-gain its prior momentum after a minor correction (or, sometime without any correction). The critical thing to consider is who are the new buyers and whether the buying can continue? Are the buyers foreign funds? What kind of foreign funds? Or, are they retail players who finally got excited after watching UEM World did a Hail Mary pass? And, lastly, we must remember that frequently when the buying stops, the selling will begin.
Chart: CI's daily chart as at Feb 8
Note: Yesterday, the CI did gain 5.26 points to close at 1248.83. The gain happened in the last 15 minutes of trading when buying of selective blue chips pushed up the index.
Thursday, February 08, 2007
Commerce-CB, Magnum-CB & KLK-CB- new CWs issued
Table 1: Commerce-CB, Magnum-CB & KLK-CB compared to the existing CWs of the same underlying shares.
Note: Warrant's price for the new CWs is the CWs' Issue Price
The 2 important things to note are as follows:
- their price-fixing date was on January 25 (i.e. 9 days prior to their listing), and
- their exercise ratio are higher than their existing counterpart.
The high exercise ratio of these CWs would improve affordability but an 10-for-1 exercise ratio for a share trading in the RM10-20 bracket and an 4-for-1 exercise ratio for a share trading below RM5.00 is really pushing the limit. Are we likely to see a CW issued one day for Genting with an exercise ratio of 25-for-1? If you cannot afford to buy too many a high priced CW, then you should buy less. After all, one can buy in multiples of 100 units. This lowering of the price of CWs would only induce retail players to throw caution into the wind; the result of which is only too predictable.
I expect the new CWs to trade at premium of about 20%. At that premium and assuming the underlying share prices remained unchanged, Commerce-CA, Magnum-CB & KLK-CB would trade at about RM0.30, RM0.23 & RM0.55, respectively. See Table 2 below, for other possible value for these CWs.
Table 2: Potential value of Commerce-CB, Magnum-CB & KLK-CB at different premium level.
I believe that one must have a very good reason to buy any CW trading at premium above 10%. Take Commerce-CB as an example. If you buy 10 units of Commerce-CB at RM0.20 (i.e. at a premium of 10%), you are wagering that within the next 6 months Commerce share price would go up above RM11.00 (i.e. exercise price of RM9.00 plus [10 X RM0.20]). If that happens, you will only breakeven. Assuming, you pay RM0.30 per unit for the Commerce-CB, Commerce share price must go up to RM12.00 in order for you to breakeven. While nothing is certain in the stock market, the issuer feels confident enough to take the other side of that wager.
Wednesday, February 07, 2007
DRB Hicom has a breakout
This is a trading call. If the share dropped back below RM2.00 in the next day or two, it would be advisable to dispose it, especially if the market were to weaken noticeably.
Chart: DRB Hicom's monthly chart as at Feb 6
UEM Builder has a breakout
This is a trading call. If the share dropped back below RM1.80 in the next day or two, it would be advisable to dispose it, especially if the market were to weaken noticeably.
Chart: UEM Builder's monthly chart as at Feb 6
Maybank-CC & PBB-CA- new CWs issued
When compared to the existing Maybank-CA & CB, the new Maybank-CC is slightly more expensive as it carries a premium of 1% while the existing CWs are trading at slight discount. In fact, the existing CWs of banks are priced fairly attractively when compared to their underlying shares, with the exception of MPlant. The main reason for this attractive low premium is that the underlying share prices have recently made very significant gain and it appears that the CWs prices are struggling to keep pace. Notwithstanding this observation, I expect the 2 new CWs to make some gain as the market would likely to push all the CWs higher. As usual, the new CWs' opening prices will be much higher than expected & I would advise you not to chase these prices any higher than 20% above their IPO/listing prices.
Table: MBB-CC & PBB-CA compared to other existing CWs of banks.
Note: Warrant's price for the new CWs is the CWs' Issue Price
Tuesday, February 06, 2007
Call Warrants- A highly leveraged tool
When I first started my coverage of CWs, the level of awareness & publicity was much lower. I've stated that "one of the reason why I track call warrants is that there are currently very few warrants issued by blue-chip companies. The only warrants that allow investors to benefit from a blue-chip rally are the call warrants (eg. Genting-CA; Maybank-CA & CB; Tenaga-CA & CB; TM-CA & CB etc)." When I looked back on my first post (here), I feel quite sad that only a handful of my clients had invested in CWs.
Nevertheless, I must say that the CWs issued today carry a much higher risk than the earlier CWs because of their short tenor (normally 6 months for the new CWs compared to 2 years for older CWs) and their high premium. When a CW is issued at a premium of 10% (or, more) after the underlying share price has appreciated considerably in the current bullish market condition, the chance of the CWs expiring "outside-the-money" is greater. The losers will be the buyers of these CWs while the winners will be the issuers. Of course, nobody knows how high a share can go and that's where the attraction lies for these CWs. In a frantic market like now, retail players are likely to be drawn in for the easy moneys that can be made in the current CWs play.
Here, I like to highlight the percentage decline amongst the CWs after the market peak in December 12, 2006 (see the table below). From December 8 to December 19, the underlying share price dropped by 4-5% while the CW dropped by 33-34%. The numbers are based on a simple addition of the individual drop for the periods concerned & is likely to understate the percentage decline for both the share price as well as the price of the CWs, but I think it would suffice for our demonstration here. The point that I've made in my first post is very pertinent i.e. "call warrants cannot be ignored by the more sophisticated investors because of the leverage afforded for a given amount of funds. Leverage is however a double-edged sword; you may make higher return, but you may also make bigger losses."
Note: On December 19, when the market rebounded, the CWs gained 15.35% as compared to a 2.29%-gain in the underlying share price.
Market Outlook as at February 6, 2007
Chart: CI's daily chart as at Feb 5
The other thing to note is that the CI has been "gapping up" for the past 2 days as well as today. A gap is formed when opening price movements create a blank spot on the chart. A “gap up” occurs when the low of the day is above the high of the previous day. Gaps are especially significant when accompanied by an increase in volume.
There are 3 types of gap i.e. common gap, continuation gap & exhaustion gap. For now, the big question is whether we are facing continuation gaps & exhaustion gaps. From Stockcharts.com, we have the definitions of these types of gap:
- After an extended or long move, a gap in the direction of the current move is called an exhaustion gap. For an exhaustion gap to be considered valid, prices should reverse soon after the gap and close the gap. After an extended decline, a gap down could signal that the downtrend is about to exhaust itself. An exhaustion gap is confirmed when prices reverse soon afterwards and move above (or "close") the gap. After an extended advance, an exhaustion gap would be confirmed when prices reverse soon afterwards and move below the gap.