Chart 1: KLCI's monthly chart as at April 16

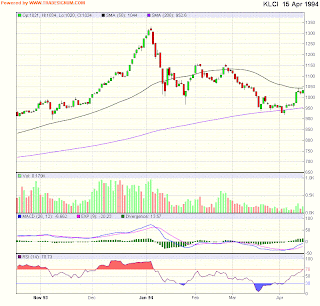
Chart 2: KLCI's daily chart from October 1993 to April 1994
This is a personal weblog, reflecting my personal views and not the views of anyone or any organization, which I may be affiliated to. All information provided here, including recommendations (if any), should be treated for informational purposes only. The author should not be held liable for any informational errors, incompleteness, or delays, or for any actions taken in reliance on information contained herein.


No comments:
Post a Comment