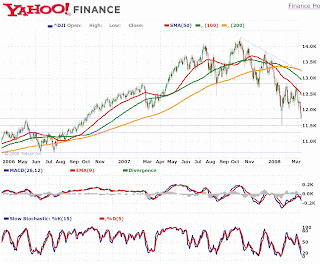
A strong rebounce in the Dow has broken the streak of losses which saw the index breaking below the psychological 12000 level last week (see Chart 1). In the next few days, Dow is likely to continue its upleg. The immediate resistance is at 12600 to 12800 level (see Chart 2 below).

Chart 1: Dow's 5-day daily chart as at March 11, 2008 (source: Yahoo Finance)

Chart 2: Dow's 2-year daily chart as at March 10, 2008 (source: Yahoo Finance)
Note: The latest move by the Fed must be viewed in the light of some very negative development, such as the failure of some investment firms to meet margin calls, sparking fears of forced selling and further deleveraging. Read more about it here and here.
As practising chartists, we know the possibility of chart painting, e.g. announcing rescue package(s) before a strong technical support is in danger of being preached. That is one of the reasons pure fundamentalist despise chartists which I can understand. Since I do not have/believe in sure-win investment methodology, charting is one of my investment tools to improve probability of positive return. In the end I believe the world equity markets are in very serious trouble, e.g. Great Depression of 1930. However I also realise the bearish sentiment is very strong now , e.g. 59% bearish for 12/3/08 aaii.com survey. Any rebound from now will be used by me to get out of my long equity positions. So will the world economy be in deflationary or hyperinflationary environment? In my opinion, financial assets, e.g. stocks and bonds, will be deflated while commodities will be inflated. One of the main reasons is central banks will pump money to slow down the inevitable major/long term decline. Just my two sen :)
ReplyDeleteThis comment has been removed by a blog administrator.
ReplyDeleteI share most of Wan's sentiment with regards to current state of equity market. External economic factors & internal political factors are now putting a heavy down-force on our market.
ReplyDelete