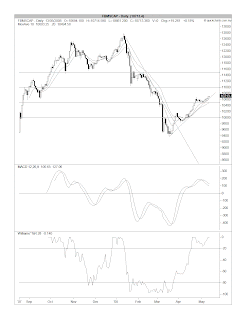
- FBMScap which comprises those eligible companies within the top 98% of the Bursa Malaysia Main Board excluding constituents of the FBM100 Index; and
- FBM100 which comprises the constituents of the FBM Large 30 and the FBM Mid 70 Index.

Chart 1: FBM100 daily chart as at May 13, 2008 (source: Quickcharts)

Chart 2: FBMScap daily chart as at May 13, 2008 (source: Quickcharts)
Now, let's look at the next 2 charts- the FBM-MDQ & FBM2brd. They are:
- FBM2brd comprises all eligible companies listed on the Second Board. No liquidity screening is applied; and
- FBM-MDQ comprises all eligible companies listed on the MESDAQ Market. No liquidity screening is applied.

Chart 3: FBM-MDQ daily chart as at May 13, 2008 (source: Quickcharts)

Chart 4: FBM2rd daily chart as at May 13, 2008 (source: Quickcharts)
If the market continued to inch up, shares in the 2rd Board & the Mesdaq Board might enjoy some recovery, especially when the retailers re-enter the market. You may want to use such rally to reduce your position in these boards.
No comments:
Post a Comment