Chart 1: WTIC's daily chart for 6 months to July 8th (source: Stockcharts.com)

Chart 2: WTIC's daily chart for 2 years to July 8th (source: Stockcharts.com)
One of the big casualties of the sharp run-up in crude oil prices is the airline stocks. From Chart 3 below, we can see XAL has been trending lower since August 2007. From an index reading of 50, it has dropped more than 70% to a low of 15 recently. A recovery in the airline stocks should happen if the crude oil prices entered into a correction phase. An initially tepid recovery may blossom into a strong recovery, if the crude oil prices began to violate any of the above-stated uptrend lines.

Chart 3: XAL's daily chart as at July 8th (source: Stockcharts.com)
Here, we have 2 airline stocks that had been beaten down badly. The first stock is Airasia. From Chart 4 below, we can see that this stock is trending lower in a downward channel. Some price recovery has begun over the past few days as the stock rebounded off the lower boundary of that channel. I expect Airsia to test the upper boundary at RM1.00-1.03 soon. A break above RM1.03 would signal the end of its downtrend. Those who are risk-averse should only enter this stock when the downtrend has been taken out.

Chart 4: Airasia's daily chart as at July 8th (source: Quickcharts)
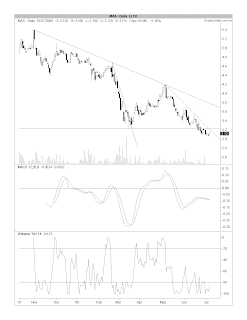
The other airline stock is of course MAS. Like Airasia, it is in a downtrend. The short-term downtrend line resistance is at RM3.20-26. A break above that could see MAS testing its next dwntrend line resistance at RM3.70-80.

Chart 5: MAS's daily chart as at July 8th (source: Quickcharts)
No comments:
Post a Comment