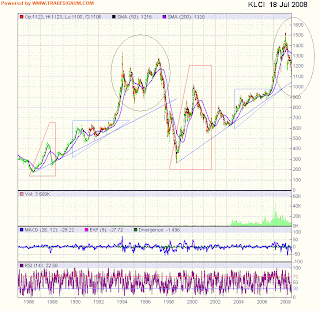
1. Our market was in an uptrend (see the dark blue line) in both these periods. The uptrend line for 1986-97 was violated at the 830 level in August 1997. Our present uptrend line support is at 1050, which may be tested soon.
2. The 1998-2008 uptrend has some important similarities to 1986-97 uptrend. They are:
(a) The market's uptrend commenced with a sharp rebound in 1986 & 1998 even before the economy had begun to recover from the preceding recession (see the red Trapezoids);
(b) After the correction of the initial rebound, the market's uptrend continued until it reached a prolonged consolidation phase (see the light blue Ascending Triangles);
(c) The market's uptrend continued again when the index broke to the upside of the Ascending Triangles. This final phase is marked by sharp rally in stocks & is sometimes called the blow-off stage;
(d) After the blow-off stage, the market entered into a sharp sell-off. In the earlier uptrend, the sell-off after the 1993/4 peak was followed by an attempted strong recovery in 1996, which failed.
3. The duration of the 1986-97 uptrend was 11-12 years. The current uptrend is in its 10th year.
4. The 1986-97 uptrend ended with the onset of the Asian Financial Crisis. Like most equity markets worldwide, we are presently facing strong headwinds from the on-going Financial Crisis enveloping the US & many developed nations.
5. The bear market in 1997/8 was aggravated by political crisis involving the sacking & subsequent trial/conviction of Anwar Ibrahim on sodomy & corruption charges. Anwar Ibrahim is presently being investigated on allegation of committing sodomy.
With so many similarities between the 2 periods under review, who can blame the Malaysian investors for being depressed & having the deja vu experience. Using technical trading rules, one should watch out for the test of the 1050 uptrend line support as well as the very important psychological 1000 level. If these 2 supports are violated, our market could go sharply lower (akin to the 1997/8 bear market). One should however not act on this fear because the uptrend line support may hold & our market could experience a decent rebound. You could then use the rebound to reduce your position. On the other hand, if these supports are violated, the recommended course of action would be to reduce our position.

Chart: KLCI's monthly chart as at July 18th (source: Tradesignum.com)
As at 10.30 am today, the KLCI is down 11.21 points to 1093.83. Most of the other Asian stock markets are however up by 2-3%.
No comments:
Post a Comment