The KLCI rebounded strongly on Friday to close at 1100.50. Gainers out-numbered losers 384 to 223, on volume traded of 520 million units. The rebound coincided with the announcement of the 2009 Budget; month-end closing; and, Merdeka Day's long weekend.
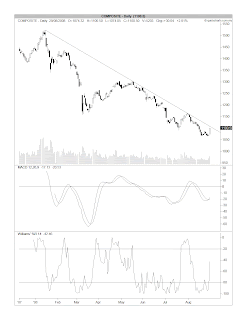
The KLCI may do a follow-through rally this morning but the medium-term downtrend line will pose resistance to any upside move at the 1108-1110 level. Friday's 30-point rally had prompted both MACD & Williams' %R indicators to hook up-- giving a potentially positive short-term outlook to the market. Nevertheless, with the Dow dropping 172 points overnight & nothing very substantive in the announced Budget, I believe that Friday's rally could be a one-day affair.
Chart: KLCI's daily chart as at August 29th (source: Quickcharts)
This is a personal weblog, reflecting my personal views and not the views of anyone or any organization, which I may be affiliated to. All information provided here, including recommendations (if any), should be treated for informational purposes only. The author should not be held liable for any informational errors, incompleteness, or delays, or for any actions taken in reliance on information contained herein.
Friday, August 29, 2008
Monday, August 25, 2008
Leader- a good long-term investment
Leader is the largest manufacture of cable & wire in the country as well as being the 12th largest in Asia. In addition to the manufacturing of cable & wire, the group is also venturing into power-generation in Cambodia, where it is scheduled to complete its 200MW coal fired power plant in Sihanoukville in 2012.
Leader has just announced its results for 2Q2008 ended 30/6/2008, where its net profit increased by 16.4% q-o-q or 13.9% y-o-y to RM18.1 million. Its turnover increased by 6.0% q-o-q to RM678 million from RM640 million, but declined 4.4% y-o-y from RM709 million recorded in 2Q2007.
Leader's financial performance has improved quite significantly in the past 4 quarters, when compared to the preceding 4 quarters. During the periods under consideration, its net profit increased by 54% from RM46.5 million to RM71.5 million, while turnover increased by 10% from RM2.58 billion to RM2.84 billion. EPS has similarly improved from 11 sen to 16 sen. Based on its closing price of RM0.595 as at August 22nd, Leader is now trading at a trailing PE of 3.7 times or at a P/Book of 0.6 times (based on a NTA of RM1.08 per share as at 30/6/2008). At these multiples, Leader is deemed attractive.
From the chart below, we can see Leader is resting on its medium-term uptrend line, with support at RM0.55-56. This coincides with its horizontal support of RM0.55.
Chart: Leader's weekly chart as at August 22nd (source: Quickcharts)
Based on improving financial performance, attractive valuation & good support from the technical perspective, Leader should be a good long-term investment.
Jobst's bottomline slipped
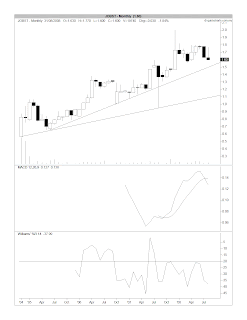
Jobst has announced its results for 2Q2008 ended 30/6/2008, where its net profit dropped 13.4% q-o-q to RM9.1 million from RM10.5 million, while turnover had increased by 8% from RM25 million to RM27 million, for the same periods. When compared to the same quarter last year, net profit increased by 25% while turnover has grown by 35%. The drop in the net profit on a q-o-q basis was attributable to a loss of RM1.3 million on disposal of associate & lower pre-tax profit margin. Pre-tax profit before exceptional items (such as losses on disposal of associate) dropped from 48.7% in 1Q2008 to 44.5% in 2Q2008.
From Chart 1 below, we can see that Jobst's MACD indicator has hooked down & its share price may drift lower to test its medium-term uptrend line support at RM1.50. I believe the uptrend line support is likely to hold. In the unlikely event that this medium-term uptrend line is violated, the share price may drop to test its next uptrend line support of RM1.10. This may happen only in the event of a very sharp selldown in the market.
Chart 1: Jobst's weekly chart as at August 22nd (source: Quickcharts)
Chart 2: Jobst's monthly chart as at August 22nd (source: Quickcharts)
Based on the above, I believe Jobst is still a good medium to long-term investment. Those interested in this stock should aim to accumulate at the RM1.50 level.
Engtex reported higher topline & bottomline for 2Q2008
Engtex reported improved topline & bottomline for 2Q2008 ended 30/6/2008. Its net profit increased by 6.0% q-o-q or 258% y-o-y to RM12.2 million, while turnover increased by 19% q-o-q or 64% y-o-y to RM228 million. Engtex attributed its better performance to "the strong market demand of its metal-related trading products and manufactured steel products in tandem with the uptrend in international and domestic metal prices".
Engtex's EPS averages about 5 sen for the past 3 quarters. If its could maintain that performance for FY2008, its EPS would be about 20 sen. Based on its closing price as at 22/8/2008 of RM1.18, Engtex is trading at a PE of 5.9 times. This is quite attractive.
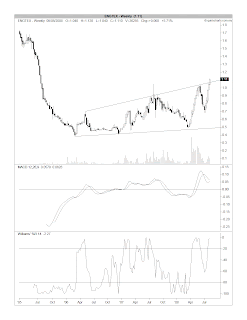
From Engtex's daily chart below, we can see that the share price has been going up in a very steep short-term uptrend, with support at RM1.10-12. As noted previously, the stock's long-term downtrend resistance is about RM1.10-15. A convincing break to the upside of that downtrend could send the stock to the next resistance at RM1.35 and thereafter to RM1.80. Nevertheless, we have to watch closely for any breakdown of the short-term uptrend line, which could send the stock into a short-term correction. The previously correction in June was very sharp, with the share price dropping from a high of RM1.04 on June 2nd to a low of RM0.68 on July 4th.
Chart: Engtex's daily chart as at August 22nd (source: Quickcharts)
Based on the improved financial performance, Engtex could be a good investment for the medium to long-term. However, one should be careful of any potential short-term correction due to its recent sharp price run-up.
Thursday, August 21, 2008
Aji's net profit still growing
Aji has just announced its results for 1Q2009 ended 30/6/2008. Its net profit increased by 3.8% q-o-q or 16.1% y-o-y to RM6.0 million, while its turnover increased by 3.7% q-o-q or 7.8% y-o-y to RM57.6 million.
When I first posted on Aji in November last year (go here), its PE was about 5.9 times. At the point, Aji was trading at RM2.20. 10 months later, Aji was trading at RM2.65 (yesterday's closing price)- a gain of 45 sen. This is quite commendable when one compared this stock's performance with the overall market.
Presently, Aji is trading at a PE of 7.4 times (based on last 4 quarters' EPS totaling 36 sen), or at a P/Book of 0.9 times (based on NTA per share of RM2.97 as at 30/6/2008). If the dividend remained unchanged at 15 sen for FY2009, its dividend yield is now at 5.7%. All in all, Aji is still quite attractive.
From the monthly chart below, Aji will face immediate resistance at RM2.80 & thereafter at RM3.30.
Chart: Aji's monthly chart as at August 20th (source: Quickcharts)
Based on the above, Aji could be a good long-term investment. The share price has run up a bit in the past 2 months, due to the proposed dividend of 15 sen. It would be advisable to wait for the entitlement date of this proposed dividend to lapse (on September 2nd). There is a good chance that the share price will retrace a bit thereafter.
Maybulk's bottomline up, due to ships sale
Maybulk has just announced its results for 2Q2008 ended 30/6/2008. Its net profit increased by 141% q-o-q or 71% y-o-y to RM222 million, while its turnover increased by 3% q-o-q or 27% y-o-y to RM186 million. The increase in net profit was attributable to gain of RM144 million from the sale of a bulker & a tanker. Excluding this gain, Maybulk's pre-tax profit from normal operation has dropped by about 17% q-o-q & 24% y-o-y.
Maybulk, which tested its long-term uptrend line support at RM3.36 a few days ago, has closed at RM3.52 at the end of the morning session today. As noted, Maybulk has a strong horizontal support at RM3.50 (see Chart 1 below).
Chart 1: Maybulk's weekly chart as at August 20th (source: Quickcharts)
With the shipping rates rebounding slightly (see the BDI chart, Chart 2 below), Maybulk's share price should be able to hold onto the horizontal support of RM3.50. If the BDI were to inch up again, Maybulk's share price could move higher. Its immediate resistance will come from the overhead medium-term downtrend line (presently at RM4.00 level).
Chart 2: Baltic Dry Index's daily chart as at August 20th (source: InvestmentTools.com)
********************************************************************************
This is the earlier table, with errors noted thereon. I like to thank "ramatex", the commenter who pointed out the earlier mistake.
BJToto broke its long-term uptrend
BJToto broke its long-term uptrend line two weeks ago. This is the second time the share price broke below its long-term uptrend line at the RM4.80-85 level. The first time it happened, was in early July but the share price had somehow recovered to stay above the uptrend line in late July & early August. From the chart, we can see a medium-term downtrend line has formed, with resistance at RM4.85-90. The break of the uptrend followed either a rounding-top reversal or a double-top reversal (at the RM5.50-55 level). BJToto, which closed at RM4.58 yesterday, can expect support at the horizontal line of RM4.30-40 level.
Chart 1: BJToto's weekly chart as at August 20th (source: Quickcharts)
What do you do with BJToto if you have this stock in your portfolio? While the downside may be limited (or not substantial), you still need to protect that capital. Ideally, you would prefer to sell BJToto when its share price has rebounded up to its medium-term downtrend line. As the share price is presently equidistant to its resistant at RM4.85-90 & its support at RM4.30-40, you will face a dilemma & may choose to hold your position. That may not be the best move since the overall market is in a bearish mode and BJToto has broken below its uptrend. In investment, we have to settle for less than the best. As a wise man once said, "I would rather be generally correct than precisely wrong."
Sime at its strong horizontal support
From the daily chart (Chart 1) below, we can see that the Parabolic SAR has just moved below the CPO price [see the 'blue dot' at the bottom right-hand corner of the price chart]. Thus, a buy signal has been issued using this indicator (go here for more information). I viewed this as a short-term rebound at this stage of the market, but this rebound could be quite strong.
Chart 1: CPO's daily chart as at August 20th (source: ifs.marketcenter.com)
In view of the above, I believe that plantation stocks could also put in a decent rebound. While I am still very cautious about the present state of our stock market overall, I find Sime at the current price of RM6.35 to be very attractive. As noted in an earlier post (go here), Sime has a strong horizontal support at RM6.30. This could be a safe entry into this stock for medium to long-term investment, as well as being a potential trading buy. A decent 10-20% rebound from this price support is possible. From the weekly chart (chart 2) below, we can see that resistance at the horizontal line of RM7.00 & RM8.50 as well as resistance at the downtrend line of RM8.00-20.
Chart 2: Sime's weekly chart as at August 20th (source: Quickcharts)
Tuesday, August 19, 2008
Vietnam stock market may have bottomed
For the past few days, we have become quite accustomed to seeing continuous losses suffered by stock markets throughout the world (including our market). One market has however been rising over the past 2 months & it has even broken above its medium-term downtrend line a few days ago. That market is the Vietnam stock market. Once a top performer among the Emerging Markets (or, was it the Frontier Markets?), the VN-Index (of the Ho Chi Minh Stock Exchange) dropped from its high of about 1100 in October 2007 to a low of about 360 in June this year. On last Monday (August 11th), the VN-Index broke above its downtrend line at the 410 level. Yesterday, it broke above its strong horizontal resistance of 500. The Vietnam stock market has been enjoying steady buying from foreign funds (go here) & the Vietnamese authority is confident enough that it has increased the trading band for transactions on the Ho Chi Minh Stock Exchange to +/-5 percent from the previous +/-3 percent, while that on the Hanoi Securities Trading Centre was widened to +/-7 percent from +/-4 percent yesterday (go here).
Chart: VN-Index's daily chart as at August 18th (source: Bloomberg)
The recovery in the Vietnam stock market is an indication that some markets had dropped so sharply that foreign funds' buying may have started. They must have found the Vietnamese stocks to be too cheap to resist. The same may apply to some stocks in our market, if we have the patient to slowly sift them out.
Monday, August 18, 2008
CPO testing its horizontal support of RM2400
On August 7th, I've posted that CPO may find support at the horizontal line of RM2400 (go here). In that post, I have appended a composite chart which may not be easy to see. Since then, ifs.marketcenter.com has included more data into its weekly chart. I have appended below the latest weekly chart for your easy viewing.
From this weekly chart, we can clearly see that the RM2400 is a good horizontal support. In fact, the CPO is holding quite well at this level for today. If the crude oil- which is up about USD0.56 to USD114.33 as at 4.54 pm (local time)- can put in a strong rebound, the CPO may do the same tomorrow. Then, we may have some recovery in the plantation stocks.
Chart: CPO's weekly chart as at August 15th (source: ifs.marketcenter.com)
USD/MYR may trend higher
The recent strengthening of the US Dollar could be one of the factors depressing our stock market as well as other regional markets. This was first noted in May when the downtrend of USD/MYR was broken on the upside. The short correction that followed, took the shape of an ascending triangle. On August 7th, the USD/MYR broke to the upside of the ascending triangle, at the level of RM3.28/USD1. This signaled the continuation of the uptrend in US Dollar vis-a-vis the Ringgit.
A foreign fund, who is bearish on a particular market (or, merely neutral about that market), could choose to liquidate its position & park its funds in another markets or other classes of assets that it may hold a positive view. It is likely that our local bourse may fall into the category of markets that foreign funds viewed as bearish & therefore had suffered from their selling.
Chart: USD/MYR's weekly chart as at August 15th (source: Saxo Bank Datacentre, via Passion-Trading.com)
Gamuda, viewed from a long-term perspective
Gamuda had a strong rebound over the past seven weeks, rising from a low of RM2.06 recorded on June 23rd to close at its high of RM3.02 last Friday. At the close of the morning session today, the share price dropped 20 sen to RM2.82. This is below the strong horizontal resistance of RM2.85-90 as noted earlier (go here).
A study of Gamuda's monthly chart revealed that the stock had a tendency to end its downtrend in the form of a double bottom reversal. These are marked out as 'A-A1' in 1998 and 'B-B1' in 2006. If this were to recur, then we may see Gamuda's share price re-testing its recent low of RM2.06. This may not happen anytime soon, but it is a possibility that we should bear in mind.
Chart: Gamuda's monthly chart as at August 15th (source: Quickcharts)
Friday, August 15, 2008
Market Outlook as at August 14, 2008
As at 4.50 pm today, the KLCI was down by 14 points to 1095. The sharp drop in the KLCI was partly attributable to the continued losses suffered by plantation stocks. This in turn was due to a 5%-drop in CPO prices. As at 4.45 pm, CPO futures contract for September was down by 5%, from yesterday's close of RM2551 to RM2428.
The weakness in the stock market ahead of the budget announcement doesn't augur well for the market outlook for the coming weeks. Technically, the KLCI is poised to tested its horizontal support of 1089-90 next week (see Chart 1 below). A break below this support would then sent the KLCI to its long-term uptrend line support at 1050 (see Chart 2 below). Next week will be a very interesting week.
Chart 1: KLCI's weekly chart as at August 14th (source: Quickcharts)
Chart 2: KLCI's monthly chart as at August 14th (source: Quickcharts)
Wednesday, August 13, 2008
Gold poised to test its uptrend line support of USD770
Gold prices, which has corrected very sharply in the past 3 weeks, is likely to test the uptrend line support of USD770 soon. It can also find some support at the horizontal line of USD730 (see the chart below).
Chart: Gold's daily chart as at August 12th (source: BullionVault.com)
Gold may benefit from the recent setback in crude oil prices, which will help to alleviate inflation fear at the major central banks. In addition, there is rising economic pressure on the ECB and BoE to lower their real interest rates, which is bullish for gold by increasing the supply of fiat money.
For those who are interested in investing in gold locally, you can either buy gold coins or invest via gold saving passbook. The latter method would dispense with the need to hold the physical gold but the mark-up by the selling institutions would be higher. You can buy gold coins from either UOB or Maybank. To invest via gold saving passbook, you would have to go through Maybank. The mark-up for buying & selling of gold coin is about 3.1-3.2% while for investing in gold via the passbook, the mark-up is 8.0%. To check out the Gold Prices at UOB, go here & click on "Gold Prices". To check out what Maybank has to offer, go here.
Maybulk broke its strong horizontal support of RM3.50
Maybulk, which closed at RM3.48 yesterday, has convincingly broken below its strong horizontal support of RM3.50 when it ended the morning session at RM3.38 (losing 10 sen on a volume of about 977k). Presently, Maybulk share price is near its long-term uptrend line support at RM3.30-36. In the absence of a quick recovery, Maybulk would be drifting lower. While there will be other supports to come (notably the horizontal support of RM3.12-16), the downtrend would have commenced for Maybulk (see Chart 1 below).
Chart 1: Maybulk's weekly chart as at August 12th (source: Quickcharts)
The weakness in Maybulk share price reflects the drop in the freight rates, which can be clearly seen in the chart of Baltic Dry Index below.
Chart 2: Baltic Dry Index's daily chart as at August 12th (source: InvestmentTools.com)
Construction sector receives a lifeline
In the Edgedaily today, there is a report on the government’s latest move in revising the new variation of price (VOP) conditions for government construction jobs (go here). To wit:
The report, which summarized a research report from ECMLibra Research, pointed out that Gamuda is likely to be the biggest beneficiary of this revision. As result, we are now seeing a sharp rise in the share price of Gamuda (gaining 10 sen to RM2.92 as at 10.00 am). From the chart below, we can see that if Gamuda can surpass the strong horizontal resistance of RM2.85-90, it may proceed to test the psychological RM3.00 level.
Chart: Gamuda's daily chart as at August 12th (source: Quickcharts)
The Ministry of Finance had on Aug 6, 2008 released a circular on the revised VOP rules that include an enlarged VOP list.
The new items to be included into the VOP list are for civil engineering works rather than building works and there are six new items rather than 11 as previously stated.
The revised VOP list also qualifies mechanical and electrical (M&E) works for VOP claims and allows VOP for design-and-build contracts on the same basis as conventional contracts instead of just steel bars, even though the 50:50 risk sharing remained.
“Besides further liberalising the VOP claims, the government will also consider a three-month extension for projects which are on-going between Jan 1 and Aug 6,” said ECMLibra Research, adding that the new VOP would be backdated to Jan 1.
The report, which summarized a research report from ECMLibra Research, pointed out that Gamuda is likely to be the biggest beneficiary of this revision. As result, we are now seeing a sharp rise in the share price of Gamuda (gaining 10 sen to RM2.92 as at 10.00 am). From the chart below, we can see that if Gamuda can surpass the strong horizontal resistance of RM2.85-90, it may proceed to test the psychological RM3.00 level.
Chart: Gamuda's daily chart as at August 12th (source: Quickcharts)
Tuesday, August 12, 2008
SSECI broke through the horizontal support of 2600
The Shanghai stock market may continue to trend lower this week. This came before today's report issued by the statistics bureau, which states that consumer prices have risen by 6.3% in July from a year earlier as food costs eased, after a 7.1% gain in June. With the inflation growing at the slowest pace in 10 months, the Chinese government has more room to restrain the yuan's advance and bolster economic growth.
Yesterday, the SSECI broke its immediate horizontal support of 2570-2600. The SSECI may drop to 2000-2200 level before any technical support may kick in. The really strong horizontal support will be at 1750 level (see Chart 1 & 2 below).
Chart 1: SSECI's daily chart for 3-year to August 11th (source: Stockcharts.com)
Chart 2: SSECI's daily chart for 8-year to August 8th (source: Yahoo Finance)
SSECI, which rose from a low of 1000 points in mid-2005 to hit a high of 6000 in late-2007, has now given back 70% of the 5000 points chalked up in the 2005-7 Bull run. Could the Chinese stomach this level of losses? Is this a sign that there maybe trouble ahead for the Chinese economy?
Monday, August 11, 2008
Should we fret about US steel makers selloff?
Last week, I posted about the possibility of a play in steel stocks, in line with the listing of Perwaja (go here). One of the point that I have made is that US steel sector index, DJUSST has posted fairly strong recovery. A few days after that post, the DJUSST fell sharply again. As at last Friday, it closed just below the 400 level. This means that it is now below the strong horizontal support of 430. The next strong support area is at 340-350 level.
Chart 1: DJUSST's daily chart for August 8th (source: Stockcharts.com)
Chart 2: DJUSST's weekly chart for August 8th (source: Stockcharts.com)
I have appended below the table of All Carbon Steel Products Composite Price & Index (June 2006 to July 2008) from MEPS (INTERNATIONAL) LTD, the leading independent supplier of steel market information. From the table, we can see that the Prices & Indices of Steel Products are holding up quite well in all regions, including Asia. However, it was noted that the London Metal Exchange's 3-mth forward contract for billet had dropped from its peak of USD1167 per tonne in late June to USD845 per tonne last week. This was highlighted in an article entitled "Steel prices may have peaked" in the Edge newsletter dated August 11, 2008.
Table: All Carbon Steel Products Composite Price & Index (June 2006 to July 2008) from MEPS (INTERNATIONAL) LTD
With these conflicting signals, the likelihood of a play in the steel sector will be greatly diminished.
Airlines stocks- time for some profit-taking
In line with the expectation that crude oil prices may put in a rebound after testing the long-term uptrend line support of USD110, we shall now examine the possibility of a short-term correction in airlines stocks.
The US Airlines Sector index, XAL has nearly doubled, from a low of 12.6 on July 15th to close at 25.2 last Friday. From Chart 1 & 2 below, we can see that a strong horizontal resistance at 28 is coming up. This level is also the immediate 200-day or 40-week SMA for the index.
Chart 1: XAL's daily chart for August 8th (source: Stockcharts.com)
Chart 2: XAL's weekly chart for August 8th (source: Stockcharts.com)
On our bourse, the two airlines stocks, i.e. Airasia & MAS had rebounded quite well. Airasia gained 48% from its low of RM0.765 to close at RM1.13 last Friday, while MAS gained 32% from its low of RM2.94 to close at RM3.88 last Friday. From the charts below, we can see Airasia will encounter strong resistance at RM1.25 (& thereafter at RM1.40) while MAS's resistance will be at RM4.00 (which was tested on last Friday) and thereafter at RM4.40.
You may consider staggering out your profit-taking between the two resistance levels & retaining some position, in case the prices continue to go higher.
Chart 3: Airasia's weekly chart as at August 8th (source: Quickcharts)
Chart 4: MAS' weekly chart as at August 8th (source: Quickcharts)
Thursday, August 07, 2008
300-Point DOW Gains = Bear Market?
This is a very interesting story that I have picked up from the Big Picture blog (go here). According to the Big Picture, “Merrill Lynch's David Rosenberg was on CNBC this morning, discussing the current Bear Market. He noted that this was the sixth 300 point rally (referring to the Tuesday rally) to occur since September 2007 (markets peaked the next month) -- a period of time which can only be described as a Bear Market… Even more intriguing, he observed that EVERY 300 point DJIA rally has occurred ONLY during bear markets… During the 2000 to 2002 bear market, the DJIA had 15 days where it gained more than 300 points… During the 2002 to 2007 bull market, the DJIA had no days where it gained more than 300 points.”
That's so counter-intuitive that most people would find it very hard to believe. Before you jump to the wrong conclusion, you should be aware that sharp sell-off is also a frequent occurrence in a bear market. See the table below.
CPO outlook as at August 6th, 2008
In line with my expectation that crude oil prices may put in a rebound after testing the long-term uptrend line support of USD110, I will now take a look at the CPO market outlook. Unfortunately, I do not have accessed to a good chart on CPO prices, except for ifs.marketcenter.com (go here). As the period covered in the current chart is very narrow, I have to combine a portion of the current chart with an older chart (from here). The less-than-happy result is given below.
How to see the chart below? Your mind's eye should piece together the bigger left-hand chart with the smaller right-hand chart (guided by the marker "< A" and "A >"). From this, you can see that the strong horizontal support, at about RM2400 is coming soon. CPO Futures for October closed the morning session at RM2759.
Chart 1: CPO's weekly chart as at August 6th (source: ifs.marketcenter.com)
From Chart 2 below, we can see that Plantation index has broken below the immediate uptrend line support of 6500 three weeks ago. The next supports are the horizontal support of 5200 & 5000 as well as long-term uptrend line support of 4400-4500.
Chart 2: Plantation's weekly chart as at August 6th (source: Quickcharts)
When CPO reaches the RM2400-2500 level and the Plantation index comes nearer to the 5000-5200 level, one may look through the list of desirable plantation stocks to invest in. One stock that will feature very high on that list is Sime. From Chart 3 below, we can see that Sime has dropped from its recent high of RM13.40 in January 2008. At the closing price of RM7.15 yesterday, Sime has declined by 47% compared to a 36%-drop for Plantation index (from a high of 8949 to yesterday's close of 5033). Sime's immediate support is at RM7.00 while the very strong horizontal support thereafter is at RM6.30 level.
Chart 3: Sime's weekly chart as at August 6th (source: Quickcharts)
Engtex poised to test its long-term downtrend line
Engtex Group Bhd ('Engtex') is involved in the manufacture of pipes, valves and fittings & plumbing material and the distribution of building materials, general hardware products, steel related products and engineering tools. In the end of 2007, Engtex has also begun to venture into property development.
Based on the 8-quarters results below, Engtex's financial performance has improved significantly in the past 2 quarters. The increase in revenue and net profit were mainly due to "the strong market demand of its metal-related trading products and manufactured steel products in tandem with the uptrend in international and domestic metal prices".
If Engtex can maintain its last 2 quarters' performance, its full year's Basic EPS could be about 20 sen [or, Diluted EPS of 13.7 sen]. As such, Engtex (closed at RM1.11 yesterday) is now trading at a trailing PE of 5.6 times. While this may look inexpensive, this is higher than Hiaptek's trailing PE of about 3.7 times (based on Hiaptek's closing price of RM1.57 & annualized EPS of 42 sen [using last 2 quarters' EPS of 21 sen)]. For more on Hiaptek, go here.
Engtex share price has been rising steadily for the past one month, from a low of RM0.68 in July 7th (see Chart 1 below). What's more interesting is that the share price is poised to test the long-term downtrend line resistance at RM1.11-15 soon (see Chart 3 below). A break above that level (with good volume) would be very bullish for this stock. The next resistance would be the horizontal lines of RM1.35 & RM1.80.
Chart 1: Engtex's daily chart as at August 6th (source: Quickcharts)
Chart 2: Engtex's weekly chart as at August 6th (source: Quickcharts)
Chart 3: Engtex's monthly chart as at August 6th (source: Quickcharts)
While a break above RM1.11-15 could be bullish, one must take note that Engtex's share price has risen by 63% in a span of just one month. As such, this potential investment (or trade) should be viewed with caution & protective stop should be employed.
Crude Oil may test its uptrend line support at USD110
When crude oil prices broke the immediate uptrend line support at USD132, we expected a price correction & a possible test of the long-term uptrend line support (go here), currently at about USD110 (see the chart below). The much-welcome price correction is now underway and some analysts are beginning to talk about the prices of crude oil at below USD100. I think that is premature at this stage. The USD110 support will not yield without a good fight. I will go with a scenario that crude oil prices would have a decent oversold rally from USD110 & thereafter enter into a price consolidation, similar to that experienced during the period from November 2007 to January 2008 (marked as "A"). In that earlier price consolidation, crude oil prices moved sideway & traded between USD85 and USD100 for 3 months before breaking to the upside.
Chart: WTIC's daily chart for 2 years to August 6th (source: Stockcharts.com)
With crude oil prices closing at USD119 yesterday, the test of the long-term uptrend line support of USD110 is very near. A strong oversold rally could lead to correction in the equity market.
Chart: WTIC's daily chart for 2 years to August 6th (source: Stockcharts.com)
With crude oil prices closing at USD119 yesterday, the test of the long-term uptrend line support of USD110 is very near. A strong oversold rally could lead to correction in the equity market.
Tuesday, August 05, 2008
MMC under heavy selling
MMC has announced two acquisitions today. It proposed to acquire the Senai Airport Terminal Services Sdn Bhd ('Senai Airport') at RM1.95 billion (to be paid via the issuance of 696.4 billion shares in MMC at RM2.80 per share) and to buy up the remaining shares in Johor based-water treatment player, Aliran Ihsan Resources Bhd (AIRB), which he does not own, for a cash sum of RM240 million (or, 90 sen per share).
Investors are not happy with these two proposals because both Senai Airport and AIRB are controlled by the major shareholder of MMC, Syed Mokhtar. The Senai Airport acquisition is more controversial, as Syed Mokhtar had taken over the Sultan Ismail Airport- the main asset under Senai Airport- in October 2003 for RM80 million cash from Malaysia Airports Holdings Bhd. This acquisition is however inclusive of a 2,700-acre (1,092.6 hectares) freehold land which will be developed into a cargo hub, logistics and high-tech park among others. According to MMC’s press release, the land has a gross development value of about RM9.5 billion. [For more on these acquisitions, go here. You may like to check out MMC's earlier acquisition of Johor Port (go here), where some felt that the shareholders of Johor Port (now privatized) were not fairly treated.]
MMC came under heavy selling, right from the opening bell. As at 4.00 pm, MMC was down 60 sen to RM2.13. Volume traded was more than 15 million units. From the chart below, we can see that the immediate horizontal support is at RM2.10 & thereafter at the psychological RM2.00. A break of the RM2.00 level could potentially see this stock testing the RM1.50-65 support.
Chart: MMC's weekly chart as at August 4th (source: Quickcharts)
For investors who are keen on MMC, I think the safer course of action is to wait for the dusk to settle. We need to see whether the RM2.10 & RM2.00 can hold. In any event, I believe a recovery in MMC share price may take a while.
NTPM may have a bullish breakout at RM0.52
NTPM Holdings Bhd ('NTPM') is involved in the manufacture and trading of paper products, such as toilet rolls, tissues, and serviette. The company offers tissue products consisting of facial tissue, toilet paper, kitchen towel rolls, and napkins under the Premier, Royal Gold, and Cutie brand names; and personal care products comprising feminine hygienic products, cotton products, baby diapers, and incontinent products under Intimate, Diapex, and Premier Cotton brand names.
NTPM's financial performance has been improving steadily in the past two years. From the table below, we can see that NTPM's net profit for the past 4 quarters has increased by 5.8% to RM34.1 million from RM32.2 million in the preceding 4 quarters. Turnover for the same periods has increased by 13.1% from RM270.7 million to RM306.2 million.
Based on its closing price of RM0.53 yesterday, NTPM is trading at a PE of 9.8 times (based on its EPS of 5.4 sen fro the past 4 quarters) or at a P/Book of 1.9 times (based on its NTA per share of 29 sen as at 31/3/2008). At these multiples, NTPM may be considered fairly valued, with limited upside.
From the chart below, NTPM share price has been consolidating one & half year. A breakout above RM0.50-52 could see the share price moving higher to a target of RM0.60-65. While its closing price yesterday is above this breakout level, the "breakout" was not accompanied with a convincing volume.
Chart: NTPM's weekly chart as at August 4th (source: Quickcharts)
Based on the potential bullish breakout, NTPM could be a trading BUY. This breakout needs to recruit further support over the next few days, failing which it could turn into a bull trap. A similar breakout was noted previously (go here), where the stock moved from RM0.36 to RM0.50 in Jan-Feb 2007. Could the same happen again?
Monday, August 04, 2008
Yechiu has finally rewarded...
I read the proposed privatization of Yechiu (go here) with great satisfaction. The proposed privatization involved a voluntary general offer to acquire all the remaining 29,005,117 Share representing approximately 35.45% of the issued and paid-up share capital of the Company not already held by the Joint Offerors, at an offer price of RM2.00 per Share.
I have posted on Yechiu on November 2006, where I had noted its attractive valuation as well as the breakout of a price pattern that could have been the start of a rally in the share price (go here). To be frank, Yechiu's share price has never rallied in a convincing manner. This could be due to insufficient research coverage & following by fund managers. The tight price range & the lack of clear price trend may have deterred many retail players. See the chart below.
Chart: Yechiu' daily chart as at August 1st (source: Tradesignum.com)
Looking at the last quarterly results for 31/3/2008, we can see that Yechiu's EPS for the past 4 quarters amount to 49 sen. Based on its closing price of RM1.51 as at 30/7/2008, Yechiu was trading at a trailing PE of 3.1 times. See the 8-quarter results below.
Yechiu's proposed privatization provides a good example that a thorough fundamental analysis can uncover good stocks at attractive valuation. This is in sharp contrast to the case of Axis, where a careful study of the account should raise serious doubts about the company's financial position. Unfortunately, there are many cases where the accounting problem will spring a surprise because one could not discover the problem through the account. It is in these latter cases that we need to rely on protective stops to safeguard our capital.