Chart 1: S&P500's daily chart as at November 19, 2008 (Source: Stockcharts.com)
S&P500 may find support at its 2002 low at 770 (see Chart 2 below).

Chart 2: S&P500's daily chart for 10 year to November 19, 2008 (Source: Yahoo Finance)
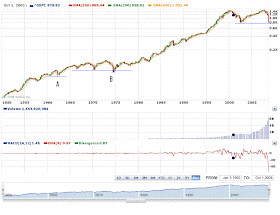
If you look at Chart 3 below, which plots the S&P500 from 1950 until today, you will see that S&P500 cyclical lows have rarely approached the preceding lows. This has happened on 2 previous occasions, i.e. 1962 (denoted as 'A') & 1974 (denoted as 'B'). Of these occasions, only in 1974 did the S&P500 made a low that was lower that the preceding low. As such, we can expect the S&P500 to find support at 770 & stage a rebound from there. Failure is not an option.

Chart 3: S&P500's daily chart for 58 year to November 19, 2008 (Source: Yahoo Finance)
No comments:
Post a Comment