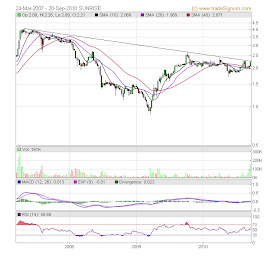
Chart 1: Sunrise's weekly chart as at Sept 23, 2010_arithmetic scale (Source: Quickcharts)
An alternative view of the Sunrise's price movement is given below by the weekly chart plotted on logarithmic scale. We can see that the stock has yet to break above its downtrend line yesterday. With the gain of 10 sen (price was at RM2.31 as at 4.38pm), Sunrise has successfully broken above the downtrend line, based on this log scale chart.

Chart 2: Sunrise's weekly chart as at Sept 23, 2010_log scale (Source:Tradesignum)
Based on the bullish breakout, Sunrise could be a good trading BUY.
For a recent write-up on this stock, check out this article in the Edge Financial Daily dated September 15, 2010.
Hi Alex,
ReplyDeleteThere are many penny stocks surge up today, especially those property counters such as Kbunai, Talam and Asiapac. Is the market attention now shifting to the penny stocks after a handsome gain in blue-chips counter recently?
Any comment on ASB? I have struck in this counter for couple years. Is there a bullish breakout with sudden surge in volume and price on Friday?
Please advise.
Thank you.
Kelvin888
Hi Alex
ReplyDeleteCan u tell me what the charts say for kfc and tenaga ? thanks a lot.
EPF has been big seller of sunrise for the past few trading days. why do you think EPF does not notice the positive technical chart movement of this counter?
ReplyDeleteHi Alex,
ReplyDeleteDo you know how can I obtain implied volatility figure of a structured warrant traded on KLSE?
regards
Hi hkloon
ReplyDeleteI don't look at implied volatility for any instrument on our exchange. I am aware that some securities are more volatile than others but I don't look at the implied volatility because it's too technical for my usage.
Hi kelvin888
ReplyDeleteThe stock market is like any market. If there is a demand, the price of stock will go up. The question is whether the demand is "genuine" or is it manufactured.
After a long bull market, we are finally seeing the second & third liners rallying as well as better participation by retailers. Hopefully, this trend can sustain for a while.
ASB may have a volatility breakout last week. Its immediate resistance is at RM0.18 & then RM0.20, RM0.25 & RM0.30. ASB is still burdened by legacy issue that dates back to the Asian Financial Crisis. This is reflected in its unimpressive profit track record. With a share capital of RM491 million as at 30/6/2010, ASB's annualized turnover is only about RM210 million while annualized net profit is only RM11.4 million.
Based on this, you should try to exit this stock by taking advantage of any rally in the share price over the next few weeks.
Hi nightradersdk
ReplyDeleteI am positive on Tenaga, which may test the horizontal resistance at RM10.00 and then RM10.50 & RM11.00.
I am less positive on KFC, whish may drop to the psychological level of RM3.00. If that level is also violated, it may test its uptrend line support at RM2.85-2.90.
Hi CK
ReplyDeleteEPF may not be following technical analysis when it does its portfolio re-balancing. If everyone follow the same rule book, trading would not be possible. For that matter, even if everyone uses the same rule book, some may jump ahead while other may choose to be 'contrarian'. These two groups are always pulling or tucking at the support or resistance, which makes following the technical guidelines so much more challenging. However, one must admit that, without them, our trading life would be uneventful. Trading would have all the predictability of placing money in an FD account.
hello alex ,
ReplyDeletethis is what my sifu commentted about u & yr call on sunrise ->
http://samgang.blogspot.com/2010/09/v-another-failure-of-tak-ada-akal.html