Thursday, June 30, 2011

Adventa- running on the spot

Results Update

Adventa announced its results for QE30/4/2011 yesterday. Its net profit increased by 13% q-o-q but declined by 29% y-o-y to RM4.6 million, while turnover was lowered by 2% q-o-q but increased by 29% y-o-y to RM104 million. From Chart 1, we can see that the company's turnover has been rising steadily since 2006 while profit has been flattish during the same period, except for the steady decline in the past 4-6 quarters. This decline is attributable to higher input cost (especially, latex cost) which Adventa had failed to pass on completely to its customers. However, the latex prices are expected to decline further and this could lead to better financial performance for Adventa & other rubber glove producers. See Chart 2 below.


Table: Adventa's 8 quarterly results


Chart 1: Adventa's last 25 quarterly results


Chart 2: RSS3 prices from 2002 to June 2011 (Sorce: Rubbernet)

Valuation

Adventa (closed at RM1.96 yesterday) is now trading at a PE of 10 times (based on last 4 quarters' EPS of 19 sen). At this PE multiple, Adventa is deemed full value.

Technical Outlook

Adventa has been declining since it peaked at RM3.55 in January 2010. It broke the psychological RM2.00 level 2 days ago. Its next support is the long-term uptrend line at RM1.90 & then the horizontal line at RM1.85.


Chart 2; Adventa's weekly chart as at June 29, 2011 (Source: Quickcharts)

Conclusion

Based on recent financial performance, valuation & technical outlook, one would be hard pressed to make a case to invest in Adventa. However, the stock has been beaten down so much that its downside is likely to be limited. For those who have this stock, I think you are better off holding onto it. For the others with a contrarian streak & a long-term view, I believe investing in Adventa at RM1.85-1.90 level can be considered. Just don't bet your farm on it!

TSM- bottom-line affected by supply chain disruption?

Results Update

TSM has just announced its results for QE30/4/2011. Its net profit dropped 63% q-o-q or 44% y-o-y to RM4.7 million while turnover dropped 16% q-o-q but rose 25% y-o-y to RM92 million. The company explained the decline in its top-line & bottom-line was due to the Supply Chain disruption brought on by the recent Japanese Earthquake & Tsunami. However, if you look at Chart 1 & Chart 2 below, you can see that the company's top-line peaked 2-4 quarters ago. If not for the addition of the new business of die-cast & precision manufacturing, TSM's top-line would have dropped earlier. The other thing to note is the new business of die-cast & precision manufacturing is a loss-making, except for a small pre-tax profit in QE31/1/2011.

TSM has indicated that the worst is behind it in term of disruption to supply chain was in the month of May & it expects the situation to normalize by September. This means that the results for the next quarter would likely to be below par.


Table: TSM's 8 quarterly results


Chart 1: TSM's last 28 quarterly results


Chart 2: TSM's last 5 quarterly results by segments

Valuation

TSM (closed at RM1.54 as at June 30, 2011) is now trading at 5.8 times (based on last 4 quarters' EPS of 26.57 sen). With the next quarter result expected to be weak (how weak we can say), TSM's earning for current year would have to be lowered. I believe TSM is currently trading at fair value, after taking into consideration possible recovery in the wire harness in later part of the year & the possible continuation of losses to be incurred by the die-cast & precision manufacturing business.

Technical Outlook

From the chart below, we can see that TSM has broken below its long-term uptrend line support at RM1.72. Its next support is at the horizontal line at RM1.60 & then at RM1.45.


Chart 3: TSM's weekly chart as at June 29, 2011 (Source: Quickcharts)

Conclusion

Based on the deterioration in the financial performance and poor technical outlook, we should take profit on TSM.

Wednesday, June 29, 2011

Yinson- time for some profit-taking

Results Update

Yinson has just announced its results for QE30/4/2011. Its net profit increased by 6% q-o-q or 51% y-o-y to RM7 million while turnover increased by 30% q-o-q or 7% y-o-y to RM197 million. However, Yinson's bottom-line has benefited from a gain of RM1.18 million on disposal of subsidiary, Yinson haulage Sdn Bhd. If this item is excluded from the bottom-line, Yinson's net profit dropped 11.5% q-o-q but still rose 26% y-o-y to about RM6 million.


Table 1: Yinson's last 8 quarterly results


Chart 1: Yinson's last 14 quarterly results

Valuation

Yinson (closed at RM1.82 yesterday) is trading at a PE of 6.3 times (based on last 4 quarters' adjusted EPS of 28.8 sen). Yinson, which is involved in the provision of transportation, shipping, forwarding, and marine transport services, can be compared to Tasco. However, Tasco is currently trading at a PE of 5.5 times, based on its last 4 quarters' EPS of 27.1 sen & closing price of RM1.49 yesterday. If the market is willing to value this sector at around 6 times earning, then Yinson's upside potential is considered limited.

Technical Outlook

Yinson broke above its 'loudhailer' formation at RM1.05-1.10 in May & rose to its recent high of RM1.87. If we extrapolated the potential upside by adding the width of the 'loudhailer' to the breakout level, that target price is about RM1.85-1.90. As such, the present price could be a good level for some profit-taking.


Chart 2: Yinson's monthly chart as at June 28, 2011 (Source: Quickcharts)

Conclusion

Based on technical consideration & market valuation cap, I believe it is a good time to take some profit on Yinson.

Analabs- improved bottom-line could be catalyst for re-rating

Background

Analabs Resources Berhad ('Analabs') is an investment holding company, which is involved mainly in the recovery and sale of recycled products primarily in Malaysia and Singapore. One of its subsidiaries, Coveright Surfaces is involved in the manufacturing and sale of resin impregnated papers. (Note: My first post on this stock was in March 2010 but the stock did not sizzle.)

Recent Financial Results

Analabs has just announced its results for QE30/4/2011, where its net profit jumped 104% q-o-q or 91% y-o-y to RM7.1 million while its turnover was up 9% q-o-q but declined by 2% y-o-y to RM36 million. The company attributed its improved bottom-line to higher turnover and/or higher sale of better margin products, i.e. resin impregnated papers.


Table 1: Analabs's last 8 quarterly results


Chart 1: Analabs's last 18 quarterly results

Valuation

Analabs (closed at RM1.59 yesterday) is now trading at a PE of 5.3 times (based on last 4 qaurters' EPS of 29.8 sen). At this PE multiple, Analabs is deemed fairly attractive.

Technical Outlook

Analabs is still in an uptrend line, with support currently at RM1.60. It broke above its medium-term downtrend line at RM1.55-1.57 in May but the stock only enjoyed a short-lived rally to RM1.70 before retreating back to its uptrend line.


Chart 2: Analabs's weekly chart as at June 28, 2011 (Source: Quickcharts)

Conclusion

Based on improved financial performance, attractive valuation & positive technical outlook, Analabs is a good stock for medium to long-term investment.

Tuesday, June 28, 2011

Tecguan- powered higher by palm oil business

Background

Teck Guan Perdana Bhd ('Tecguan') is involved in the two main businesses:
1) Oil Palm products business, where it owns oil palm plantation as well as operates a kernel crushing plant; and
2) Cocoa products business, where it manufactures & sells cocoa products as well as trades in dried cocoa beans.

In the past 4 years, Tecguan's cocoa products business has shrunk while the oil palm products business has grown significantly. The bulk of Tecguan's oil palm products business comes from the kernel crushing plant as the acreage of its oil palm estates is only 2020 acres. Based on this small acreage, we can deduce that 10-15% of its turnover came from FFB sales while the balance came from sale of kernel oil.


Table 1: Tecguan's 1Q Segmental Results for the past 4 FY

Part of a large Conglomerate

Tecguan is a part of the HTG Holdings Sdn Bhd group of companies. Its business dealings with related companies could be fairly extensive. This situation could become problematic when substantial amount of money is owing to its holding company while equally large amount is due from related companies. For example, if you look at the Annual Report for FY2010, there is an amount due from a related company of RM70.6 million, which was classified under Current Assets. Tecguan in turn owed its holding company RM79.1 million, which was classified as Non-current Liabilities. It also owed related companies a total of RM13.5 million, which was classified as Current Liabilities. All amount advanced or owed carries interest at a rate of 5.55% pa.

In its detailed accounts for QE30/4/2011, Tecguan's Trade & Other Receivable dropped to RM17.8 million from RM73.4 million as at 31/1/2011 while its Cash Balances increased to RM46.4 million from RM11.5 million. On the Liabilities side, the Other Payables (which should include the Amount due to Holding Company) dropped slightly from RM78.6 million to RM64.2 million.

Recent Financial Results

Tecguan's financial performance has improved significantly over the past two quarters. When compared to last year, Tecguan's net profit increased by 52% despite an unchanged turnover. Net profit has however declined by 20% q-o-q to RM4.0 million despite a 22%-increase in turnover to RM54 million. The decline in bottom-line on a q-o-q basis is due mainly to lower FFB prices.


Table 2: Tecguan's last 8 quarterly results


Chart 1: Tecguan's last 16 quarterly results

Financial Position

Tecguan's financial position as at 30/4/2011 is deemed satisfactory, with current ratio at 3.3 times and debt to equity ratio at 0.3 time. Tecguan was holding cash balances of RM46 million as at 30/4/2011. However, this cash position is likely to be money advanced by its holding company for unspecified purposes. In the past, the money has been on-lend to related companies.

Valuation

Tecguan (closed at RM0.83 at end of the morning session) is trading at a PE of 2 times (based on annualized EPS of 40 sen). Even adjusted for the current slide in the price of CPO, Tecguan is deemed very cheap.

Technical Outlook

Tecguan has been in a bottoming phase from 2006 until early this year. It broke above its strong horizontal line at RM0.80 today. Its next resistance is the horizontal line at RM0.95-1.00.


Chart 2: Tecguan's monthly chart as at June 27, 2011 (Source: Quickcharts)

Conclusion

Based on good financial performance and attractive valuation, Tecguan can be a good stock for long-term investment. The upside breakout above the RM0.80 horizontal line could signal the start of a new upleg; thus, a possible trading BUY. However, Tecguan is such an integral part of the HTG group of companies that it is bound to be afflicted with issues of corporate governance and transparency. These issues could affect investors' enthusiasm for the stock.

Monday, June 27, 2011

CPO- to test its RM3000 psychological support soon.

As at 4.00pm, CPO futures for August was trading at RM3086, down RM30 from last Friday close. When you look at the CPO chart bellow, we see the Parabolic SAR (short for 'stop-and-reversal' indicator) has moved above the CPO price. This negative sign could signal the continuation of the downtrend for CPO. The immediate support for CPO is at RM3000. If the psychological RM3000 mark is violated, CPO could drop further & test its uptrend line support at RM2600. With this correction in CPO, the outlook for Plantation stocks is likely to turn negative.


Chart 1: CPO's weekly chart as at June 24, 2011 (source: ifs.marketcenter.com)


Chart 2: CPO's weekly chart from October 2008 to June 24, 2011 (source: ifs.marketcenter.com)

Presently, the weekly chart for Plantation index is still positive. The support for Plantation index is at the 40-week SMA line at 7700. If this level is violated, the uptrend for plantation stocks would be over & they would reverse.


Chart 3: Plantation index's weekly chart as at June 24, 2011 (Source: Tradesignum)

This post reminded me of my post in April 2008 on CPO breaking the uptrend line then as well as the reversal for the plantation sector in that month. Are we about to see something similar? We will have to wait & see.

Friday, June 24, 2011

Crude Oil prices may weaken further

Industrialized oil consumer countries yesterday announced the release of 60-million barrels of oil from government stockpiles, driving oil down more than 6%. The 28-member International Energy Agency (IEA) said it would release 2-million barrels a day (bpd), mostly of crude, over an initial 30 days to fill the gap in supplies left by the disruption to Libya’s output. The US will provide half the volumes from its huge 727-million barrel crude reserve, with Europe supplying 30% in crude and refined products and the rest coming from Pacific Ocean states belonging to the Organisation for Economic Co- Operation and Development. For more, go here.

The question to ask is why was this decision taken only at this point in time. After all, if you look at the chart for WTIC, we can clearly see that the uptrend line was violated about two weeks ago. Notice the MACD indicator is now deep inside the negative territory, which normally signal the start of a bear trend.


Chart 1: WTIC's daily chart as at June 23, 2011 (Source: Stockcharts)

Below, we have a slightly different view of the state of the crude oil market, as represented by Brent crude, but the outlook is the same. The chart is a weekly OHLC chart plotted on linear scale, unlike the above WTIC chart which is a daily line chart plotted on log scale. Brent has broken its immediate uptrend line at USD110. It may find support at the horizontal line cum long-term uptrend line at USD90 and thereafter the horizontal line support at USD70. The MACD has already hooked down. The ADX is dropping very fast while the -DI is rising to meet a decline +DI. Stochastic RSI is oversold, a pre-condition for a bear trend.


Chart 2: Brent's weekly chart as at June 23, 2011_plotted on log scale (Source: LC LiveCharts)

As such, I expect crude oil prices to weaken further in the weeks ahead.

QL- time to take profit

Background

QL Resources Bhd ('QL') is involved in 3 main businesses, i.e. marine products manufacturing, Crude Palm Oil milling and integrated livestock farming. In the recent quarters, QL's financial performance has been very much dependent on Crude Palm Oil milling and integrated livestock farming. For detail of the contribution of the 3 main business, see Table 1 below.


Table 1: QL's segmental report for 4Q2011 & FY2011

Recent Financial Performance

We can see that Integrated Livestock Farming division is the most important division in QL, as it contributes 57% of its turnover & 68% of its pre-tax profit. The pre-tax profit margin of this division has improved from 8.5% in QE31/3/2010 to 9.6% in QE31/3/2011. The Marine Product Manufacturing division is the second largest division, contributing 22% of turnover & 26% of pre-tax profit. The profit margin of this division dropped sharply from 14% to 9%. As a result of the sharp drop in profit margin of the Marine Product Manufacturing division, QL's overall pre-tax profit margin slid from 8.4% to 8.0%.


Chart 1: QL's profit margin for the past 21 quarters

For QE 31/3/2011, QL's net profit dropped by 4.8% q-o-q to RM31.6 million despite a 11.5%-increase in Turnover to RM503 million. When compared to the same quarter last year, QL's net profit was up 19% while turnover was up 22%.


Table 2: QL's last 8 quarterly result


Chart 2: QL's last 21 quarterly results

Recent Completed Corporate Exercise

In January this year, QL completed a private placement of 20.828 million shares at RM5.60 each. This was followed 1-to-2 Share Split as well as the issuance of free warrant of 1 warrant for every 20 shares owned, both were completed on February 8. As a result of these exercises, QL's outstanding shares increased from 395.173 million units to 832.002 million units today. We have noticed many times that a generous bonus issue or share split would lead to share overhang which would subsequently depress the performance of the share price for many months.

Valuation

QL(closed at RM3.24 yesterday) is now trading at a PE of 20.6 times (based on last 4 quarters' EPS of 15.71 sen). At this multiple, QL is considered overvalued.

Technical Outlook


QL broke its accelerated uptrend line (St-St) at RM3.25 in early June. Subsequent attempt to climb above the uptrend failed. QL's next support would be the horizontal & psychological level of RM3.00. If this support also failed, QL could slid to the long-term uptrend line (SS) where support is at RM2.50-2.60.


Chart 3: QL's weekly chart as at June 23, 2011 (Source: Quickcharts)


Chart 4: QL's monthly chart as at June 1, 2011_log (Source: Tradesignum)

Conclusion


QL is a very well-managed company and an excellent stock for long-term investment. I first recommended this stock to my client in 2003 (before I started this blog) & until today, my clients still ask occasionally whether I have another QL to recommend. Notwithstanding this sentiment, I believe QL is now a trading SELL given the poor technical outlook and trading at high PE multiple. It could be a good BUY again when/if it touches the RM2.50-2.60 level.

Haio- calm returned

Results Update

Haio has just announced its results for QE30/4/2011. Its net profit increased by 35% q-o-q to RM8.5 million while turnover increased marginally by 1% to RM58 million. The improvement was attributed to "the recovery of MLM division... (which) has been emphasizing heavily in motivation and product training programs. The trip incentive campaign has successfully attracted a wider group of lower level core distributors which had contributed higher revenue to the MLM division".

When compared to the same quarter last year, Haio's net profit was lower by 40% while turnover was similarly lower by 41%. "The drop in revenue and pre-tax profit was mainly due to lower contribution from its principal subsidiary, the multi-level marketing (“MLM”) division, which remains as one of the largest contributor to the group". This explanation for the decline in financial performance on a y-o-y basis juxtaposed against the better financial performance on a q-o-q basis is somewhat confusing, but it bring out the importance of MLM division to Haio's overall financial performance. It also reflects the sharp decline in MLM business in the past one year. A better picture is given in Chart 1 below. However, some stability has returned to Haio's MLM business but it is still too early to expect a sharp recovery.


Table: Haio's last 8 quarterly results


Chart 1: Haio's last 25 quarterly results

Valuation

Haio (closed at RM2.16) is now trading at a PE of 15 times (based on last 4 quarters' EPS of 14.44 sen). At this multiple, Haio is overvalued. The only way one can justify this high PE is that the market believe that Haio can stage a dramatic recovery. Can it?

Technical Outlook

Haio broke below its intermediate term uptrend line (St-St) & long-term uptrend line(SS) in May & December 2010. Haio needs to go through a bottoming phase, which we have yet to see. Would it bottom at RM1.80-2.00 or RM1.30-1.50? We will have to wait & see.


Chart 2: Haio's weekly chart as at June 20, 2010 (Source: Tradesignum)


Chart 3: Haio's monthly chart as at June 1, 2010_log (Source: Tradesignum)

Conclusion

Based on overvaluation & poor technical outlook, Haio remained a stock to be avoided. However, we have noted that its financial performance has regained some measure of stability & the stock is woth close track for possible sign of recovery.

Thursday, June 23, 2011

RHBCap- buyers strike ended merger talk

According to a report in Malyasian Insider, Malayan Banking Bhd (Maybank) and CIMB Holdings Bhd have decided to abandon their separate plans to take over RHB Capital due to the higher price for a block of the bank’s shares sold recently. For more, go here.

This news can only be bad for RHBCap, which explained why the stock has been dropping for the past few days. This morning the stock hit a low of RM9.05. It may revisit this level again and possibly testing the psychological level of RM9.00. If the latter failed, the next strong support is the uptrend line & horizontal line at RM8.50.


Chart: RHBcap's daily chart as at June 23, 2011_11.00am (Source: Quickcharts)

Wednesday, June 22, 2011

LionInd- another HIGH RISK trade?

LionInd rallied strongly to close at RM1.87 today. The strong buying was probably driven by rumors that Baosteel may be buying an undisclosed stake in Amsteel Mill Bhd for a sum of USD1 billion. For more, go here.

As a result of the sharp rally, LionInd broke above its downtrend line at RM1.65 in the afternoon. Its next resistance is the horizontal line at RM1.95 & then the psychological level of RM2.00.

Given the poor sentiment in our market presently & the sharp rally in LionInd this afternoon, this is one possible trading BUY that I would be most hesitant to recommend. If you choose to go in, be sure to put on your protective stop.


Chart: LionInd's daily chart as at June 22, 2011 (Source: Quickcharts)

Scientx- poised to test its all-time high of RM2.94?

Background

Scientex Inc Bhd ("Scientx") is involved in the manufacture of pvc & pu leather sheeting; stretch film; pp & pe woven bags & fabrics bags; flexible intermediate bulk containers & corrugated carton boxes; trading in building materials & textile products; and property development.

Property development contributes about 69% of the group's operating profit, while manufacturing contributes the balance. Compared this to QE30/4/2010 when property development only contributed about 48% of group's operating profit. The group's property development is concentrated in Johor (in Pasir Gudang, Kulai & Skudai) and a smaller project in Malacca.

Results Update

For QE30/4/2011, Scientx's net profit increased by 6.9% q-o-q or 21.2% y-o-y to RM20.4 million while turnover incraesed by 11.5% q-o-q or 21.1% y-o-y to RM217 million. Both the manufacturing & property development divisions saw higher turnover.


Table: Scientx's last 11 quarters' result


Chart 1: Scientx's last 23 quarterly results

Financial Position

Scientx's financial position as at 30/4/2011 is deemed healthy, with current ratio at 1.5 times and debts to equity ratio at 0.13 time. Debtors' collection period is satisfactory at 52 days.

Valuation

As Scientx's bottom-line comes from manufacturing & property development of a ratio of about 3:7, we can compute a fair PE for Scientx as follows:

Group PE = Property division PE + Manufacturing division PE
= [0.7 x 7 times] + [0.3 x 10 times]
= 4.9 times + 3 times
= 7.9 times

Based on the last 4 quarters' EPS of 34.5 sen, Scientx's fair value is about RM2.73. Scientx, which closed at RM2.70, is fully valued.

Technical Outlook

Scientx made a new all-time high of RM2.94 on February 24 this year. In the process, the stock broke above the strong horizontal line of RM2.50. Its current immediate support & resistance are at RM2.70 & RM2.80, respectively. The stock looks set for an attempt at the recent high.


Chart 2: Scientx's daily chart as at June 21, 2011 (Source: Tradesignum)


Chart 3: Scientx's monthly chart as at June 21, 2011 _plotted on log scale (Source: Tradesignum)

Conclusion

Based on good financial performance & satisfactory financial position, Scientx is a good stock for long-term investment. However, it is trading very near to its fair value of RM2.73. This plus the recent high of RM2.94 could cap the upside of this stock.

TChong- breaks above its downtrend line

TChong has broken above its downtrend line at RM4.50 yesterday. As at 10.07am this morning, TChong was trading at RM4.69 with volume traded of 1093 board lots. See the daily & weekly chart below. For more on its recent financail performance, go to my earlier post.


Chart 1: TChong's daily chart as at June 22, 2011_10.00am (Source: Quickcharts)


Chart 2: TChong's weekly chart as at June 22, 2011_10.00am (Source: Quickcharts)

Based on the above technical breakout, TChong could be staging a recovery soon. The stock could be a good medium-term investment. The good entry level is the 10 to 20-w SMA line at RM4.48-4.58.

Tuesday, June 21, 2011

MAA- a HIGH RISK trade explored

Yesterday, MAA recorded a price limit down of 30% to close at RM0.725. A lot has been written about this sell-off. One of the better report is given by Business Times (here). I am going to give my opinion on what's the likely support level for this stock.

From June 2009 to December 2010, MAA was in a gradual downtrend line (RR). On December 17, 2010, MAA broke above that downtrend line at RM0.74-0.75 and rallied until it hit a high of RM1.55 on April 8, 2011. On June 8, MAA attempted to challenge the earlier high but failed. It managed to reach a lower high of RM1.48. On June 20, MAA closed at the low of RM1.03 which was slightly lower than the past 10 weeks low of RM1.04 (recorded on April 5). Yesterday, the stock gapped down on opening & never seriously attempted any recovery.

MAA will probably tested the tentative uptrend line (SS) support at RM0.70. If that support failed, it may test the support from the downtrend line (RR) at RM0.68. Finally, it may test the strong horizontal support at RM0.60-0.62.

For those who wish to try this HIGH RISK trade, you should set your protective stop accordingly. I believe the RM0.60-0.62 level could be a good entry & 3-4 sen below that should be your stop-loss level. Good luck.


Chart: MAA'a daily chart as at June 21, 2011 (Source: Tradesignum)

Genting SP- still in an uptrend line

One reader asked about Genting SP, a stock which I monitor regularly. Genting SP's short-term outlook is negative as the 50 & 100-day SMA lines have crossed below the 200-day SMA line. However, it is good to note that the stock is still in an uptrend line, which started in late 2008. The support of that uptrend line is at S$1.70-1.75. I have attached two daily charts for your viewing.


Chart 1: Genting SP's daily chart from Sept 1, 2008 to June 21, 2011 (source: Yahoo Finance)


Chart 2: Genting SP's weekly chart from Jan 2003 to June 21, 2011 (source: Yahoo Finance)

Based on the above, I believe Genting SP could be a trading BUY when it touches the S$1.70-1.75. However, it must be noted that a breakdown of the uptrend line would be bearish for this stock and as such, you should take the necessary precaution to safeguard yourself.

Timecom- the crunch time is here

Timecom broke its medium-term uptrend line at RM0.84-0.85 on May 30. Yesterday, it broke below its horizontal & psychological support of RM0.80. See Chart 1 below.


Chart 1: Timecom's daily chart as at June 21, 2011_10.05am (Source: Quickcharts)

With the above bearish breakdown, Timecom is likely to slide to its long-term uptrend line with support at RM0.70. See Chart 2 below. As at 10.05am this morning, Timecom is trading at RM0.70. Would the stock rebound back from here or would it break through the long-term uptrend line? A breakdown below the long-term uptrend line would be very bearish for this stock.


Chart 2: Timecom's weekly chart as at June 20, 2011 (Source: Quickcharts)

Timecom is at the technical crossroads. It could be a good buying opportunity if the long-term uptrend line support at RM0.70 can sustain. If it failed, Timecom's uptrend would be over & the stock could enter into a sustained downtrend.
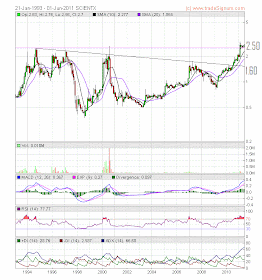
Note: Time Engineering is offering to sell its stake in Timecom to its shareholders at RM0.53 each. This could be the main reason for the sell-off in Timecom. While this may have some impact, it does not change the fundamental of Timecom. As such, the selldown in this stock could be a buying opportunity.

Coastal- may have a bearish reversal

Coastal has broken to the downside of its triangle at RM3.58-3.60. It is struggling to recover above the breakdown level over the past 2 days, without success. This breakdown could be a reversal pattern and Coastal could drop back to its psychological support of RM3.00 & then its strong horizontal support of RM2.90.


Chart 1: Coastal's daily chart as at June 21,2011_9.45am (Source: Quickcharts)


Chart 2: Coastal's weekly chart as at June 21,2011_9.45am (Source: Quickcharts)

Based on technical consideration, it is advisable to take some profit on Coastal.

Monday, June 20, 2011

MPHB- spooked by competitor's new game

Berjaya Sports Toto Bhd will introduce a new game, which is similar to the 4D Jackpot introduced by Magnum 4D last year. This game is likely to boost its sales and expand its market share. As a result, the share price has risen from RM4.30 to a recent high of RM4.50. For more, go here.

BJToto has just announced its results for QE30/4/2011, where its net profit dropped 9.3% q-o-q to RM104 million on the back of a 5.9%-increase in turnover to RM901 million. The decline in net profit on a q-o-q basis was attributable to poor performance by the Philippines operation, which recorded a lower turnover & net profit. Compared to the same quarter last year (QE30/4/2010), net profit increased by 29% while turnover was up 5%.


Chart 1: BJToto's daily chart as at June 20, 2011 (Source: Tradesignum)

The rise of BJToto coincided with the drop in MPHB, the parent of Magnum. From Chrta 2 below, we can see that MPHB has broken below the accelerated uptrend line S2-S2 and may soon test the next accelerated uptrend line S1-S1. The support at uptrend line S1-S1 is about RM2.85 and the next support is at the horizontal line of RM2.70.


Chart 2: MPHB's daily chart as at June 20, 2011 (Source: Tradesignum)

I believe that this decline is overdone, driven by fear that the new 4D Jackpot game from BJToto would eat into Magnum 4D Jackpot game. While Magnum 4D Jackpot may suffer a drop, I believe this drop will not be significant. As such, I believe MPHB presents a good buying opportunity at the present price of about RM2.85-2.90.