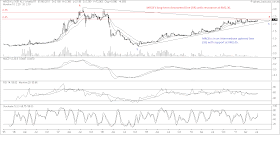
Chart 1: MRCB's daily chart as at July 6, 2011_11.00am (Source: Quickcharts)
Based on the weekly chart, we can see that the long-term downtrend line resistance is also at RM2.30. Immediately above that level is the horizontal line RM2.35. If MRCB can break above these 2 resistance levels, it may test the next resistance at RM2.75 & thereafter the 2008 high of RM3.00-3.05.

Chart 2: MRCB's weekly chart as at July 6, 2011_11.00am (Source: Quickcharts)
Based on technical consideration, MRCB could be a good trading BUY if it can break above the RM2.30 resistance on convincing volume.
MRCB hit high of 2.33 and closed at 2.30 with 118,700 shares transacted. On 4/7, OSK has a call for trading buy at RM2.20 with fair value of RM2.58.
ReplyDeleteMRCB involvment in "River of Life" project may bring some interest to this counter in short term.
Hi winner,
ReplyDeleteThanks for sharing.