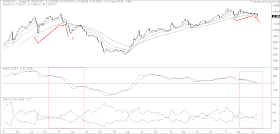
I have appended below the charts for FBM-KLCI, FBMScap & FBMFLG with the self-explanatory lines. In particular, you can see how I compare the current market action with what we saw in early 2008. In 2008, the FBM-KLCI- dominated by blue chips- enjoyed a technical rebound after the sharp sell-off (denoted as 'A' in the FBM-KLCI chart). Further weakness pushed the market lower before a bear rally kicked in (denoted as 'B' in all three charts). We may see the same pattern again in the weeks ahead.
The immediate support for FBM-KLCI is at the 40-week SMA line at 1518 as well as the psychological 1500 level. Unless you are super-agile or a masochist, I would advise you not to try your hands in this tricky market. The odds are heavily staked against you.

Chart 1: FBM-KLCI's weekly chart as at Aug 5, 2011_11.00am (Source: Quickcharts)

Chart 2: FBMScap's weekly chart as at Aug 5, 2011_11.00am (Source: Quickcharts)

Chart 3: FBMFLG's weekly chart as at Aug 5, 2011_11.00am (Source: Quickcharts)
No comments:
Post a Comment