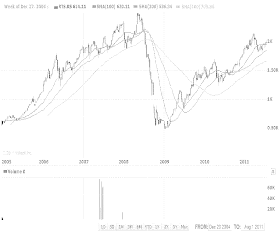
1) entered or entering bearish market (AOrd, BVSP & CAC)
2) hovering at critical support (HSI, BSE, MXX, FTSE & S&P500)
3) breaking critical support (DAX)
4) tested critical support & recovered (STI)
5) still going higher (RTSI)
6) sideway (SSEC)
Based on these observations, I believe that equity markets are in a very precarious state. Further economic weakness in US, signs of hard landing in China or signs of contagion in Europe could trigger a sell-off in global equity markets. We must exercise greater caution in this dangerous time.
Take a look for yourself. If need be, go to the chart by clicking on the link.
A) East Asia & Australia

Chart 1: HSI's daily chart as at Aug 1, 2011 (Source: Yahoo Finance)

Chart 2: STI's daily chart as at Aug 1, 2011 (Source: Yahoo Finance)

Chart 3: AOrd's daily chart as at Aug 1, 2011 (Source: Yahoo Finance)
B) BRIC plus Mexico

Chart 4: BVSP's daily chart as at Aug 1, 2011 (Source: Yahoo Finance)

Chart 5: RSTI's daily chart as at Aug 1, 2011 (Source: Yahoo Finance)

Chart 6: BSE's daily chart as at Aug 1, 2011 (Source: Yahoo Finance)

Chart 7: SSEC's daily chart as at Aug 1, 2011 (Source: Yahoo Finance)

Chart 8: MXX's daily chart as at Aug 1, 2011 (Source: Yahoo Finance)
C) Europe & U.S.

Chart 9: FTSE's daily chart as at Aug 1, 2011 (Source: Yahoo Finance)

Chart 10: DAX's daily chart as at Aug 1, 2011 (Source: Yahoo Finance)

Chart 11: CAC's daily chart as at Aug 1, 2011 (Source: Yahoo Finance)

Chart 12: S&P500's daily chart as at Aug 1, 2011 (Source: Yahoo Finance)
Hi Alex:
ReplyDeleteI m more than agreed of what has been said . Like it or not , the markets had entered the bear territory n there are no turning back.