Chart 1: Proton's 20-min chart as at Dec 2, 2011_12.20pm (Source: Quickcharts)
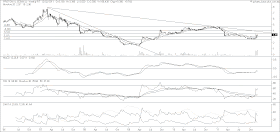
With the above breakout, Proton may continue to rise. Its immediate resistance is at the horizontal line at RM3.50 & thereafter the long-term downtrend line at RM3.90.

Chart 2: Proton's weekly chart as at Dec 2, 2011_12.20pm (Source: Quickcharts)
Again, I have to reiterate that I have no idea what could be the catalyst for the current play on Proton. It could be that Proton may have secured some assembling contracts from car makers or assemblers who are affected by the recent flood in Thailand.
Note: As at 2.35pm, Proton was trading at RM3.47.
morning,
ReplyDeleteMr Alex,
Normally Bollinger band and Moving Average, how many days I shall put?
Thanks !
Hi xh08,
ReplyDeleteFor Bollinger Bands, I just use the default setting, which period: 20 & Deviation: 2.
As for moving average, it depends on whether you are looking at daily charts or weekly charts or monthly charts. I usually put in 3 MA lines to my charts as follows:
- daily charts (20, 50 & 100-day SMA lines)
- weekly charts (10, 20 & 40-week SMA lines)
- daily charts (10, 20 & 30-month SMA lines)
However, there is no hard & fast rules. Just do what works for you.