Technical Outlook
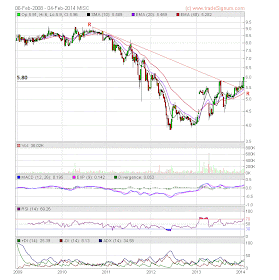
Last week, MISC broke above its strong horizontal resistance at RM5.80. What prompted this breakout?

Chart 1: MISC's weekly chart as at Feb 5, 2014 (Source: Tradesignum)
Recent Financial Results
The latest quarterly results is QE30/9/2013. Then, MISC reported higher net profit of RM401 million (+33% q-o-q; 189% y-o-y) while revenue was flattish (-5% q-o-q; + 0.5% y-o-y). Profit increased q-o-q due to reversal of over-provisions from completed projects in the Heavy Engineering segment; lower op. cost in the Petroleum segment (due to smaller fleet size) and higher share of profit from lease commencement of Gumusut-Kakap FPS in June 2013.
Past financial performance

Table: MISC's last 8 quarterly results

Chart 2: MISC's last 30 quarterly results
Industry Outlook
The
Towards the end of November, though, the index broke out of its long-term downward trend line—something was different. By the end of December, the Index almost hit 1,000. During the first two weeks of January, it continued to soar higher, reaching 1,222 by January 16, 2014. Year-over-year growth also shot up, and it was last seen at ~93.3% on January 16, 2014—its highest growth in years. What has been driving this rise?

Chart 3: Baltic Dirty Tanker Rate as at Jan 22, 2014 (Source: Frontline, Fearnleys via Marketrealist.com)
The reason for the rally: A drop in the supply of tankers! Again, Marketrealist.com has this to say:
Since mid-2013, tanker industry’s supply had grown at close to zero percent. As depressed levels of shipping rates persisted, companies continued to scrap in order to raise cash to pay interest and debt, or to remove vessels as part of cost cutting efforts. If a vessel were expected to incur significant survey or maintenance costs in 2014, it gave managers one more reason to scrap.
Plus, fewer newbuild deliveries perhaps contributed more to zero supply growth in late 2013. While scrapping activity remained high, it wasn’t as high as the late months of summer 2013, based on IHS Global Limited’s data. Since week-to-week supply growth held up near zero, and sometimes even went negative, we may infer that new supply deliveries were very limited.
There you have it: The reason for the rally in MISC. If high tanker rates can persist, we can expect better result for MISC and the improved performance would underpin the rally in the share price.

Table 2: Current Tanker Fleet & Orderbook (Source: Frontline, Fearnleys via Marketrealist.com)
Conclusion
Based on bullish technical outlook, MISC could be a trading BUY.
Note:
In addition to the disclaimer in the preamble to my blog, I hereby confirm that I do not have any relevant interest in, or any interest in the acquisition or disposal of, MISC.
Dear Alex,
ReplyDeleteThanks for the sharing.
What is the next support and resistance for MISC upon broke up RM5.80 and RM 6.00, ahead of the 13 Feb 2014 4Q13 result announcement ?
2) Do you see any potential re-offer takeover by PETRONAS in coming 3 months?
Thank you
Hi Ivan,
ReplyDeleteI had just posted on MISC. For the support & resistance level, please refer to that post.
On the possibility of another takeover offer from Petronas, I feel the chance of that happening to be low. The share price has gone up and I doubt Petronas will get more takers unless it offers a much higher price which I think it would not do.