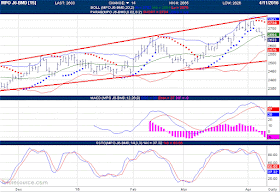
1. MACD has crossed below the MACd signal line
2. Slow stochastic failed to match its recent high
3. +DMI is drifting lower, along with ADX & ADXR
As at 4:30pm, FBMKLCI was trading at around 1712. This failure to stay above the uptrend line, SS could lead to further correction in the market for the rest of the week.

Chart 1: FBMKLCI's daily chart as at April 11, 2016_4.15pm (Source: Shareinvestor.com)
As noted in the previous post, FBMKLCI could have bottomed. In line with this outlook, the short-term correction is likely to be mild. It is likely to find support at the psychological 1700 mark or 1685 level.

Chart 2: FBMKLCI's monthly chart as at APr 11, 2016 (Source: ShareInvestor.com)
The positive sentiment will come from the strengthening of our MYR via-a-vis USD. I expect the USD-MYR to trade around 3.70-3.80 for the near future. this is despite correction in CPO & short-term uncertainty in crude oil market.

Chart 3: USD-MYR's weekly chart as at Apr 11, 2016 (Source: Investing.com)
CPO rallied past the RM2630-2640 level in late March. It moved in an irregular upward channel, with resistance at RM2750 & support at RM2510.

Chart 4: CPO's daily chart as at Apr 11, 2016 (Source: ifs.marketcenter.com)
In the short-term, WTIC will try to break above & stay above its downtrend line, RR at USD39.00. If it can do so, the downtrend for WTIC is over and crude oil prices may begin to recover.

Chart 5: WTIC's weekly chart as at Apr 8, 2016 (Source: Stockcharts.com)
No comments:
Post a Comment