Our market has been hanging onto the 1717 support for the past 7 days. It rebounded on last Wednesday when the US markets rallied to new high. For us, the rally could not sustain and it was back to the 1717 support last Friday.

Chart 1: FBMKLCI's weekly chart as at Nov 24, 2017 (Source: Malaysiastock.biz)
In my last market outlook, I compared our market today with what we experienced in late 2014. In September 2014, the index broke below the 200-day SMA line. Tday we saw a similar breakdown in late October. In 2014, the index dropped another 9-10% after it breached the 200-day SMA line. Today I think we are more likely to see a smaller decline, say 5% after the breach. Assuming it dropped 5%, then we may see a low of 1662.

Chart 2: FBMKLCI's daily chart as at Nov 24, 2017 (Source: Malaysiastock.biz)

Chart 3: FBMKLCI's daily chart as at October 2013 to Mar 2015 (Source: Malaysiastock.biz)

Chart 4: FBMKLCI's daily chart in late 2014 & Nov 2017 (Source: Malaysiastock.biz)
The past few days we have seen many articles on the strengthening of our MYR. I feel that the effective uptrend line for USD-MYR is represented by SS on the chart below. That uptrend line was violated when USD broke below MYR4.20. The immediate support is the horizontal line at 4.10-4.11. If this support is taken out, USD-MYR will quickly test the psychological 4.00 mark. Below that, the next support levels are 3.88-3.90 & 3.72-3.73.

Chart 5: USD-MYR's monthly chart as at Nov 24, 2017 (Source: Investing.com)
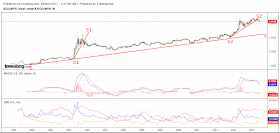
Below is the chart of SGD-MYR. The long-term uptrend is unmistakable. We can draw an uptrend line, SS to represent that uptrend. Within this long-term uptrend line, we can see 2 periods where SGD-MYR spiked up. The first one was in 1997-1998 (see uptrend line, S1-S1). The next one was in 2014-2017 (see uptrend line, S2-S2).
After SGD-MYR broke the accelerated uptrend line, S1-S1, it slowly dropped back towards the long-term uptrend line, SS - over a period of 3 years. After the pullback, SGD-MYR hovered above SS for the next 8 years and only touched SS in 2010, 2012 & 2013.
As you can see, SGD-MYR has broken below the latest accelerated uptrend line in September this year. If the earlier movement can be a guide, we can expect SGD-MYR to pullback towards the long-term uptrend line, SS over a period of 3 years. Thus SGD-MYR may go down to 2.90 by 2018, 2080 by 2019 & 2.70 by 2020.

Chart 6: SGD-MYR's monthly chart as at Nov 24, 2017 (Source: Investing.com)
In an environment of a stronger MYR, we can expect importers to show better earnings. Thus car makers should do better for that reason as well as the penned up demand. I also expect big-ticket consumer companies, such as Panamy to do better. Amway, which imports from US, should do better. The opposite is true for exporters. How much of an impact is the big question! We have been living in a period of weak MYR for a long 3 years that we almost assume that it would be a permanent affair. Clients and readers have asked me whether I am serious whenever I talked about the strengthening of the MYR. I don't base it on politics nor the price of crude oil; I based it on charts. The charts tell me that the times they a-changin'. We better change with the time.
****
In an earlier market outlook in July, I took the view that our market could make new high culminating with a market top in 2019. The strengthening of MYR may play a role in that scenario.

The chart above shows that FBMKLCI tracks S&P500 very closely. The correlation failed in 1998 & in the past 3 years. It was due to the weakening of MYR. Once MYR has stabilized, our market should participate in the rally. That's still my view. Thus I believe that the correction in the weeks ahead could be an opportunity to buy in the market.
As always, good luck in your investment!
No comments:
Post a Comment