Over the past 3 days, Axis Incorporated Bhd ('Axis') share price dropped by 79% from last Friday's close of RM1.66 to RM0.35 yesterday. The stock has been suspended this morning. Yesterday, its Board of Director announced that it would not be submitting its Audited Financial Statements due to unresolved issues raised by the external auditors, Messrs Howarth.
What are the unresolved issues raised by the external auditors, Messrs Howarth? I think one of the issues raised could be the Other Receivables, Deposits & Prepayments, which jumped from RM25.0 million as at 31/3/2007 to RM151.6 million as at 31/3/2008 (see Table 1 below). A breakdown of this item is given in Note 15 (see Table 2 below). Essentially, the company advanced RM93.0 million to its Suppliers & RM52.2 million to its Sub-contractors as at 31/3/2008. Why did it do it? According to the Note, the Advances to the Suppliers was to secure the supply of fabric, embroidery, accessories and yarn at a pre-determined prices (because raw materials' prices were escalating), while the Advances to Sub-contractors was in the ordinary course of business. In the past, there were also Advances to Sub-contractors, but the amount was not so big.
It is interesting to note that the company's Trade Receivables & Inventories had dropped during that periods. Its Trade Receivables dropped from RM214.9 million to RM197.4 million, while its Inventories declined from RM56.4 million to RM33.6 million. Could the decline in these 2 items due to a drop in its Turnover from RM441 million for FYE31/3/2007 to RM406 million for FYE31/3/2008, resulting in a drop in working capital requirement? Or, could the drop in Trade Receivables & Inventories be related to the rise in Other Receivables, Deposits & Prepayments- possibly due to wrong classification?
Table 1: Axis' Assets details as at 31/3/2008
Table 2: Breakout of Other Receivables, Deposits & Prepayments
In the past 1 year, Axis was in the news in not a positive light on two occasions. It was reported that MALAYSIAN Rating Corporation Bhd ('MARC') had downgraded Axis' RM100 million debt notes to "negative", following its breach of the covenanted debt to equity ratio of 1.5 times. The rating was subsequently revised back to "developing" as Axis was at an advanced stage of the refinancing exercise, having obtained approval for the facilities from the relevant bank (go here). Since then, there was no further news on the debt notes' refinancing. It is possible that the debt notes were refinanced because the gearing ratio had jumped up substantially in the 4Q2008 ended 31/3/2008 (see Table 3 below). What is interesting is that while Axis was reported to have violated the covenanted debt to equity ratio of 1.5 times in October 2007, my calculation of gearing ratios (whether as Total Borrowings to Shareholders' Funds or as Total Liabilities to Shareholders' Funds) as per Table 3 did not reveal a ratio higher than 1.2 times for either periods ended 31/12/2007 or 30/9/2007. How did the earlier violation come about?
Table 3: Axis' Gearing Ratios as at 31/3/2008, 31/12/2007 & 30/9/2007
In March this year, Axis was in the news again, in a story regarding “forced selling” of stocks that are pledged to Global Trader in return for a leveraged line of credit (go here). It was reported that "(s)hareholders of the affected companies are said to have pledged their shares to Global Trader’s office in Bangkok. Following the liquidity crunch faced by its parent company in the UK, the administrators scrutinized the accounts of its clients, especially in its Bangkok branch. It sold the pledged shares and other assets of accounts that had a margin shortfall. This in turn triggered a massive forced selling of the stocks that were pledged. Companies affected are said to have included …Axis Incorporation Bhd. "
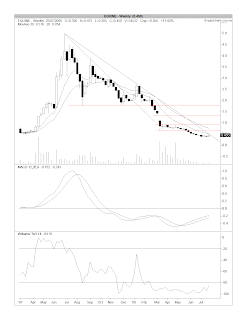
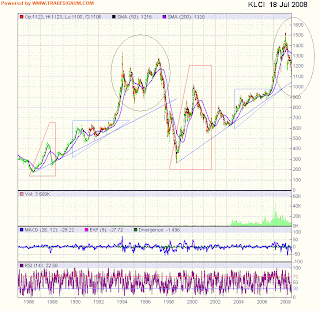
From Chart 1 below, we can see how the share price was hammered down when the Global Trader story came out as well as when its unaudited results for FYE31/3/2008 was released. The current round of selling had pushed the share price to a new all-time low (see Chart 2).
Chart 1: Axis' daily chart as at July 30th (source: Tradesignum.com)
Chart 2: Axis' monthly chart as at July 29th (source: Quickcharts)
We will have to wait & see how this unpleasant mess will be played out. As accounting scandals become more frequent, we are reminded again that the important aspect of investment is risk management. If one has a large exposure to a stock like Axis, the drawdown or loss could be so substantial that it would take a few years to recoup the capital.
This is a personal weblog, reflecting my personal views and not the views of anyone or any organization, which I may be affiliated to. All information provided here, including recommendations (if any), should be treated for informational purposes only. The author should not be held liable for any informational errors, incompleteness, or delays, or for any actions taken in reliance on information contained herein.
Wednesday, July 30, 2008
Tuesday, July 29, 2008
BKoon may have a bullish breakout, but ...
Boon Koon Group Bhd ("BKoon") is involved in the manufacture of commercial vehicle bodies as well as the rebuilding of commercial vehicles. BKoon's financial performance for the last quarter ended 31/3/2008 has been quite disappointing. Net profit dropped 53% q-o-q or 67% y-o-y to RM1.8 million. Its turnover dropped 13% y-o-y to RM46.8 million, but was up 1.6% from the immediate preceding quarter. The company attributed the drop in net profit to the decrease in profit margin resulted from clearance exercise of slow moving inventories and the continued unfavorable movement in foreign currencies. The topline decline (compared to last year) was due to the relatively lower demand and longer on-the-road processing.
If the negative factors depressing its profitability were to subside, then BKoon's net profit could normalize to 12-14 sen per share. BKoon (closed at RM0.24 yesterday) would be trading at a PE of 2 times (assuming an EPS of 12 sen). Its P/Book is also very attractive at 0.3 times (based on NTA per share of RM0.76 as at 31/3/2008).
Why then is this stock dropping? From the Balance Sheet as at 31/3/2008, we can see that its current ratio is quite comfortable at 1.64 times (compared to 1.50 times as at 31/12/2007). The increase in current ratio was attributable to a drop in its short-term borrowings. Total bank borrowings remained relatively unchanged and its gearing ratio remained very high at 1.46 times (compared to 1.51 times as at 31/12/2007). The main reason for the high gearing ratio is the need for a large working capital, to finance its inventory (due to the slow conversion cycle from parts & components to finished vehicles pending certification) and the need to provide some suppliers' credit to its buyers. I believe that BKoon is under-capitalized for its current operation.
The sharp decline in its share price can be traced to continuous selling by 2 substantial shareholders, i.e. The Blackhorse Emerging Enterprises Fund (handled by UBS AG)& an undisclosed fund (handled by HSBC Trustee). These 2 funds collectively hold 21.5 million shares in BKoon (or, constituting about 15.5% of its present outstanding share capital). Against such over-sized & determined sellers, would any investor dare to step into the ring & be a contrarian?
This morning, BKoon's share price has a big jump to hit a high of RM0.315 as at 9.45 am. It appears to have broken above its medium-term downtrend line at the RM0.30 level. I doubt this breakout can sustain, but we will have to wait & see.
Chart: BKoon's weekly chart as at July 28th (source: Quickcharts)
Monday, July 28, 2008
Equine's big price run-up
Equine is presently having a big price run-up. From last Friday's close of RM0.45, the share price moved up early & broke above its medium-term downtrend line resistance at RM0.50-52 at about 10.10 am. Could the reason for the present movement in the share price be due to a change in the shareholders in the company?
Equine's share price had a big move last year, when it rose from a low of RM0.47 in March 2007 to a high of RM5.00 in June 2007. The company has a 25%-stake in Abad Naluri, which in turn is involved in the proposed development of the Penang Global City Centre (PGCC) [go here for more details]. Since the last General Election where the Penang State Government fell into the hands of the Opposition, the outlook of Equine has been rather bleak. We will have to wait & see whether a change in the shareholders would lead to an improvement in Equine.
Chartwise, Equine's immediate horizontal resistance levels are at RM0.65, RM0.95, RM1.35 (closing of the gap) & RM1.75. It may be premature to look at any price higher than RM1.00 at this present moment. Or, maybe not.
Chart: Equine's weekly chart as at July 25th (source: Quickcharts)
Friday, July 25, 2008
Ranhill may have a bullish breakout
Ranhill is having a very strong price run-up. As at 4.20 pm, the share price is at RM1.20 (gaining 23.5 sen from yesterday's close). From the weekly Chart 1 below, we can see that Ranhill's downtrend line resistance is at RM1.15. This means that Ranhill may have a bullish breakout, accompanied with substantial volume.
From the monthly Chart 2, we can see that Ranhill had a false breakout in February 2007 at RM1.40 level. In that breakout, Ranhill went as high as RM1.67 before pulling back below the breakout level. Is the current breakout a repeat of the February 2007 breakout? We will wait & see. One possible explanation for the current move is a re-rating of Ranhill that might have been brought on by its takeover of Ranhill Utility Bhd.
Chart 1: Ranhill's weekly chart as at July 24th (source: Quickcharts)
Chart 2: Ranhill's monthly chart as at July 24th (source: Quickcharts)
Thursday, July 24, 2008
Natbio's topline & bottomline dropped sharply
Natbio has just reported its results for the 1Q2009 ended 31/5/2008. Its net profit dropped 89% q-o-q or 84% y-o-y to RM1.2 million while its turnover dropped 31% q-o-q & 31% y-o-y to RM30.8 million. The company explained that the sharp fall in its turnover was due to weaker consumers' sentiment & higher selling prices for its products. Consequently, its net profit plummeted.
The big question is how would this producer of Ali Café instant coffee & Power Root energy drink cope as the economy slowdown continues?
From the weekly chart below, the stock's downtrend appears to be intact. My earlier report that the share price could have bottomed was proven wrong (go here).
Chart: Natbio's weekly chart as at July 23th (source: Quickcharts)
Based on the poor results for the last quarter, we should avoid Natbio until we can see improvement in its financial performance.
Monday, July 21, 2008
Market Outlook as at July 18th, 2008
Today, I like to make a comparison of our present market for the period from 1998 until today with an earlier period from 1986 to 1997. These are the observations:
1. Our market was in an uptrend (see the dark blue line) in both these periods. The uptrend line for 1986-97 was violated at the 830 level in August 1997. Our present uptrend line support is at 1050, which may be tested soon.
2. The 1998-2008 uptrend has some important similarities to 1986-97 uptrend. They are:
(a) The market's uptrend commenced with a sharp rebound in 1986 & 1998 even before the economy had begun to recover from the preceding recession (see the red Trapezoids);
(b) After the correction of the initial rebound, the market's uptrend continued until it reached a prolonged consolidation phase (see the light blue Ascending Triangles);
(c) The market's uptrend continued again when the index broke to the upside of the Ascending Triangles. This final phase is marked by sharp rally in stocks & is sometimes called the blow-off stage;
(d) After the blow-off stage, the market entered into a sharp sell-off. In the earlier uptrend, the sell-off after the 1993/4 peak was followed by an attempted strong recovery in 1996, which failed.
3. The duration of the 1986-97 uptrend was 11-12 years. The current uptrend is in its 10th year.
4. The 1986-97 uptrend ended with the onset of the Asian Financial Crisis. Like most equity markets worldwide, we are presently facing strong headwinds from the on-going Financial Crisis enveloping the US & many developed nations.
5. The bear market in 1997/8 was aggravated by political crisis involving the sacking & subsequent trial/conviction of Anwar Ibrahim on sodomy & corruption charges. Anwar Ibrahim is presently being investigated on allegation of committing sodomy.
With so many similarities between the 2 periods under review, who can blame the Malaysian investors for being depressed & having the deja vu experience. Using technical trading rules, one should watch out for the test of the 1050 uptrend line support as well as the very important psychological 1000 level. If these 2 supports are violated, our market could go sharply lower (akin to the 1997/8 bear market). One should however not act on this fear because the uptrend line support may hold & our market could experience a decent rebound. You could then use the rebound to reduce your position. On the other hand, if these supports are violated, the recommended course of action would be to reduce our position.
Chart: KLCI's monthly chart as at July 18th (source: Tradesignum.com)
As at 10.30 am today, the KLCI is down 11.21 points to 1093.83. Most of the other Asian stock markets are however up by 2-3%.
Friday, July 18, 2008
IOI's bearish reversal sighted
IOI is one of the very rare gems on our exchange. An investor who put RM10,000 in this stock in January 1998, could have seen his or her investment rose to a value of RM390,000 exactly 10 years later. The stock has risen from a low of RM0.22 to a high of RM8.60 during that period.
Chart 1: IOI's monthly chart as at July 17th (source: Quickcharts)
A closer look at this stock may reveal that the share price may have put in a classic reversal pattern, known as the "Head-and-Shoulders".
This very reliable charting pattern (marked on the chart below as the 3 "^") is deemed completed when the share price broke below the "neckline". We can see the break below the "neckline" has happened yesterday at the RM6.20 level.
In addition, one can see that IOI has violated its accelerated uptrend line (the red line) at the RM7.00-10 level about 3 weeks ago. One can also see that a series of lower 'highs' (marked out as H1, H2 & H3) as well as lower 'lows' (marked out as L1, L2 & L3) which indicates that a short-term downtrend has in fact commenced.
The immediate horizontal supports are at RM5.70 & RM5.00 level. Long-term uptrend line support is at RM4.80-5.00. While some may view the RM4.80-5.00 as a possible entry level for a quick trade, one should be very careful in the present situation. The reversion to mean for a stock that broke a 10-year bull run could be so fierce that it would not respect niceties, like technical supports. This is especially so when we are dealing with a stock heavily-owned by foreign funds, who have shown their tolerance for taking losses.
Chart 2: IOI's weekly chart as at July 17th (source: Quickcharts)
Friday, July 11, 2008
Maybank may have broken above its downtrend line
Maybank share price has been sold down pretty badly over the past 6 months. From a high of RM10.56 in January, the share price has dropped to a recent low of RM6.85 (on July 4th). The sharp selldown was probably aggravated by its recent aggressive regional expansion program, where it spent a total of RM11.9 billion to acquire a 56%-stake in Bank Internasional Indonesia (at a cost of RM8.6 billion); a 15%-stake in An Binh Commercial Joint Stock Bank, Vietnam (at a cost of RM430 million); and a 20%-stake in a MCB Bank, Pakistan (at a cost of RM2.9 billion). The timing of this news couldn't be worse, as fund managers were reducing their positions in financial stocks globally, in reaction to the huge losses suffered by investment banks & financial intermediaries on Wall Street.
From the chart below, we can see that Maybank may have broken above its downtrend line at the RM7.10 level. This breakout is however not accompanied by increased volume.
Chart : Maybank's daily chart as at July 10th (source: Quickcharts)
The last 8-quarters' results are appended below. Maybank (closed at RM7.10 yesterday) is now trading at a trailing PE of 12 times (based on estimated EPS of 60 sen) or at a P/Book of 1.75 times (based on NTA per share of RM4.05 as at 31/3/2008). At these multiples, Maybank is deemed very attractive.
For more on Maybank, check out ECM's report recommending a BUY on this stock, as reported in the Edge Daily (go here) as well as a report in FinanceAsia.com, where Maybank makes a case for its aggressive regional expansion (go here).
Wednesday, July 09, 2008
Has Plantation peaked?
The slowly expanding correction in the commodity complex has now reached the agricultural commodities sector. From Chart 1 below, we can see that the index for an agricultural ETF, Market Vectors Agribusiness (MOO) has been sliding off, lately. MOO, which is traded on AMEX, was launched by Van Eck Global in September 2007. It tracks a global group of 40 company stocks that are in Agribusiness. MOO is now holding at its 200-day SMA support at the 55 level.
Chart 1: MOO's daily chart as at July 8th (source: Stockcharts.com)
From Chart 2 below, we can see that CPO has also corrected back to its uptrend line (the pink line). That uptrend line will provide support for this commodity at the RM3350-3400 level. With the Bollinger Bands expanding with a slight downward bias, the outlook for CPO is not positive. Currently, CPO futures for the month of September is trading at RM3456.
Chart 2: CPO's weekly chart as at July 8th (source: ifs.marketcenter.com)
Over the past few days, we have seen some plantation stocks dropping sharply to test their March low. Asiatic, Sime & United Plantation had broken their March low, while KLK & IOI Corp came very near to their March low this morning. The March lows & this morning lows for these stocks are:
1. Asiatic [March low: RM7.10; Today's low: RM6.60]
2. Sime [March low: RM8.50; Today's low: RM8.25]
3. United [March low: RM12.70; Today's low: RM12.20]
4. IOI [March low: RM6.40; Today's low: RM6.50]
5. KLK [March low: RM14.40; Today's low: RM14.60]
From Chart 3 below, we can see that the monthly MACD & William %R indicators are giving negative readings. The MACD has hooked down sometime ago and the William %R is poised to go below the 50 level as well as breaking its uptrend support line. While we do not know when the big correction will come, we do know that when it happens, it will be very unpleasant. It is best to reduce (or, avoid adding to) our position in this sector.
Chart 3: Plantation's monthly chart as at July 8th (source: Quickcharts)
Crude Oil prices tumbled
Yesterday, crude oil prices tumbled over USD5, their biggest daily decline in nearly four months, to close at $136.04 a barrel. In just two sessions, crude has lost USD9.25, or 6.4%. From Chart 1 below, we can see that WTIC index is poised to test its immediate uptrend line support at USD132-133 as well as its 50-day SMA at USD130. A break below USD130 level could send this index to its next uptrend line, which stretched back to January 2007 (see Chart 2). That uptrend line support is at USD104-106 and thereafter, the next obvious psychological support would be USD100.
Chart 1: WTIC's daily chart for 6 months to July 8th (source: Stockcharts.com)
Chart 2: WTIC's daily chart for 2 years to July 8th (source: Stockcharts.com)
One of the big casualties of the sharp run-up in crude oil prices is the airline stocks. From Chart 3 below, we can see XAL has been trending lower since August 2007. From an index reading of 50, it has dropped more than 70% to a low of 15 recently. A recovery in the airline stocks should happen if the crude oil prices entered into a correction phase. An initially tepid recovery may blossom into a strong recovery, if the crude oil prices began to violate any of the above-stated uptrend lines.
Chart 3: XAL's daily chart as at July 8th (source: Stockcharts.com)
Here, we have 2 airline stocks that had been beaten down badly. The first stock is Airasia. From Chart 4 below, we can see that this stock is trending lower in a downward channel. Some price recovery has begun over the past few days as the stock rebounded off the lower boundary of that channel. I expect Airsia to test the upper boundary at RM1.00-1.03 soon. A break above RM1.03 would signal the end of its downtrend. Those who are risk-averse should only enter this stock when the downtrend has been taken out.
Chart 4: Airasia's daily chart as at July 8th (source: Quickcharts)
The other airline stock is of course MAS. Like Airasia, it is in a downtrend. The short-term downtrend line resistance is at RM3.20-26. A break above that could see MAS testing its next dwntrend line resistance at RM3.70-80.
Chart 5: MAS's daily chart as at July 8th (source: Quickcharts)
Tuesday, July 08, 2008
Market may have hit a temporary bottom
The KLCI was trending lower since May 20th. This downtrend took a sharp turn for the worse in early July- coinciding with a political crisis locally. The market is now deeply oversold & a short-term rebound rally could take place. It is too early to say whether we have seen the worst, which I have serious doubt, but we could well have seen a temporary bottom. A decent rebound could send the KLCI to 1200 level. Along the way, it would encounter resistance at the recent gap-down level of 1145 as well as the previous March low of 1157.
Chart: KLCI's daily chart as at July 7th (source: Quickcharts)
Tuesday, July 01, 2008
Market Outlook as at July 1st
Last Friday, Dow Jones Industrial Index ("DJIA") broke its January & March "lows", while S&P 500 has been able to avoid a similar fate. The breaking of these "lows" by DJIA is reason enough for us to be extra cautious for the next few days.
Chart 1: DJIA & S&P500 daily chart up to June 30th (source: Stockcharts.com)
Chart 2: DJIA & S&P500 weekly chart up to June 30th (source: Stockcharts.com)
Our KLCI has yet to recover above the 1200 level. Further weakness could send the index to its March "low" of 1157. A break of this level could be very negative. We can see that the next supports thereafter would be the psychological 1100 level; the long-term uptrend line of 1030-50; and, finally, the psychological 1000 level. With the monthly MACD & William %R giving decidedly negative reading, the outlook for the KLCI is not good.
Chart 3: KLCI's monthly chart as at June 30th (source: Quickcharts)
Based on the bearish outlook, it is best to stay by the sideline for now.