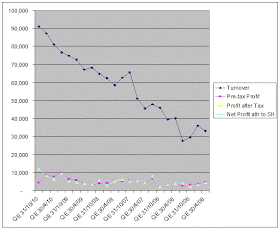
Adventa has just announced its results for QE31/10/2010. Its net profit increased by 44% q-o-q or 119% y-o-y to RM11.8 million, while turnover increased by 4% q-o-q or 22% y-o-y to RM91 million. The increased in the net profit is due solely to lower effective tax rate due to availability of reinvestment allowances from capital expenditure incurred by certain subsidiaries and profits exempted under pioneer status for a period of 10 years and other fiscal incentives from the government. This led to a transfer from deferred tax of RM7.7 million for QE31/10/2010.
Adventa's pre-tax profit level continued to slide- dropping 50% q-o-q or 31% y-o-y to RM4.2 million. The company attributed the decline to "the high raw material cost and weak US dollar. The fast hike in rubber prices induced a large time-lag related delay in revenue increase even though cost are eventually passed into selling price. This dragged down the quarter’s earnings. A new factory was completed in this period, adding capacity to the tight high utilization rate in some products."

Table: Adventa's last 8 quarterly results

Chart 1: Adventa's 23 quarterly results
Valuation
Without the deferred tax effect, Adventa's EPS for QE31/10/2010 would be about 2.75 sen (or full-year EPS of 11 sen). In the current environment, it is likely that this EPS number may go down. Assuming that this number can be maintained, Adventa (at RM2.49 now) is trading at a current PE of 23 times. That makes Adventa fairly expensive.
Technical Outlook
Adventa is enjoying a very strong rally this morning. As at 11.40am, Adventa was trading at RM2.49- a gain of 57 sen or 30% from yesterday's close! This means that Adventa has broken above its downtrend line resistance at RM2.40 (see Chart 2 below). The strong rally is very strange as the above results shows that the operating performance has actually deteriorated.

Chart 2: Adventa's daily chart as at Dec 22, 2010 (Source: Tradesignum)
From Chart 3 (plotted on log scale), we can see that Adventa had broken below the longer term uptrend line at RM2.20. It may be a moot point now to note that the stock has also broken below the psychological RM2.00 level.

Chart 3: Adventa's weekly chart as at Dec 20, 2010 (Source: Tradesignum)
Conclusion
The strong rally today causes a crash between the fundamental view- which is still negative- & the technical view- which has turned positive. Which view should we follow? I am inclined to take the fundamental view for now and recommend a "sell into strength" for those holding the stock or an "avoid" for those hoping to get in.
I think it's a technical breakout. The volume is 25x the average normal days volume of 2000lots.
ReplyDeleteHi Alex,
ReplyDeleteCan you give me your guidance for Naim nearterm outlook?
hi, alex,need some advice from u i had bought kianjoo, as i think fundamentally is good what do u think about it?
ReplyDeletehi also another question, what u think about fajar?
ReplyDeleteHi Alex,
ReplyDeleteCan you take a look at Uchitec? Latest quarter results have been shwoing good improvement, although its PE is rather high at around 9. Stock price seems to be consolidating in a triangle? Thanks!
Hi AlexP
ReplyDeleteUchitec is consolidating within a symmetrical triangle, with resistance & support at RM1.40 & RM1.28 respectively.
Uchitec has FD & bank balances totaling RM139 million as at 30/9/2010 or 37 sen per share. If this is deducted from its current market price of RM1.31, it would be trading at a PE of 7 times (based on last 4 quarters' EPS of 13.6 sen).
As such, Uchitec is an attractive stock. Its dividend yield is about 6.1%.
Hi cheeseong
ReplyDeleteI am not familiar with Naim. I will give you the technical outlook only.
The near term outlook is bearish. I think there is a good chance it may test its 200-day SMA line at RM3.30-3.31. A failure to stay above that level would lead to a quick selldown to the psychological RM3.00. From here, we may see a technical rebound. That rebound may send the stock to the recent high of RM3.50-3.60.
Hi sangkancil
ReplyDeleteMy take on the following stocks:
1) Kianjoo is testing its medium-term uptrend line at RM1.65. If this support failed, it may then test its horizontal support at RM1.60 & RM1.50. Based on the results for 9-month ended 30/9/2010, Kianjoo is now trading at a PE of 6.9 times. This a good stock for long-term investment and a possible trading BUY at RM1.65.
2) Fajar's technical outlook is mildly bullish. Its immediate horizontal resistance is at RM1.30. If it can break above that level, it may test the next resistance at RM1.50-1.60. Based on the 1Q2011 ended 30/9/2010, Fajar is trading at a PE of 11.6 times. At this PE, Fajar's upside is deemed limited. As such, Fajar is rated a trading BUY with target at RM1.50-1.60.
spot on Adventa!
ReplyDeleteForesee the share price to fall below RM2 again.
Hi value investing in malaysia
ReplyDeleteAdventa apparently rallied on rumor of a buyout by a US company. Since that rumor was quashed by Adventa's management, the share price had corrected downward. However you must note that the downward correction was not a complete smack-down. On the contrary, Adventa is holding onto its downtrend line breakout level of RM2.40. What's up? I don't know. Could there be more to the buyout story than what we have been told?