This is a personal weblog, reflecting my personal views and not the views of anyone or any organization, which I may be affiliated to. All information provided here, including recommendations (if any), should be treated for informational purposes only. The author should not be held liable for any informational errors, incompleteness, or delays, or for any actions taken in reliance on information contained herein.
Friday, July 29, 2011
Armada- an option writer's dream?
Table: Armada's CWs main terms & valuation
Daiboci- reported higher top-line & bottom-line
Like DXN, Daiboci also had a bullish breakout recently, which I had posted on (here). Yesterday, it announced its results for QE30/6/2011. Its net profit increased by 7% q-o-q or 19% y-o-y to RM5 million while its turnover also increased by 8% q-o-q or 20% y-o-y to RM73 million. From the chart below, we can that Daiboci's top-line is rising but its bottom-line remained stagnant.
Table: Daiboci's last 7 quarterly results
Chart: Daiboci's last 15 quarterly results
Comment & Conclusion
Based on current PE of 11.5 times and the bullish technical outlook (as noted recently), I would rate Daiboci a HOLD.
DXN- top-line & bottom-line inched up
Recently, I have posted on DXN's technical breakout & the test of its recent high (here). We do not know the true reason why a stock put in a breakout. Since the breakout happened prior to the results, we should study it and determine whether the results announcement triggered the breakout.
Results Update
DXN announced its results for QE31/5/2011 at the close of business on July 25. Its net profit increased by 34% q-o-q but declined by 10% y-o-y to RM9 million while its turnover was hardly changed at RM68 million. Looking at the results, I doubt the breakout was prompted by improved financial performance.
Table: DXN's last 8 quarterly results
Chart: DXN's last 17 quarterly results
Comment & Conclusion
Based on its fair valuation (with PE of 7.8 times) and technical breakout still intact, I would rate DXN a HOLD. Good entry for a trade is at RM1.30.
SEG- maintained its financial performance
SEG has just announced its results for QE30/6/2011. Its net profit jumped 68% y-o-y to RM18 million on the back of a 32%-increase in turnover to RM69 million. Bottom-line & top-line were unchanged when compared to the immediate preceding quarter (QE31/3/2011).
Table 1: SEG's last 7 quarterly results
Chart 1: SEG's last 13 quarterly results
Last 10 years' performance
SEG's financial performance for the past 5 years has been very impressive. If you plot this performance (plus the annualized results for FY2011), we can see that SEG's exponential growth for the past 5-6 years.
Chart 2: SEG's last 10 year results (plus the annualized results for FY2011)
Valuation
SEG's latest financial results is up to 30/6/2011. It has however undergone a share split of 1-to-2 in early July. So we have to careful making a comparison for the purpose of determining its PE. Based on the enlarged shares outstanding, SEG's annualized EPS for FY2011 is 13.3 sen. Based on its closing price of RM1.93, SEG is now trading at a PE of 14.5 times. This PE multiple is deemed acceptble given the strong growth in the bottom-line for the past 6 quarters.
Technical Outlook
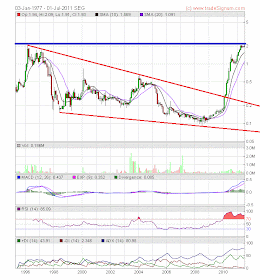
SEG's share price performance has been as spectacular as its financial results. However, it is now testing its all-time high at RM2.00. Can the stock surpass this level? Only time will tell.
Chart 3: SEG's monthly chart as at July 1, 2011_plotted on log scale (Source: Tradesignum)
Conclusion
Based on good financial performance & reasonable valuation, SEG could be a good stock for long-term investment. However, its upside may be capped at RM2.00 for the near-term unless it can break above this psychological level which is its all-time high price.
Spritzr- rising top-line but sinking bottom-line
Spritzr has just announced its results for QE31/5/2011, where its net profit dropped 88% q-o-q or 92% y-o-y to RM257k while turnover increased by 26% q-o-q or 12% y-o-y to RM43 million. The company attributed its poorer performance to higher sales of the lower-margin drinking water products thus affected the overall profit margin. Higher raw material costs and operating expenses together with the higher finance cost also contributed to the lower profit recorded. I think it is also possible that the company made short-term sacrifice to increase its market share in order to improve its utilization of its new Shah Alam plant.
Table: Spritzr's last 8 quarterly results
Chart 1: Spritzr's last 20 quarterly results
Valuation
Spritzr (closed at RM0.89 yesterday) is now trading at a PE of 14.4 times (based on last 4 quarters' EPs of 6.2 sen). At this PE, Spritzr is deemed full value. However, once it has consolidated its position & raise its selling prices, Spritzr's earning should improve.
Technical Outlook
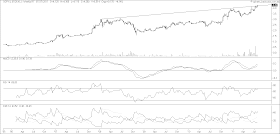
Based on the chart below, we can see that Spritzr is still in an uptrend line, with support at RM0.85.
Chart 2: Spritzr's weekly chart as at July 25, 2011_plotted on log scale (Source: Tradesignum)
Conclusion
Despite the poorer results, I believe Spritzr is still a god stock for long-term investment.
Wednesday, July 27, 2011
SOP- breaking to the upside (on more than one level)
SOP is involved in oil palm cultivation. Based on its results for QE31/3/2011 (here), SOP is now trading at a PE of 8.3 times (based current price of RM4.24 & annualized EPS of 51.36 sen).
Based on the above technical breakout (not the beauty of the charts), I believe SOP could be a good trading BUY.
Chart 1: SOP's daily chart as at July 27, 2011_4.30pm (Source: Quickcharts)
Chart 2: SOP's weekly chart as at July 27, 2011_4.30pm (Source: Quickcharts)
Chart 3: SOP's monthly chart as at July 1, 2011_plotted on log scale (Source: Quickcharts)
"Onions have layers. Ogres have layers. Onions have layers. You get it? We both have layers."
MRCB- poised for the next upleg?
MRCB is expected to tie-up with its main shareholder, EPF to develop the 3300-acre land located in Sungai Buloh which belongs to Malaysia Rubber Board. Negotiation for the sale of the land is still on-going & it is expected to be finalized by this year-end (here & here).
Chart: MRCB's daily chart as at July 27, 2011_2.50pm (Source: Quickcharts)
USD- dropping on fear of a default on US national debts
Chart: USD index's daily chart as at July 26, 2011 (Source: Stockcharts)
Due to the breakdown in USD over the past few days, the earlier comment about a possible unwinding of USD carry trades would not be applicable.
Perstima- bottom-line rebounded
Perstima has just announced its results for QE30/6/2011. Its net profit rose 127% q-o-q to RM14.7 million while turnover inched up 2.4% to RM214 million. However, its net profit dropped 39% y-o-y despite a 5.8%-increase in turnover. The improved bottom-line when compared to the immediate preceding quarter was due to better profit margin & lower forex losses. However, the company is still suffering from stiff competition from Chinese producers who undercut prices of their products.
Table: Perstima's last 8 quarterly results
Chart 1: Perstima's last 28 quarterly results
Valuation
Perstima (closed at RM3.91 yesterday) is now trading at a PE of 6.6 times (based on annualized EPS of 59 sen). Based on this PE, Perstima looks attractive. However, we should wait for another quarterly results to ascertain whether Perstima has successfully weathered the price competition which caused a sharp drop in its bottom-line in QE31/3/2011. If that problem is a thing of the past, Perstima should be a good stock for long-term investment.
Technical Outlook
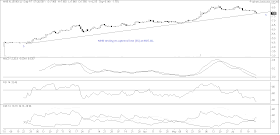
As noted previously, Perstima broke its uptrend line at RM4.40 in early June. It found support at the horizontal line at RM3.75-3.80. It recovered above the psychological RM4.00 level but its rise was capped by the horizontal line at RM3.10.
Chart 2: Perstima's weekly chart as at July 27, 2011_10.30am (Source: Quickcharts)
Conclusion
Based on improved financial performance & attractive valuation, Perstima could be a good stock for long-term investment. However, we can afford to adopt a wait-&-see attitude as the technical outlook is still weak.
Kulim- may have a bullish breakout
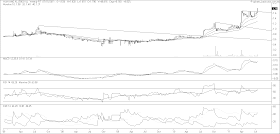
From the chart below, we can see Kulim broke above the medium-term downtrend line at RM3.60. Its immediate resistance are the horizontal line at RM3.73 & then at RM4.00.
Chart 1: Kulim's daily chart as at July 27, 2011_9.30am (Source: Quickcharts)
Those who are more aggressive may consider Kulim-WC, a newly-listed warrant with an exercise price of RM3.85 & expring only in February 2016. This warrant is however trading at a hefty premium of 33% (based on current price of RM1.07 & share price of RM3.70).
Chart 2: Kulim-WC's daily chart as at July 27, 2011_9.30am (Source: Quickcharts)
Needless to say that you should exercise your careful discretion in carrying out any trading given the uncertainty in the market presently.
Tuesday, July 26, 2011
Axiata may continue with its prior uptrend
Chart: Axiata's weekly chart as at July 26, 2011_4.30pm (Source: Quickcharts)
MHB- poised to test its uptrend line support
Chart: MHB's daily chart as at July 26, 2011_10.30am (Source: Quickcharts)
Note: One of the possible reason for the drop in the share price today as well as over the past 2 weeks is that MHB failed to secure the contract to build the integrated petro-chemical complex in Teluk Ramunia, which went to a consortium made up of KNM, Zecon & Gulf Asian Petroleum Sdn Bhd (here). That contract is estimated to be about RM15 billion. Nevertheless, there are more contracts to be dished out & MHB, with its strong track record, should be able to get its fair share of the contracts.
Daiboci- has broken above its downtrend line
Chart: Daiboci's weekly chart as at July 26, 2011_10.00am (Source: Quickcharts)
Ivory has broken above its downtrend line
Ivory Properties Group Berhad ('Ivory') will develop the Bayan Mutiara mixed development project tendered out by the Penang Development Corp (PDC).
Ivory has just received the letter of acceptance by PDC of its proposal for purchase and development of 102.56 acres of land located in Bayan Mutiara of which 67.56acres are existing land and 35 acres are to be reclaimed for a proposed mixed development.
Ivory outbid SPSetia for the Bayan Mutiara mixed-development project which was carried out by tender with the reserved price set at about RM200 per sq ft.
Technical OutlookThe above news could be the catalyst for the recent rally in Ivory, which sent the share price above its downtrend line at RM1.08 in early July. Its immediate support & resisatnce is at RM1.10 & RM1.20, respectively.
Chart: Ivory's daily chart as at July 25, 2011 (Source: Quickcharts)
Conclusion
Based on this technical breakout, Ivory could be a good trading BUY. Since the news is out, the trading can be a bit tricky. If there is not follow through rally above RM1.20, you may see a correction back to the support of RM1.10 or even to the downtrend line (now a support) at about RM1.05. If you are patient, you may want to wait for pullback to RM1.05-1.10 before committing.
Monday, July 25, 2011
DXN- testing its recent high!
In this uncertain time, one has very little incentive to trade. However, there are some stocks that keep flashing a BUY call that's hard to resist. One such stock is DXN, which broke above the medium-term downtrend line at RM1.30 last Tuesday. After a short correction on Wednesday & Thursday, DXN continued its upleg on Friday. It nearly tested its horizontal resistance at RM1.50 today, when it made a high of RM1.49. The indicators have turned positive, in line with the upside breakout. If DXN can break above the RM1.50 level- the recent high- this stock may rally.
Chart 1: DXN's daily chart as at July 25, 2011_3.30pm (Source: Quickcharts)
Recent Financial results
I have attached the recent financial results of DXN for your perusal. All I can say is that the results is not spectacular.
Table: DXN's last 8 quarterly results
Chart 2: DXN's last 16 quarterly results
Valuation
Based on the last 4 quarters' EPS of 18 sen & current price of RM1.46, the stock is trading at a PE of 8 times. I think that is a fair value for a medium-size stock.
Conclusion
DXN could be a very interesting stock if it can break above the recent high of RM1.50. If that happened, it could be a trading BUY. However, given the state of the market, you should exercise careful discretion when entering into any trade.
Friday, July 22, 2011
Hiaptek- failure to launch!
Cypark- breaking above its downtrend line!
From the chart below, we can see that Cypark found support at the horizontal line at RM1.70 & staged its impressive rebound. This counter-trend rally has surpassed the strong horizontal line at RM2.00 & it is now breaking above the downtrend line at RM2.25. If Cypark can stay above the downtrend line, the worse is over this stock. The earlier SELL call should be terminated.
Chart: Cypark's daily chart July 22, 2011_9.45am (Source: Quickcharts)
Hiaptek- on the verge of breaking above its downtrend line
"The contract value for the engineering and procurement contract is RM417.83mil, while the construction contract is RM232mil. This integrated steel mill will have an annual capacity of 0.7mil tonnes of steel while the completed integrated steel mill will have a total annual capacity of 3.5mil tonnes of steel. This project plant is expected to be completed by 2013".
It is also reported that Hiap Teck & China Shougang has entered into a supplemental agreement "whereby Hiap Teck will issue to China Shougang or its nominated affiliates 32.2 milllion Hiap Teck shares as placement shares, at an issue price to be agreed upon".
From the chart below, we can see that Hiap Teck is in a downtrend line, with resistance at RM1.15. This coincides with the horizontal line at RM1.15. If the stock can break above this resistance, the technical outlook could turn bullish. Its next resistance levels are at RM1.30 and then at RM1.50. As such, Hiap Teck is on the verge of a bullish breakout.
Chart: Hiaptek's weekly chart as at July 21, 2011 (Source: Quickcharts)Thursday, July 21, 2011
YTLPower- developed a leak
Chart 1: YTLPower's weekly chart as at July 21, 2011_12.30pm (Source: Quickcharts)
Chart 2: YTLPower's monthly chart as at July 1, 2011_plotted on log scale (Source: Tradesignum)
YTLPower, like the other IPPs, could be under selling pressure due to heavy political pressure to re-examine the PPAs signed by IPPs & Tenaga in 1990's. It is reported that YTLPower enjoys very favorable terms under the PPA & a restructuring of this PPA will have severe impact on YTLPower's bottom-line.
Notwithstanding the foregoing, I believe that YTLPower is likely to stay above its long-term uptrend line and as such, it could present a good buying opportunity for those with a long-term view.
UOADev- finding a bottom?
Chart: UOADev's 60-min chart as at July 21, 2011_11.15am (Source: Quickcharts)
MISC- a strong counter-trend rally meets a strong resistance
Based on the chart below, we can see that MISC is now knocking against the downside of the symmetrical triangle (at RM8.00) which it had violated in May. As always, a support which had been violated would automatically turned into a resistance. A strong support would in turn become a strong resistance. As such, I expect MISC would have a challenging time breaking above the RM8.00 resistance. If our earlier SELL call on MISC is correct, then this is a good time to exit MISC, if you are holding the stock.
Chart: MISC's weekly chart as at July 18, 2011_plotted on log scale (Source: Tradesignum)
Wednesday, July 20, 2011
Market Outlook as at July 20, 2011
1) the 10-week SMA line crossed below the 20-week SMA line; and
2) the index subsequently went below the 40-week SMA line.
You will notice that these two events happened earlier for the weakest index (FBMFLG) as compared to the strongest index (FBM-KLCI). In addition, you would notice that all indices would struggle to hang on to the 40-week SMA line after the 10-week SMA line had crossed below the 20-week SMA line.
If we look at all three indices today, we would see that the 10-week SMA line had crossed below the 20-week SMA line for both FBMFLG & FBMSCap, while the 10-week SMA line is still above the 20-week SMA line for FBM-KLCI. Now, both FBMFLG & FBMSCap are struggling to stay above their respective 40-week SMA line. Finally, you would notice that the indicators are all pointing downward. MACD is very near to the zero line. As for the ADX indicator, the -DMI is hooking up while +DMI is dropping fast.
All in all, the technical outlook for the market is poor. While we do not have a confirmed SELL signal, we should take precautionary steps to adjust your exposure to the equity market.
Chart: FBMFLG, FBMSCap & FBM-KLCI's weekly charts as at July 20, 2011_11.30am (Source: Quickcharts)
ENG- a possible trading BUY
OSK has immediately revised the fair value from RM1.73 to RM2.30 (here). From the chart below, we can see that ENG has just broken above its trading range of RM1.95. Its next resistance is at the horizontal line at RM2.15 & thereafter at RM2.40. Based on the technical breakout, ENG could be a trading BUY. The good entry is around RM2.00-2.05.
Chart: ENG's weekly chart as at July 20, 2011_10.00am (Source: Quickcharts)
Given the present uncertain market outlook & heightened risks from oversea development, you are advised to exercise careful discretion in every trading situation.
Tuesday, July 19, 2011
Mahsing- dropping despite a very successful launch
Chart 1: Mahsing's daily chart as at July 19, 2011_12.30pm (Source: Quickcharts)
From the weekly chart below, we can see that Mahsing's support levels are at the intermediate uptrend line (s1-s1) at RM2.15, the horizontal support at RM1.95-2.00 & the long-term uptrend line (SS) at RM1.50.
Chart 2: Mahsing's weekly chart as at July 19, 2011_12.30pm (Source: Quickcharts)
Despite the very bearish market sentiment presently, I believe the fall in Mahsing share price is overdone. As such, the stock may enjoy a technical rebound shortly. Mahsing could trade between RM2.15 & RM2.50 for the next few weeks before we can determine the next price direction.
Gamuda is breaking its long-term uptrend line
Chart: Gamuda's weekly chart as at July 19, 2011_12.10pm (Source: Quickcharts)
Monday, July 18, 2011
Market Outlook as at July 18, 2011
Chart 1: FBM-KLCI's daily chart as at July 18, 2011_11.30am (Source: Quickcharts)
From the weekly chart, we can see that our market could be tracing out a market top similar to the last quarter of 2007 & first quarter 2008. I think the crucial level is the long-term uptrend line support at 1550 (which coincides with the 20-week SMA line). If this line is violated, there is a high chance our market could reverse into either a sideway market or a bear market.
Chart 2: FBM-KLCI's weekly chart as at July 18, 2011_11.30am (Source: Quickcharts)
With our market trading at a tipping point, we should exercise careful discretion & avoid trying to trade large position despite what looks like very attractive prices.
Friday, July 15, 2011
MFlour & TWS- time for profit-taking
I will readily admit that we have not gotten the sell signal yet but the indicators are weakening fast. This could easily lead to a sell signal in a few days time. By then, the prices could be much lower and you would probably hang on to the stock and wait for a technical rebound. Do yourself a favor- sell some early- so that you can concentrate better if the market were to weaken. If not, you would have taken some profit which is not a bad thing in this uncertain time.
The charts below will tell the story.
Chart 1: MFlour's daily chart as at July 15, 2011_4.30pm (Source: Quickcharts)
Chart 2: TWS's daily chart as at July 15, 2011_4.30pm (Source: Quickcharts)
Dialog- time to take some profit
Based strictly on the above technical reading, I believe it is advisable to take some profit on Dialog.
Chart: Dialog's weekly chart as at July 15, 2011_4.00pm (Source: Quickcharts)
SPSetia may have a bearish breakdown
With this double breakdown, SPSetia's uptrend is likely to be over and the stock is likely to trade sideway with a downward bias between RM3.50 & RM4.00 for the next few weeks or months.
Based strictly on technical analysis, you may want to reduce your position in this stock if there is no recovery above the RM4.00 level over the next 2-3 days.
Chart: SPSetia's weekly chart as at July 15, 2011_3.30pm (Source: Quickcharts)
Huayang- another bonus issue!
Hua Yang Bhd ('Huayang') is a medium-size property developer with four main projects:
1) Symphony Heights, a 3 blocks serviced apartment consists of 946 units, offers 2, 3 and 3+1 bedroom apartments with a built-up area from 863 sq ft to 1,246 sq ft. Symphony Heights is located off the MRR2, at Selayang.2) One South, the latest mixed development in Seri Kembangan, Selangor, comprising shop offices, service apartments and office towers, are set to tap on its strategic location. It is situated just along the KL-Seremban highway and right next to Besraya highway where it enjoys a ready population catchment as well as high traffic visibility.
3) Pulai Indah, a township development of 477 acres, in Johore.
4) Bandar Universiti Seri Iskandar, a 838-acre township development in Perak.
For more, go here.
Outstanding Corporate Proposal
Huayang has proposed a bonus issue of 1-for-3. Last year, Huayang had a bonus issue of 1-for-5 which was completed in September.
Recent Financial Results
Why did the sale drop q-o-q? Is it due to slowing sales or delay in construction work? We need to keep a close look-out on this item in the next quarterly result.
Table: Huayang's last 8 quarters' result
Chart 1: Huayang's last 16 quarters' result
Financial Position
Huayang's financial position as at 30/6/2011 is deemed satisfactory. Current ratio stood at 2.3 times while debts to equity stood at 0.3 time.
Valuation
Huayang (closed at RM1.76 yesterday) is now trading at a PE of 6.1 times (based on estimated EPS of 29 sen, which was in turn arrived at using the average net profit of RM8 million for QE31/3/2011 & QE31/12/2010). For a medium-size developer, I think Huayang is trading at its fair value. Thus, upside potential may be limited unless investors are prepared to raise the PE multiple.
(Note: I believe that a developer with sizable land bank which was built-up earlier at lower cost, would be able to sustain its current level of profit. Huayang may fall into this category. I think the market should accord Huayang a better PE multiple than 6 times. On the other hand, if the developer used up its cheaper land bank & it has to replenish it at current higher price, it won't be able to maintain its profit margin as seen in 2010-2011. This category of developers should trade at lower PE multiple.)
Technical Outlook
Huayang rose rapidly after breaking above its long-term downtrend line at RM0.75 in July 2010. It rose upward after breaking above its immediate medium-term downtrend line. Recently, it broke above a similar downtrend line at RM1.70. This could lead to another rally which could potentially hit the RM2.00 level. The impetus for this possible rally could be the issuance of the bonus shares in the next few weeks.
Chart 2: Huayang's weekly chart as at July 15, 2011_11.00am (Source: Quickcharts)
Conclusion
Based on good financial performance & position, Huayang could be a good stock for long-term investment. However, Huayang's upside potential is deemed limited as the stock is trading at its fair value [based on market PE of 6 times]. The outstanding bonus issue & technical breakout could be good reasons for getting into this stock.