Wednesday, January 31, 2007

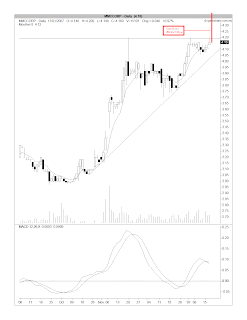
GPacket has returned to its recent high

In mid-November last year, Green Packet (GPacket) share price broke below its immediate uptrend line at RM4.50. The share price then slid to a low of RM3.92 in late December, before recovering. Today, GPacket has gained about 30 sen to revisit its November 2006 high of RM4.90. A convincing break above the previous high of RM4.90 could mean that GPacket might continue with its prior uptrend. See Chart 1 & 2 below.


Chart 1: GPacket's daily chart as at Jan 30


Chart 2: GPacket's weekly chart as at Jan 30

On the other hand, if GPacket failed in its attempt to surpass the RM4.90 level, it might drop back to test its current uptrend line (current support at RM4.30). If this uptrend line failed to hold up the share price, GPacket might proceed to test its long-term uptrend line (current support at RM3.85/90). This scenario (see Chart 3 below) might play out if investors cannot find a reason to chase the share price higher than where it was in November last year. The catalyst for a bullish play may be there. It could be the successful bid for one of the 2 WIMAX license (but this is not likely to be anytime soon) or maybe, a substantially better result from its operation (who knows). If you feel that the price is too high for your liking, this may be your opportunity to reduce your position on this stock.


Chart: GPacket's not-so-bullish scenario

UMW has surpassed its all-time high of RM8.70

I've posted in mid-November last year that UMW's uptrend might accelerate (here). Accelerate it did. UMW has just surpassed its all-time of RM8.70 recorded in February & April 1997. At 11.17 a.m. this morning, UMW was trading at RM8.90 (after gaining 55 sen). Let's see whether UMW can hold above the breakout level of RM8.70 over the next few days. If so, the stock might continue to go higher from hereon.


Chart: UMW's monthly chart as at Jan 30

Tuesday, January 30, 2007

TM has just broken above its resistance of RM10.10.

TM has just broken above its strong horizontal resistance at RM10.10 (see Chart 1). This follows closely after the earlier breakout of the 3 TM-CWs i.e. TM-CA, TM-CB & TM-CC (see Chart 2, 3 & 4). From the valuation table below, I would prefer TM-CA to TM-CB or TM-CC because it is cheaper & has a longer tenor to expiry.


Chart 1: TM's daily chart as at Jan 29


Chart 2: TM-CA's daily chart as at Jan 29


Chart 3: TM-CB's daily chart as at Jan 29


Chart 4: TM-CC's daily chart as at Jan 29


Table: The 3 TM-CWs Valuation Compared

Monday, January 29, 2007

New Call Warrants issued

Tomorrow, 4 new CWs are expected to begin trading on the exchange. They are Bursa-CB, Genting-CB, Maxis-CB & Tenaga-CD. I've tabulated below how these new CWs compare to the existing CWs of the same underlying shares.


How do they rank?

  • Bursa-CB has a longer tenor; offers higher gearing; and, at a lower premium than the existing Bursa-CA.
  • Genting-CB has a longer tenor and offers higher gearing but at a higher premium than the existing Genting-CA.
  • Maxis-CC offers higher gearing at a lower premium than the existing Maxis-CA & Maxis-CB. In term of tenor, it has a longer maturity period than Maxis-CB but shorter than Maxis-CA.
  • Tenaga-CD offers higher gearing at with relatively lower premium but at relatively shorter tenor than the existing 3 CWs of Tenaga.
Based on the foregoing, I expect some weakness for Bursa-CA while the other existing CWs would be unaffected. Since all 4 new CWs were issued at undemanding premium, I expect some capital appreciation or gain, especially for Bursa-CB and possibly Maxis-CC.

Airasia is at its uptrend line again

Airasia has come down to its short-term uptrend line support at RM1.45 again. It may rebound from here to the strong horizontal resistance of RM1.65.


Chart: Airasia's daily chart as at Jan 26

UOA REIT has just broken above its downtrend line

Background

UOA REIT was listed in December 2005. It has 3 properties under its portfolio i.e. Wisma UOA Central Parcels, Wisma UOA II Parcels and Wisma UOA Damansara Parcels. Based on a company's Interim Report for June 2006, the occupancy rate of these 3 buildings ranges from 90.0% to 99.4%.

Recent Financial Results

UOA REIT has recently announced its results for QE31/12/2006. A quick look at the results show that the topline & bottomline have been rising steadily. Based on these 4 quarterly results, we can see that UOA recorded a net profit of RM20.25 mil on a turnover of RM31.38 mil for FY2006. UOA REIT pays a dividend of 8.5% per annum, representing about 98% of its EPS of 8.67 sen.


Valuation

Based on its closing price of RM1.13 at the close of the morning, UOA REIT is now trading at a price to book of 1.07 times. Its yield is about 7.5%.

Technical Ootlook

From the chart below, we can see that UOA REIT has been in a downtrend since its listing. If it can close above RM1.12, UOA REIT would have broken above the downtrend line. Undoubtedly, the last few days price run-up was due to the results announcement & the upcoming dividend. However, the breakout of the downtrend line could be signaling a change of trend for this REIT.


Chart: UOA REIT's weekly chart as at Jan 26

Conclusion

Based on good yield & improving results, UOA REIT is an attractive REIT to invest for the long-term. The potential breakout of its downtrend line could also signal the potential of this REIT to give investors a capital gain for the medium-term.

Sunday, January 28, 2007

Call Warrant updates as at January 26, 2007

The call warrants' prices increased by a whopping 17.72% since last Friday (January 19) as compared to a 2.76%-increase in the underlying share prices. The average premium has increased from 9.23% to 10.53% (see Table 1 below).


Table 1: Changes in Call warrants' prices, underlying share prices & premium from Jan 19 to Jan 26

From Table 2 below, you can see that the number of call warrants has dropped from 35 to 33, with the suspension of the first 2 expiring call warrants (i.e. Astro-CA & Scomi-CA). The cheap call warrants (those trading at a discount or at a premium not exceeding 6%) are highlighted in yellow while 4 call warrants which are due to expire from February to April 2007 (i.e. BJToto-CA, Bursa-CA, IOI-CA & TM-CB), have their expiry dates highlighted in orange.


Table 2: Call warrants' intrinsic value & premium as at Jan 26

In the previous market peak on December 12 last year, the call warrant's premium was more than 13% (here). Since there is another source where one can obtain the call warrant pricing i.e. from OSK188.com, I would like to find a good reason to continue posting my Call Warrants Updates. I wonder whether the call warrant's premium could forewarn us about the excessive bullishness in the market and its impending capitulation. We will wait & see.

Friday, January 26, 2007

CI is testing its supports at 1168-1170

Due to sharp fall in DJIA overnight, our CI has also come under selling pressure. I see the CI finding supports at its immediate short-term uptrend line at 1170 as well as the support from the gap created on Jan 24 (at 1168). Failing which, the CI may test the psychological 1150 & the next immediate short-term uptrend line support of 1145.


Chart: CI' daily chart as at Jan 25

BJToto should be good for a quick trade

BJToto has found itself in an unfamiliar territory, lately. The top dog amongst the Number Forecasting Operators (NFO), BJToto has always been regarded as the better investment stock when compared to Magnum. While not in the same league as Tanjong, BJToto was preferred because of its superior dividend yield.

In the past 2 months, BJToto has been drifting down after making a high of RM4.98 on November 30, 2006. It is presently resting on its medium-term uptrend line, with the support at RM4.60/62. The past 3 days saw the stock trying to participate in the current market rally and, in the process, it has broken above the short-term downtrend line, with resistance at RM4.68. While the hesitant move has not been convincing, I believe the stock will have a successful take-off very soon after it has shaken off a few more stale bulls.

Based on the above, I would recommend that you accumulate this stock at the present price. My target for the upward move is RM5.00/25. On the other hand, if in the unlikely event that the stock were to break below RM4.60, you may like to have a protective stop at RM4.50 as more selling may ensue.


Chart: BJToto's daily chart as at Jan 25

Tuesday, January 23, 2007

Ancom & its sub, Nylex have reported good results

Background

Ancom & its subsidiary, Nylex are both listed on Bursa Malaysia. Yesterday, they have both reported very good results for the QE 30/11/2006. The substantially better performance is attributable to the incorporation of the results of a recently acquired subsidiary, CKG Chemicals Pte Ltd ("CKG") which has led to a 80% increase in its turnover & 20% increase in its net profit. Nylex has completed its acquisition of CKG in September 2006 at a cost of S$40 million.

Recent Financial Results

Nylex's net profit has increased by 295% q-o-q or 455% y-o-y to RM20.6 mil. This was achieved on the back of a turnover of RM429 mil, which has increased by 124% q-o-q or 157% y-o-y. The much-better net profit is due to two reasons; firstly, an amount of RM5.66 mil being dividend income from the Group’s investment in an unquoted company, and, secondly, profit contribution from CKG of about RM5.0 mil.


Nylex's last 8 quarters' results

Ancom has similarly enjoyed a jump in its bottomline & topline. When compared to the preceding quarter, Ancom's net profit has increased by 14-fold to RM16.4 mil while its turnover has gained 69% to RM573 mil. The improvement is even more favorable when compared to the previous corresponding quarter when it incurred a net loss of RM1.1 mil on the back of a turnover of RM296 mil. The improvement is attributable to improvement in Nylex.


Ancom's last 8 quarters' results

Valuation

For Nylex, I shall assume that the dividend income of RM5.66 mil for the current quarter is a one-off event. If we exclude this item and annualize Nylex's current quarter's net profit, we can expect Nylex to make a net profit of about RM60 mil for a full year. Divided by a share capital of 194.338 million share, its EPS is about 30.1 sen.

For Ancom, I shall just annualize its current quarter's net profit to arrive at a full-year profit of about RM64 mil. Divided by its share capital of 201.857 million shares, its EPS is about 31.7 sen.

Based on the closing price at the end of the morning session, Ancom (closed at RM0.805) is now trading at a PE of 2.7 times while Nylex (closed at RM1.80) is trading at a PE of 6.0 times. As such, Ancom looks very cheap while Nylex's valuation is not demanding.

Technical Outlook

As expected, Nylex's share price has already begun to factor in the improvement in its financial performance. This cannot be said about Ancom's share performance. Ancom's share price is range-bound between RM0.62 & RM0.80. A convincing breakout above RM0.80 could signal the beginning of the rise in Ancom share price. This morning, Ancom's share price went to a high of RM0.84 before closing at RM0.805. If it stay above the RM0.80 level, Ancom would have broken out of its trading range & can go higher.


Chart 1: Ancom's weekly chart as at Jan 23


Chart
2: Nylex's weekly chart as at Jan 23

Conclusion

Based on fairly attractive valuation, both Ancom & Nylex are good buys. With the possible breakout as witnessed this morning, Ancom could be moving higher from now. I would prefer Ancom to Nylex.

Note:

Ancom’s main businesses are grouped into Agricultural Chemicals, Logistics, Polymer and Engineering divisions while Nylex’s businesses are grouped into Agricultural Chemicals & Polymer divisions. Nylex is 56%-owned by Ancom. Besides Nylex, Ancom also has a 29%-stake in another listed company i.e. Tamco Corporate Holdings Bhd, which is involved in the design, manufacture, supply, installation & commissioning of switchgear equipment & systems for power distribution & motor control.

London Biscuit may have a bullish breakout

Background

London Biscuit Bhd ("Lonbisc") is involved in the manufacture & sale of confectionery and other related foodstuffs.

Recent & On-going Corporate development

Lonbisc has recent acquired a 20%-stake in Lay Hong Bhd, a listed company involved in poultry farming for RM9.85 mil. Lonbisc explained that the reason for the acquisition is to gain control and ownership of a major supplier to ensure adequate, regular and continuous supply of liquid eggs at "controlled prices" to meet its ongoing expansion plans.

In addition, Lonbisc is in the midst of assessing the feasibility of listing its principal subsidiary company, Kinos Food Industries (M) Sdn Bhd (“Kinos”) on the Alternative Investment Market on the London Stock Exchange. The successful listing of Kinos could give a boost to Lonbisc’s visibility amongst investors & thus could be a catalyst for a re-rating of Lonbisc’s share price.

Recent Financial Results

Lonbisc's last 4 quarters' performance has improved as compared to the preceding 4 quarters. During the periods under consideration, its net profit has increased by 17% from RM18.0 mil to RM21.0 mil while turnover has gained 24% from RM88.0 mil to RM109 mil.


Valuation

Based on the closing share price of RM1.95 today & its 4 latest quarters' EPS of 21.0 sen, Lonbisc is trading at a PE of 9.2 times. At this multiple, I believe Lonbisc is still trading below its fair value, probably by about 10-15%.

Technical Outlook

Lonbisc has broken above its downtrend line at RM1.75/80 in July 2006. For the past 4 months, the share price has not been able to surpass the strong horizontal resistance of RM1.90/92. Today, the share price has surpassed this resistance to close at RM1.95, albeit on relatively thin volume.


Chart: Lonbisc's weekly chart as at Jan 23

Conclusion

If the share price can maintain above the RM1.90/92 level, Lonbisc would have a bullish breakout & its uptrend may commence. We must await confirmation of this tentative breakout, hopefully supported by a more convincing volume.

Call warrants: First expiry & other matters

On January 25 (Thursday), two CWs will be suspended from trading. They are Astro-CA & Scomi-CA, which will expire on January 29. Assuming that the closing level of Astro & Scomi (being the Volume Weighted Average Market Price ('VWAMP') for the 5 days before & including the expiry date) is equal to RM5.40 & RM0.98 respectively (i.e. the closing price as at yesterday, January 22), the holders of Astro-CA shall receive RM0.375 for each unit held while the holders of Scomi-CA will receive nothing. The amount of cash settlement receivable is equal to the difference between the closing level of the underlying share less the exercise price of the Call Warrant, and divided by the exercise ratio of Call Warrant.


Table" Astro-CA & Scomi-CA's particulars & estimated cash settlement

Here, I like to highlight a few points about Call Warrants listed on our exchange:

  • Almost all our Call Warrants are American-style options, which are option contracts that can be exercised at any time from the date of purchase (or, issuance) up to and including the expiration date. The only exception is the Basket Call WArrant, ZA-OSKSB, which was initially a European-style option before being converted to a Bermudian-style option. A Bermudian-style option is an option that has pre-determined exercise dates (in the case of ZA-OSKSB, there are 4 exercise dates in a year) while a European-style option can only be exercised at the expiration date.

  • 24 of our existing Call Warrants, which numbered 35 as at January 22, are cash-settled. The remaining 11 Call Warrants are physically-settled. A Call Warrant with physical settlement requires the holder to subscribe for the underlying share by paying the exercise price to the issuers. Obviously, this requirement is quite onerous for retail players as most underlying shares are blue chips and, as such, are fairly pricey. From the table below, the physically-settled call warrants are denoted by "#".


Table: CW Pricing Table from OSK188.com

Monday, January 22, 2007

Market may hit 1200-1220 before correcting

After studying the CI closely, I think that the CI may put in a repeat performance for the next 2 or 3 weeks (marked as 'B') which may mirror its outstanding performance in the second half of November 2006 & first week of December 2006 (marked as 'A').

In the earlier period, the CI gained 90 points from 1020 to 1110. If the CI can duplicate this gain in the current rally, it may rise to 1220 (i.e. 1130 plus 90 points). The time taken to travel that distance in the earlier period was 12 to 15 days. If the same time is needed in the current rally, the CI may peak in the second week of February.

The start of the earlier rally was a kink in the lower Bollinger Band (marked by a red arrow). This was also witnessed in the current rally set-up. The other pre-requisites are the MACD must have hooked up earlier and the volume must be on a steady rise. The overbought RSI should not be too worrying & may stay overbought throughout the rally period. See the area marked out as A1 & B1.

The rally would have ended if the MACD has hooked down; the upper Bollinger Band has flattened out & then hooked down; and, the RSI has dropped below 70. But, these are all lagging indicators. For "leading indicators", you need to look out for signs of overheatedness such as the CI testing the upper Bollinger Band (& pulling back on a few occassions) & an unsustainable surge in volume traded. If these "leading indicators" are present, you may want to reduce your position steadily ahead of the correction.

The foregoing technical forecast is only useful as a rough guide. We must always accept the undisputed rule that the market seldom repeats itself. But, if it does, you should be ready to pound on it.


Chart: CI's daily chart as at Jan 22

TA has a bullish breakout at RM0.825

TA has broken out of its ascending triangle at the RM0.825 today (see Chart 1). Its warrant i.e. TA-WB has similarly broken above its triangle at RM0.21 (see Chart 2). Based on these, I believe TA & TA-WB could be a good BUY.


Chart 1: TA's daily chart as at Jan 19


Chart 2: TA-WB's daily chart as at Jan 19

Melewar may commence its uptrend

Melewar is essentially involved in the steel manufacturing. The bulk of its business income is derived from its principal subsidiary, Mycron Steel Bhd. For details of Melewar's performance, refer to the table below.


Technical Outlook

Melewar has broken above its downtrend line in May 2006. Since then, it has been consolidating in a symmetrical triangle. Today, it has broken above that triangle at the RM1.18/20 level. Resistances can be seen at RM1.55, RM1.95 & RM2.25 (see Chart 1).

Chart 1: Melewar's weekly chart as at Jan 19

Melewar-WA, which has an exrcise price of RM1.50 & expiring on June 14, 2010, has also experienced a breakout as well as a new high (see Chart 2). This very bullish breakout for the warrant only reinforces the bullish potential of Melewar.

Chart 2: Melewar-WA's weekly chart as at Jan 19

DLady is at its uptrend line

DLady has been sliding off since making a high of RM14.00 on December 1 last year. It has tested its short-term uptrend line support at RM11.40 a few days ago (see Chart 1 below). This also coincides with the 20-week SMA support at RM11.35/40 (see Chart 2 below). I believe that the stock could rebound from this level. For trading purposes, you can buy at RM11.40/50 & look to sell at RM12.50/13.00. DLady, which has a dividend yield of 7.5% and trades at a PE of 18.4 times, can also be considered a buy for the medium-term. This is based DLady's share price of RM11.50 (at 12.00 noon today); its past 4 quarters' dividend totalling 86.25 sen and its past 4 quarters' EPS totalling 62.47 sen.


Chart 1: DLady's daily chart as at Jan 19


Chart 2: DLady's weekly chart as at Jan 19

Friday, January 19, 2007

Call Warrant updates as at January 19, 2007

The call warrants' prices increased by 11.54% since last Friday (January 12) as compared to a 3.10%-increase in the underlying share prices. The average premium has declined from 9.66% to 9.21% (see Table 1 below).


Table 1: Changes in Call warrants' prices, underlying share prices & premium from Jan 12 to Jan 19

The usual Call Warrants update is posted here as Table 2. The cheap call warrants (those trading at a discount or at a premium not exceeding 6%) are highlighted in yellow while 2 call warrants that are due to expire in January 2007 (i.e. Astro-CA & Scomi-CA), have their expiry dates highlighted in pink and the 4 call warrants that are due to expire from February to April 2007 (i.e. BJToto-CA, Bursa-CA, IOI-CA & TM-CB) have their expiry dates highlighted in orange.


Table 2: Call warrants' intrinsic value & premium as at Jan 19

In my post last week, I've stated that "The weakness amongst the blue chips may be a sign that the market is entering a different phase where the players have begun to shift their attention to second- & third-liners." I've come to this conclusion based on the observation that "...the majority of the underlying shares (for which the CWs were derived) are not making higher 'highs'". The market has shown in the past few days how wrong that statement was. We have seen how the blue chips have overcome strong resistance as well as testing or surpassing their recent "highs". Nevertheless, the majority of the CWs have yet to exceed their "highs" in December last year. One plausible explanation is that the gain in the intrinsic value of the CWs (which resulted from gains in the underlying share price) could not match the erosion of the time value of these CWs.

Before I leave, I like to share another observation, which relates to the YTL technical breakout story that I've highlighted earlier. I'm beginning to wonder whether this breakout is a genuine breakout or just an elaborate play, involving the underlying share, the 2 company-issued warrants (YTL-WA & YTL-WB) as well as the CW (YTL-CA). The centerpiece of this play is an mis-priced CW (mis-priced because it is overpriced when compared to the other warrants that derived their value from the same underlying share).


Table 3: YTL-CA, YTL-WA & YTL-WB's prices and premia as at Jan 18, 2007

How does it work? Firstly, issue a CW (i.e. YTL-CA) at the normal premium that CWs are issued in the market. Secondly, let the investors discovered that the other warrants (i.e. YTL-WA & YTL-WB) are cheaper than the CW issued and began to accumulate these cheaper warrants (see Table 3 above). Thirdly, the price of the cheaper warrants began to rise. Fourthly, the underlying share also began to rise (no thanks to bloggers like this one). Finally, the CW also began to rise. Any complaint so far? Or, shall we just celebrate the virtuous cycle of wealth creation.

This story is possibly not true. In all probability, it might just be my mind playing games with me. But, I just can't figure out who would subscribe for a CW like YTL-CA when there were cheaper & better alternatives out there? YTL-CA was issued at a premium of RM1.71 while YTL-WA & YTL-WB were trading at a small discount of RM0.19 & RM0.08, respectively on the same date (see Table 4 below). Curiouser and curiouser???


Table 3: YTL-CA, YTL-WA & YTL-WB's prices and premia as at Dec 18, 2006

HLBank has just made a new high

HLBank has just broken out of a 6-year ascending triangle & will create a new all-time high (which depends on the closing today). If this breakout can sustain (i.e. it needs to hold above the breakout level of RM5.90), this will be one of the best breakout I've ever seen. A very good buy!!!


Chart: HLBank's monthly chart as at Jan 18

HPI impresses with good results

Background

HPI Resources Bhd ("HPI") is involved in the manufacture of corrugated carton & plastic packaging products. The corrugated carton packaging division contributes 90% of the group's turnover & all its profit, while the latter contributes the remaining of its topline but nothing to the bottomline.

Recent Financial Results

HPI's last 4 quarters results has been very good. During that period, its net profit jumped by more than 3 folds from RM2.4 mil to RM11.0 mil, while its turnover has increased by 22% from RM215 mil to RM263 mil.


Valuation

Based on the share price of RM0.865 at 12.00 noon today & its last 4 quarters' EPS of 25.8 sen, HPI is now trading at a PE of 3.4 times only. At this multiple, HPI is considered cheap.

Technical Outlook

HPI share price moves in a very erratic fashion. In May 2005, HPI plunged from RM1.50 to RM0.80. Thereafter, the share price drifted to a low of RM0.45 in February 2006. Since then, it has been going up gradually. To rise farther, HPI must overcome its medium-term downtrend line, currently at RM0.80. It has done so yesterday when it crossed this resistance & closed at RM0.82. However, this breakout is not supported by good volume.


Chart: HPI's weekly chart as at Jan 18

Conclusion

Based on attractive valuation & possible breakout, I would recommend investing in HPI for the medium-term.

Maybank: Is it about to break above RM12.00

On January 11, I've highlighted that Maybank has broken below its short-term uptrend line at the RN11.40/50 level (go here). It has however rebounded 3 days later to stay above its uptrend line. Yesterday, it closed at RM12.00, its strong horizontal resistance (see Chart 1 below). Can it surpass this level?


Chart 1: Maybank's daily chart as at Jan 18

Based on the movement of Maybank-CA & Maybank-CB, I think it is likely that Maybank may break above the RM12.00 level soon. From Chart 2 & 3 below, you can see that the CWs have both broken above their respective triangle.

Chart 2: Maybank-CA's daily chart as at Jan 18


Chart 3: Maybank-CB's daily chart as at Jan 18

Thursday, January 18, 2007

MMC has made a new high

This morning, there are news reports that Syed Mokhtar plans to inject the Jeddah port development project worth RM1.6 billion, secured by Seaport Terminal Sdb Bhd (the controlling shareholder of MMC) into MMC. Following these reports, MMC has broken above its all-time high of RM4.285 (take that as RM4.30) recorded in January 1994. At 3.30 p.m., MMC is at RM4.40- gaining 24 sen. You may buy now or when the share price drops back to RM4.30.


Chart 1: MMC's monthly chart as at Jan 17


Chart 2: MMC's daily chart as at Jan 17

EON: Is the worst over?

Background

Proton share price has broken above its medium-term downtrend line at the RM5.00 level in the w/e November 10, 2006 amidst news reports that the Government was contemplating selling off a stake in Proton manufacturing plant in Tanjong Malim. Since then, Proton has gained 30-35% (see Chart 1 below).


Chart 1: Proton's weekly chart as at Jan 17

What about EON?

EON's problems are just as intractable as Proton's. From Chart 2, we can see that EON has broken out of its medium-term downtrend line (bb) in the w/e August 18, 2006 at the RM2.00 level. Despite the breakout, EON has moved sideway in a bottoming-out process (where the share price has been drifting in a slightly sloping channel). Yesterday, EON broke above the upper channel at the RM2.15 level (see Chart 3). With this, I believe EON share price is likely to move higher from now on. Resistances can be seen at the RM2.60, 2.90 & 3.00 level.


Chart 2: EON's weekly chart as at Jan 17


Chart 3: EON's daily chart as at Jan 17

Public Bank has made a new high

Public Bank made a high of RM7.80 in February 2005. It managed to exceed this high marginally on December 7 last year (when it made a high of RM7.90). Public Bank has been testing this new high of RM7.90 & the psychological RM8.00 level in the past 4 days; again making a new high of RM8.05. At 9.25 a.m. this morning, Public Bank has exceeded the latest high of RM8.05 when it traded at RM8.10. I believe Public Bank's upside move could finally be on its way. Buy Public Bank now.


Chart 1: Public Bank's monthly chart as at Jan 17


Chart 2: Public Bank's daily chart as at Jan 17