Another bluechip that is facing strong selling pressure is Maybank. The stock may test its recent low of RM8.00 soon. If this psychological level is violated, the next horizontal support is at RM7.70. On a rebound, Maybank will encounter resistance from its medium-term downtrend line at RM8.45 & horizontal resistance at RM8.80.
Maybank is facing some uncertainties on two fronts. Firstly, it will have a new CEO on May 2nd, when Abdul Wahid Omar (currently the CEO of TM) will join Maybank. Wahid, who will be replacing Amirsham Aziz, will inherit some oversea acquisitions, such as Bank International Indonesia, which were initiated by his predecessor. Some of these acquisitions were made at prices which some analysts find to be on the high side, given the drop in bank valuation worldwide in the face of global economic slowdown & current on-going financial crisis in the US. So, the second problem is how Maybank will grow in this challenging environment?
Chart 1: Maybank's daily chart as at April 29, 2008 (courtesy of Quickcharts)
Chart 2: Maybank's monthly chart as at April 29, 2008 (courtesy of Quickcharts)
(For more on the challenges that Wahid will face in Maybank, you can read this article in the recent issue of the Edge).
This is a personal weblog, reflecting my personal views and not the views of anyone or any organization, which I may be affiliated to. All information provided here, including recommendations (if any), should be treated for informational purposes only. The author should not be held liable for any informational errors, incompleteness, or delays, or for any actions taken in reliance on information contained herein.
Wednesday, April 30, 2008
Tenaga to test its recent low of RM6.60
Tenaga has dropped to its recent low of RM6.60 again (see Chart 1 below). If this level is broken, Tenaga's next support will be at RM6.00 (see Chart 2 below). The present political situation & rhetoric would make it very difficult for the Government to agree to any tariff increase for Tenaga in the near future. Thus, Tenaga's profit margin will be squeezed in the light of higher fuel cost. This is quite unfortunate because Tenaga is a private enterprise with profit-making objective. While it needs to consider its social obligation, it cannot be expected to absorb the higher operating cost indefinitely.
In the event of a rebound, Tenaga will encounter resistance from its medium-term downtrend line at RM7.30 & horizontal resistance at RM7.60.
Chart 1: Tenaga's daily chart as at April 29, 2008 (courtesy of Quickcharts)
Chart 2: Tenaga's monthly chart as at April 29, 2008 (courtesy of Quickcharts)
In the event of a rebound, Tenaga will encounter resistance from its medium-term downtrend line at RM7.30 & horizontal resistance at RM7.60.
Chart 1: Tenaga's daily chart as at April 29, 2008 (courtesy of Quickcharts)
Chart 2: Tenaga's monthly chart as at April 29, 2008 (courtesy of Quickcharts)
Tuesday, April 29, 2008
US Dollar's slide should be halted
Tonight, the Fed will meet to decide whether to have another interest rate cut. There are many observers who believe that further rate cuts will exert more pressure on the US Dollar, which has been sliding for the past 2 years. A Fed decision to keep interest rate unchanged or to cut interest rate by 25 basis points (accompanied by a statement that it will be the final rate cut) could help US Dollar in the short-term. For more on US Dollar weakness, check out this article, US Dollar: The next shoe to drop by Manu Bhaskaran, which appeared in the Edge, this week.
From Chart 1, you can see that the USD index has dropped from 92 in November 2005 to a recent low of 72. The MACD indicator is poised to hook up. A positive news on the interest rate front, as discussed, would help. A rebound could possibly put the USD index up to 75 and maybe 78.
Chart 1: USD Index chart as at April 28 (Source: Stockcharts.com)
In my opinion, the weak US Dollar is one of the main factors driving the current bull run for many commodities. A reversal in the US Dollar could lead to a correction in commodity prices. From Chart 2, we can see that the CRB index has recovered from its recent correction & is now revisiting its March high again. You can see that CRB's MACD indicator is poised to hook down.
Chart 2: CRB Index chart as at April 28 (Source: Stockcharts.com)
Crude Oil- presently the most bullish commodity play- has been matching up strongly after breaking above the strong psychological resistance of USD100. The current accelerated uptrend, starting from February this year, has chalked up a gain of USD35 (from USD85 to USD120). This surpasses the gain of USD30 recorded in the earlier accelerated uptrend in July-November last year (from USD70 to USD100). As such, the current run-up is quite extended & players may look for excuse to lock in some profit.
Chart 3: Crude Oil Index chart as at April 28 (Source: Supercharts by Omega Research)
Soya Oil & CPO, which had benefited from the strong run-up in Crude Oil, had recovered some ground, lost in the recent sharp correction. Nevertheless, one can see clearly that the recovery is lagging in pace when compared to Crude Oil. A sharp correction in Crude Oil could lead to similar correction in Soya Oil, whereby the latter may test its recent reaction low of 50. A break of this level could send Soya Oil to its long-term uptrend line support of 43. See Chart 4.
Chart 4: Soya Oil Index chart as at April 28 (Source: Supercharts by Omega Research)
Similarly, CPO could also re-test its recent reaction low of RM3000, and if this level is violated, it may test its medium-term uptrend line support at RM2850-2900. See Chart 5.
Chart 5: CPO's daily chart as at April 28, 2008 (source: ifs.marketcenter.com)
I believe that the Fed is very concern about the continued slide in the US Dollar. They, and almost every governments out there, should be worried about the continued rise in the price of basic commodities, especially food items (such as rice & wheat). The recent riot in the Philippines, due to the shortage of rice, could be a harbinger of more trouble ahead, if nothing is done to check the continued rise in commodity prices. Checking the slide in the US Dollar could be the starting point, as most commodities are priced in US Dollar.
Note: The FOMC meeting was scheduled for Wednesday, not Tuesday.
Muda's uptrend may have started
Background
Muda Holdings Bhd ('Muda') is involved in paper milling & paper packaging. It pioneered the paper & paper packaging industry in Malaysia.
Recent Financial Results
For QE31/12/2007, Muda's turnover increased by 11.0% q-o-q or 24.6% y-o-y to RM202 million. As a result of the increased turnover, Muda reported a net profit of RM9.1 million, representing a 209%-jump over the immediate preceding quarter's net profit of RM2.9 million as well as a turnaround from a loss of RM20.9 million incurred in the same quarter last year. The company attributed the improved performance to higher demand & upward trend in products selling price.
Valuation
If Muda (closed at RM0.505 as at 28/4/2008) can maintain its net profit similar to QE31/12/2007, it might record an EPS of 12 sen for FY2008. Based on this earning assumption, Muda is now trading at a forward PE of 3.9 times. As such, Muda is trading at an attractive multiple.
Technical Outlook
Muda has been trending lower since making a high of RM2.53 in January 1994. It made a low of RM0.285 in January 2006 and immediately thereafter rebounded to break above the long-term downtrend line. Despite the breakout, the share price has been trapped in a range of RM0.30 & RM0.48 for the next 2 years. See Chart 1 below.
Chart 1: Muda's monthly chart as at April 28, 2008 (courtesy of Quickcharts)
On March 31st, Muda begun another upleg. With good volume, the share price surpassed the RM0.48 level on April 16th. That breakout failed to sustain & the share price dropped back into the range again. Yesterday, the share price again surpassed the RM0.48 level as well as the psychological RM0.50 level (see Chart 2 below). As at 4.00 pm today, the share price is still firming upward & was trading at RM0.53. I believe that Muda could starting on its uptrend now. The immediate resistance is at RM0.60 and thereafter at RM0.80.
Chart 2: Muda's daily chart as at April 28, 2008 (courtesy of Quickcharts)
Conclusion
Based on improved performance & technical breakout, Muda could be a good BUY for medium-term.
Friday, April 25, 2008
WTK had a breakout yesterday
One of the timber stocks that had run up substantially since the recovery in timber prices is WTK. From early April until yesterday, WTK has risen from RM2.00 to RM2.61. The sharp rise of 26 sen (from RM2.35 to RM2.61) yesterday, happened after the share price broke out of a 7-month trading range at the RM2.40 level (see Chart 1 below). With this breakout, the stock is expected to reach a short-term target of RM2.80. The next target will be RM3.00-3.20.
We have to note that the share price has already increased by 30% in last 3 weeks. Despite the breakout, the sharp run-up might be followed by a short correction & the share price might drop back to re-test the breakout level of RM2.40. So, a trader, who has to weigh the risk to reward of entering now, might decide to wait. His decision might be different if the share price were lower (say, at RM2.45). On the other hand, if the share price were to break below the breakout level of RM2.40, a trader with position might decide to sell off his share, at a profit or a loss.
Chart 1: WTK's daily chart as at April 24, 2008 (courtesy of Quickcharts)
Chart 2: WTK's weekly chart as at April 24, 2008 (courtesy of Quickcharts)
This post serves to illustrate how you might trade WTK, following the steps in the previous post relating to Trading Technical Breakout. You would have probably identified this stock earlier- looked through its financial performance & noted its breakout level. When the breakout happened, you would then know how to act.
Thursday, April 24, 2008
Trading Technical Breakout
We have witnessed many technical breakout in the present market rally. How do you trade a technical breakout? I have come across this article in Investopedia entitled "Anatomy of Trading Breakouts" by Jeff Kohler, which I find to be very good. In summary, the steps to follow when trading breakouts are:
- Identify the Candidate
- Wait For the Breakout
- Set a Reasonable Objective
- Allow the Stock to Retest
- Know When Your Trade/Pattern Has Failed
- Exit Trades Toward the Market Close
- Be Patient
- Exit at Your Target
SSECI may have broken above its immediate downtrend line
On April 9th, I have posted that the SSECI may be due for a rebound, ahead of the upcoming Beijing Olympic (go here). The rebound has finally arrived. As at 10.00 pm ET, SSECI was up 278 points (or, 8.47%) to 3556. At this level, the SSECI has just broken to the upside of its immediate downtrend line resistance (at 3400). This breakout is likely to signal a bottom for the SSECI.
The market is finally seeing some recovery after the Chinese government had placed restrictions on sales of shares by controlling investors in listed companies on Monday, in an effort to avert a flood of new paper hitting the market.
Chart: SSECI's daily chart up to April 22nd (from Yahoo Finance)
The market is finally seeing some recovery after the Chinese government had placed restrictions on sales of shares by controlling investors in listed companies on Monday, in an effort to avert a flood of new paper hitting the market.
Chart: SSECI's daily chart up to April 22nd (from Yahoo Finance)
Wednesday, April 23, 2008
Natbio may have bottomed
Background
Natural Bio Resources Bhd ('Natbio') manufactures and distributes ready-to-drink coffee, tea and energy drinks under the brands Power Root, Ali Café, Per’l Café and Oligo Coco. It has 16 key dealers and a full-time marketing team of 59 people inMalaysia . Natbio was listed only in May last year.
Recent Financial Results
As Natbio was listed recently, we only have 3 quarters' results to guide us. From the table below, we can that Natbio's turnover averages about RM45 million per quarter, while its quarterly net profit is about RM10 million. EPS for full year would probably amount to 14.4 sen.
Past Financial Results
From its Prospectus for listing, we can look at its financial performance prior to its listing (go here). An extract is given below.
From the period from FY2004-2006, Natbio's turnover increased from RM12.7 million to RM98.0 million. Net profit jumped from RM458k to RM17.2 million. The sharp rise in its topline & bottomline may give rise to some concern whether they are sustainable. From the 3 available quarterly results, it seems that the company can maintain its growth.
Financial Position & Concerns
As at 31/11/2007, Natbio's current ratio & gearing ratio are at 9.1 times & 0.1 times, respectively. As such, Natbio's financial position is deemed very strong. Its Total Assets stood at RM230.8 million, which comprised Fixed Assets of RM44.6 million; Cash, Bank Balance & Fixed Deposits totaling RM86.6 million; Trade Debtors of RM54.7 million; and, Inventory of RM37.9 million. Trade Debtors' collection period & Inventory's turnover period were 110 & 76 days, respectively. I believe that the Trade Debtors & Inventory level is acceptable when we compare them with similar companies, such as Yeo Hiap Seng & Spritzer.
Valuation
Based on yesterday's closing price of RM0.81 & projected EPS of 14.4 sen, Natbio is trading at a PE of 5.6 times. As such, Natbio is deemed quite attractive.
Technical Outlook
Natbio made a high of RM1.97 in June last year. Since then, it has drifted lower & three weeks ago, it made a low of RM0.76. The share price appears to have broken to the upside of its downtrend line (marked as 'AA') in the past few days, on thin volume. As such, Natbio share price could have bottomed and a recovery may follow.
Chart: Natbio's daily chart up to April 22nd (from Tradesignum.com)
Conclusion
Natbio is quite attractive & the share price could have bottomed after a prolonged decline. It maybe a good BUY for the medium-term.
Natural Bio Resources Bhd ('Natbio') manufactures and distributes ready-to-drink coffee, tea and energy drinks under the brands Power Root, Ali Café, Per’l Café and Oligo Coco. It has 16 key dealers and a full-time marketing team of 59 people in
Recent Financial Results
As Natbio was listed recently, we only have 3 quarters' results to guide us. From the table below, we can that Natbio's turnover averages about RM45 million per quarter, while its quarterly net profit is about RM10 million. EPS for full year would probably amount to 14.4 sen.
Past Financial Results
From its Prospectus for listing, we can look at its financial performance prior to its listing (go here). An extract is given below.
From the period from FY2004-2006, Natbio's turnover increased from RM12.7 million to RM98.0 million. Net profit jumped from RM458k to RM17.2 million. The sharp rise in its topline & bottomline may give rise to some concern whether they are sustainable. From the 3 available quarterly results, it seems that the company can maintain its growth.
Financial Position & Concerns
As at 31/11/2007, Natbio's current ratio & gearing ratio are at 9.1 times & 0.1 times, respectively. As such, Natbio's financial position is deemed very strong. Its Total Assets stood at RM230.8 million, which comprised Fixed Assets of RM44.6 million; Cash, Bank Balance & Fixed Deposits totaling RM86.6 million; Trade Debtors of RM54.7 million; and, Inventory of RM37.9 million. Trade Debtors' collection period & Inventory's turnover period were 110 & 76 days, respectively. I believe that the Trade Debtors & Inventory level is acceptable when we compare them with similar companies, such as Yeo Hiap Seng & Spritzer.
Valuation
Based on yesterday's closing price of RM0.81 & projected EPS of 14.4 sen, Natbio is trading at a PE of 5.6 times. As such, Natbio is deemed quite attractive.
Technical Outlook
Natbio made a high of RM1.97 in June last year. Since then, it has drifted lower & three weeks ago, it made a low of RM0.76. The share price appears to have broken to the upside of its downtrend line (marked as 'AA') in the past few days, on thin volume. As such, Natbio share price could have bottomed and a recovery may follow.
Chart: Natbio's daily chart up to April 22nd (from Tradesignum.com)
Conclusion
Natbio is quite attractive & the share price could have bottomed after a prolonged decline. It maybe a good BUY for the medium-term.
Hiaptek broke above its short-term downtrend line
Hiaptek is involved in the manufacture of steel pipes & other related products as well as in the distribution of hardware and building materials.
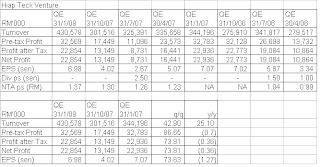
Its recent financial results for QE31/1/2008 shows that the group's net profit has recovered from the slump in the past 2 quarters, i.e. QE31/10/2007 & QE31/7/2007. Its net profit has increased by 73.8% q-o-q to RM22.9 million on a 42.8%-increase in turnover of RM430.6 million. When compared to the same quarter last year, net profit was marginally lower while turnover was up 25.1% from RM301.5 million, previously.
If Hiaptek can maintain its earning for the next few quarters like that of QE31/1/2008, it may earn 28 sen per share. At the share price of RM1.72 (its closing price at the end of today's morning session), Hiaptek is now trading at a PE of 5.9 times. At this multiple, Hiaptek is deemed inexpensive.
From Chart 1 below, we can see that Hiaptek has just broken above its short-term downtrend line of RM1.63-65 level. Hiaptek is still in a long-term uptrend line, with support at RM1.55-57. It needs to overcome its medium-term downtrend line resistance at RM1.82-84, before the upleg can really pick up the pace (see Chart 2 below).
Chart 1: Hiaptek's daily chart as at April 22, 2008 (courtesy of Quickcharts)
Chart 2: Hiaptek's weekly chart as at April 22, 2008 (courtesy of Quickcharts)
Based on attractive valuation and technical breakout, Hiaptek could be a good BUY at the present price level.
Note: I had called a BUY on this stock in September 2006 (go here).
Tuesday, April 22, 2008
Allianz- a cheap composite insurance company
Background
Allianz Malaysia Bhd ('Allianz') is a composite insurance company. As part the group's restructuring exercise [which included the completion of the acquisition of Commerce Assurance Bhd ('CAB') on August 28th last year], Allianz now has three subsidiaries – the other two being Allianz Life Insurance Malaysia Bhd ('ALIM') and Allianz General Insurance Co (M) Bhd ('AGIC'). As of December 2006, Allianz was the country's second largest general insurer with about 10% market share. It currently has 56 branches – 34 for Allianz and 22 for CAB.
For the FYE31/12/2007, Allianz's turnover increased by 27.4% from RM1.134 billion to RM1.445 billion. The increase was attributable to strong gross in gross premium of 27% or RM288 million for the general insurance business & RM102 million for the life insurance business, respectively. The newly-acquired subsidiary, CAB contributed RM125 million to the gross premium of the general insurance business.
Allianz reported a net loss of RM2.6 million as compared to a net profit of RM35.0 million previously due mainly to a pre-tax loss of RM33.9 million incurred by CAB as a result of higher claims incurred & provision for bad & doubtful debts, following the alignment of the practices & procedures of CAB & the group. CAB also incurred a one-off integration cost of RM15.9 million for voluntary separation scheme, impairment & write-off of assets & branch relocation exercise. Most of the above-mentioned expenses, provisioning & write-off was done in the QE31/12/2007. Thus, the group's results for QE31/12/2007 was impact accordingly.
The group's earning up to FY2009 will come solely from the general insurance business. The life insurance business will only begin to contribute to the group's profit in FY2010 after it had beefed up the Life Insurance' solvency margin under Bank Negara's requirement.
Valuation
Ignoring the one-off loss incurred in QE31/12/2007, Allianz share would probably have an earning of about 40 sen for FYE31/12/2007. Assuming it can maintain that level of earning for current year, Allianz (closed at RM3.54 today) would be trading at a PE of about 8.9 times. At this PE, Allianz is cheap.
Technical outlook
Allianz share price dropped from a high of RM6.65 on requotation to a recent low of RM2.97. In the past two days, the share price has shot up by 50 sen. The share, which could have bottomed at the RM3.00 level, would probably rise further as there is not much resistance in sight. The downtrend line, drawn from its high of RM6.65, would present some resistance at the RM3.90-4.00 level. However, it is noted that the upleg in the past 2 days is on relatively thin volume. A break above RM4.00 would mean the downtrend is over.
Chart: Allianz's daily chart as at April 21, 2008 (courtesy of Quickcharts)
Conclusion
Allianz is a composite insurer, with a very promising future. While the technical picture has yet to turn positive, there is sign that it could have bottomed. Allianz could be a good stock to accumulate on weakness.
Allianz Malaysia Bhd ('Allianz') is a composite insurance company. As part the group's restructuring exercise [which included the completion of the acquisition of Commerce Assurance Bhd ('CAB') on August 28th last year], Allianz now has three subsidiaries – the other two being Allianz Life Insurance Malaysia Bhd ('ALIM') and Allianz General Insurance Co (M) Bhd ('AGIC'). As of December 2006, Allianz was the country's second largest general insurer with about 10% market share. It currently has 56 branches – 34 for Allianz and 22 for CAB.
Allianz's future growth may come from its bancassurance tie-up with CIMB Bank to distribute its general insurance products. That gives the group a larger distribution network as it is able to sell products, which include fire, motor and marine insurance through CIMB's 383 branches.
Financial ResultsFor the FYE31/12/2007, Allianz's turnover increased by 27.4% from RM1.134 billion to RM1.445 billion. The increase was attributable to strong gross in gross premium of 27% or RM288 million for the general insurance business & RM102 million for the life insurance business, respectively. The newly-acquired subsidiary, CAB contributed RM125 million to the gross premium of the general insurance business.
Allianz reported a net loss of RM2.6 million as compared to a net profit of RM35.0 million previously due mainly to a pre-tax loss of RM33.9 million incurred by CAB as a result of higher claims incurred & provision for bad & doubtful debts, following the alignment of the practices & procedures of CAB & the group. CAB also incurred a one-off integration cost of RM15.9 million for voluntary separation scheme, impairment & write-off of assets & branch relocation exercise. Most of the above-mentioned expenses, provisioning & write-off was done in the QE31/12/2007. Thus, the group's results for QE31/12/2007 was impact accordingly.
The group's earning up to FY2009 will come solely from the general insurance business. The life insurance business will only begin to contribute to the group's profit in FY2010 after it had beefed up the Life Insurance' solvency margin under Bank Negara's requirement.
Valuation
Ignoring the one-off loss incurred in QE31/12/2007, Allianz share would probably have an earning of about 40 sen for FYE31/12/2007. Assuming it can maintain that level of earning for current year, Allianz (closed at RM3.54 today) would be trading at a PE of about 8.9 times. At this PE, Allianz is cheap.
Technical outlook
Allianz share price dropped from a high of RM6.65 on requotation to a recent low of RM2.97. In the past two days, the share price has shot up by 50 sen. The share, which could have bottomed at the RM3.00 level, would probably rise further as there is not much resistance in sight. The downtrend line, drawn from its high of RM6.65, would present some resistance at the RM3.90-4.00 level. However, it is noted that the upleg in the past 2 days is on relatively thin volume. A break above RM4.00 would mean the downtrend is over.
Chart: Allianz's daily chart as at April 21, 2008 (courtesy of Quickcharts)
Conclusion
Allianz is a composite insurer, with a very promising future. While the technical picture has yet to turn positive, there is sign that it could have bottomed. Allianz could be a good stock to accumulate on weakness.
Pelikan is about to test its uptrend line
Background
Pelikan is involved in the manufacturing & distribution of writing instruments, art, painting & hobby products, office stationeries & printing consumables (go here). In January 2007, it completed its acquisition of Pelikan Hardcopy Holding AG ('PHH'), which is involved in the manufacturing & distribution of printer supplies (go here).
Prior to April 2005, Pelikan (formerly, Diperdana) was involved in the provision of logistics & related services. This business was sold off to Konsortium Logistik Bhd.
Financial Results
For FYE31/12/2007, Pelikan's net profit increased by 20.4% from RM77.3 million to RM93.0 million. Turnover jumped 81.3% from RM659 million to RM1.19 billion. The huge increase in turnover is attributable to the completion of its acquisition of the Hardcopy business at the beginning of the year. Nevertheless, the increase in its net profit was very much smaller because the margin of the Hardcopy business is lower.
For the QE31/12/2007, Pelikan reported a net loss of RM10.4 million as compared to a net profit of RM22.1 million recorded in the immediately preceding quarter (QE30/9/2007) or a net profit of RM7.3 million recorded in the same quarter last year (QE31/12/2006). The loss was attributable to:
Valuation
Pelikan (closed at RM3.08 as at 21/4/2008) is trading at a trailing PE of 9.1 times (based on EPS of 34 sen for FYE31/12/2007) or at a P/Book of 1.8 times (based on NTA per share of RM1.70 as at 31/12/2007). At these multiples, Pelikan is deemed attractively priced.
Technical Outlook
Pelikan rose from a low of RM0.63 in June 2004 to a high of RM5.80 in July 2007 (see Chart 2). Since then, the share price has been drifting lower. [At the end of the morning session today, Pelikan share price dropped 8 sen to RM3.00.]
From the weekly chart (Chart 1), we can see that Pelikan's uptrend line support is at RM3.00. Its immediate horizontal support is at RM2.80 and thereafter at RM2.10. Its immediate horizontal resistance is RM3.40 & thereafter at RM3.70.
Chart 1: Pelikan's weekly chart as at April 21, 2008 (courtesy of Quickcharts)
Chart 2: Pelikan's monthly chart as at April 21, 2008 (courtesy of Quickcharts)
Conclusion
Based on relatively attractive valuation & potential good technical support at the RM3.00 level, Pelikan could be a good stock to buy for the medium-term.
Note: I had called a BUY on this stock in November 2006 (go here).
Pelikan is involved in the manufacturing & distribution of writing instruments, art, painting & hobby products, office stationeries & printing consumables (go here). In January 2007, it completed its acquisition of Pelikan Hardcopy Holding AG ('PHH'), which is involved in the manufacturing & distribution of printer supplies (go here).
Prior to April 2005, Pelikan (formerly, Diperdana) was involved in the provision of logistics & related services. This business was sold off to Konsortium Logistik Bhd.
Financial Results
For FYE31/12/2007, Pelikan's net profit increased by 20.4% from RM77.3 million to RM93.0 million. Turnover jumped 81.3% from RM659 million to RM1.19 billion. The huge increase in turnover is attributable to the completion of its acquisition of the Hardcopy business at the beginning of the year. Nevertheless, the increase in its net profit was very much smaller because the margin of the Hardcopy business is lower.
For the QE31/12/2007, Pelikan reported a net loss of RM10.4 million as compared to a net profit of RM22.1 million recorded in the immediately preceding quarter (QE30/9/2007) or a net profit of RM7.3 million recorded in the same quarter last year (QE31/12/2006). The loss was attributable to:
- Higher percentage sales of lower margin Hardcopy products, as compared to QE30/9/2007, when sales of higher margin writing instruments was higher due to "back to school"season in Europe;
- The group continued to incur additional costs in merging the newly acquired businesses with the existing operation. This includes provisions to cover losses relating to pre-acquisition period of PHH group (which also included losses from subsequent sale of assets of PHH group).
- Reversal of negative goodwill of RM16.8 million, which was recognized as other income in the 1st quarter. This negative goodwill arose from the acquisition of PHH group.
Valuation
Pelikan (closed at RM3.08 as at 21/4/2008) is trading at a trailing PE of 9.1 times (based on EPS of 34 sen for FYE31/12/2007) or at a P/Book of 1.8 times (based on NTA per share of RM1.70 as at 31/12/2007). At these multiples, Pelikan is deemed attractively priced.
Technical Outlook
Pelikan rose from a low of RM0.63 in June 2004 to a high of RM5.80 in July 2007 (see Chart 2). Since then, the share price has been drifting lower. [At the end of the morning session today, Pelikan share price dropped 8 sen to RM3.00.]
From the weekly chart (Chart 1), we can see that Pelikan's uptrend line support is at RM3.00. Its immediate horizontal support is at RM2.80 and thereafter at RM2.10. Its immediate horizontal resistance is RM3.40 & thereafter at RM3.70.
Chart 1: Pelikan's weekly chart as at April 21, 2008 (courtesy of Quickcharts)
Chart 2: Pelikan's monthly chart as at April 21, 2008 (courtesy of Quickcharts)
Conclusion
Based on relatively attractive valuation & potential good technical support at the RM3.00 level, Pelikan could be a good stock to buy for the medium-term.
Note: I had called a BUY on this stock in November 2006 (go here).
Monday, April 21, 2008
Badawi- finally walking the talk
What a breath of fresh air from Badawi. The man, who was never known to be bold nor daring, seems to have finally thrown caution to the wind. Four days ago, he surprised Malaysians by announcing the setting up of a Judicial Appointments Commission, which will help evaluate and vet candidates for judicial appointments in a credible manner (go here). Today, he has just announced plan to turn the Anti-Corruption Agency (ACA) into a full-fledged commission by year-end in order to enhance its independence in terms of its operations. The strengthening of the ACA was one of the four key reform initiatives that would be carried out by the government in the move to address the public concerns on corruption in the country (go here).
I believe that these moves should help Badawi, who is facing stiff challenges from within his party as well as from the opposition, Pakatan Rakyat. He is clearly signaling that he has heard the people's concerns & is now working towards a meaningful solution. In so doing, Badawi is able to project a good image for himself- staying above the fray & busy repairing the damages suffered by the Barisan Nasional & UMNO from the recent General Election. His opponents in UMNO would have to quiet down or else they will appear like a bunch of trouble-making misfits. By adopting this reform agenda, Badawi will also be removing the grievances on which Pakatan Rakyat can capitalize on.
If Badawi can implement his reform agenda, there is a good chance that his administration may survive. With greater transparency, improved accountability & a reduction in corruption, the nation will benefit as more foreign investment will flow in. This should translate into increased economic growth & a higher valuation for the shares in our stock market. As such, this could be a good time to accumulate stocks.
Landmrk's Indonesia casino project in trouble?
The Star newspaper reported on Saturday that fresh doubts had arisen over Landmrk's Indonesia casino project in Bintan (go here). The Star quoted a report, which appeared on Thursday in a Singapore newspaper, the Straits Times, where an Indonesia official in charge of development planning in Bintan as stating that the casino plan was rejected "a long time ago".
Now, who is telling the truth here? Firstly, the relevant authority in Bintan had designated the land owned by Bintan Treasure Bay Pte Ltd as an international Exclusive Integrated Tourism Zone (EITZ) in January this year. It had also zoned the land for medical tourism, gaming and information technology hosting (go here). Thereafter, Landmrk proposed to increase its stake in Bintan Treasure Bay (the developer of the integrated resorts in Bintan where casino will be operated) from 74% to 100% in February. Landmrk will be paying RM360 million for this additional 26% in Bintan Treasure Bay as compared to RM400 million paid last year for the earlier 74%.
This report highlights the political risk of doing business in Indonesia. One only has to look at the problems faced by Astro & MSC to see that a company operating there will face a myriad of conflicting laws & regulations. To make matter worse, Landmrk is getting in a business which is regarded as illegal in the predominantly Muslim society. However, the community must also weigh the benefits from such a project. The integrated resorts, which will generate employment & tourist revenue, may not proceed as planned, without the casino operation.
From the weekly chart below, we can see that Landmrk has dropped from its high of RM2.60 in November last year to a low of RM1.69 in March- losing a whopping RM1.91 in just 5 months. Could the share be dropping ahead of uncertainty over whether Landmrk would get the casino license?
The share price then rebounded from the low of RM1.69 to a recent high of RM2.60 last Thursday (on April 17th). That's a 91 sen (or, 48%) recovery of the loss of RM1.91. Such a rapid recovery could lead to profit-taking at this juncture, with or without a bad news such as those reported in the newspaper. Based on the chart, I believe that the share price of Landmrk may drift lower until the problem has been satisfactorily addressed. I see support at RM2.00 and RM2.15.
Chart: Landmrk's weekly chart as at April 18, 2008 (courtesy of Quickcharts)
Thursday, April 17, 2008
Technical Outlook of selective Asian equity markets
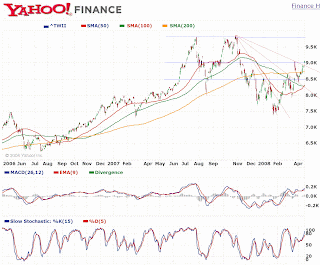
Today, I like to take a look at the technical outlook of some Asian stock markets (as per the table below). All these markets had corrected sharply in the past few weeks and are all trading below their 200-day Simple Moving Average (SMA).
All these indices had however broken above their downtrend line (unlike the indices of the developed nation where some had broken above the accelerated downtrend line, not the downtrend line drawn from their recent peak). In addition, two of these Asian markets' indices (i.e. TWII & KS11) had seen their 50-day SMA hooking up. As such, I believe these markets are positioned for a faster recovery than the markets in more developed nations. Strong horizontal resistance lies ahead for all these markets, so their upleg move will not be swift & easy.
After looking through these charts, I believe that our market is trying to do a catch-up with other Asian markets. Undoubtedly, our market would be slower to recover due to our political uncertainty.
Chart 1: HSI's daily chart up to April 16th (from Yahoo Finance)
Chart 2: TWII's daily chart up to April 16th (from Yahoo Finance)
Chart 3: STI's daily chart up to April 16th (from Yahoo Finance)
Chart 4: KS11's daily chart up to April 16th (from Yahoo Finance)
Prices of timber products increased further
I have just received the latest ITTO report for early April. I noticed that the table in my earlier two posts on this subject were wrong because I had mistaken the period of these reports. The error arose because ITTO prepares two reports for each month- one for the first half of the month & the other for the second half of the month. Nevertheless, the sequence of the data as presented in the earlier posts is correct & the conclusion still stands. That conclusion is the prices of timber products had bottomed & are now rising.
Source: The ITTO Tropical Timber Market Reports
From the above table, we can see that the prices of panel products, which were to first to see improved prices, are enjoying higher percentage price increases. This means companies, such like Evergreen, Mieco & Hevea should see better performance in the months ahead.
Note: Of the three stocks noted above, I prefer Evergreen & Mieco.
Wednesday, April 16, 2008
Lingui is about to break above its downtrend line
Lingui, which is one of the largest integrated timber group in Malaysia, has seen its share price sliding since making a high of RM4.20 in March 2007. It made a low of RM1.26 on March 24th & 25th. Yesterday, the share price rose 11 sen to close at RM1.45 (on volume of 1.2 million). As at 12.00 noon today, Lingui is up 19 sen to RM1.64 (on a volume of 1.75 million).
From the weekly chart below, we can see that the downtrend line resistance is at RM1.63-65. Lingui is about to test this downtrend line.
Chart: Lingui's weekly chart as at April 15, 2008 (courtesy of Quickcharts)
From the table below, we can see that Lingui's turnover & net profit have been sliding for the past 4-5 quarters. For QE31/12/2007, Lingui's net profit dropped by 27% q-o-q or 57% y-o-y to RM32.6 million. Its turnover has declined by 11% y-o-y to RM363 million, but inched up 2% when compared to the preceding quarter.
I expect Lingui's results for QE31/3/2008 to be unchanged when compared to those recorded in QE31/12/2007. However, some improvement maybe forthcoming in the next quarter due to higher prices seen in timber products (go here). The present rally in the share price maybe in anticipation of better times ahead for Lingui.
Market Outlook as at April 15
The KLCI gained 17.52 points to reach 1261.72 as at 11.02 am. At this mark, the KLCI has just broken to the upside of its downtrend line resistance at the 1260 level. This breakout could signal the beginning of the uptrend in the market.
For a convincing breakout & recovery, we need to see the following:
Chart: KLCIs daily chart as at April 15, 2008 (courtesy of Quickcharts)
For a convincing breakout & recovery, we need to see the following:
- the KLCI closing above the 1260 level at the end of the day;
- an expansion in market volume [You can see that the previous uptrend in September 2007 was also accompanied by an expansion in volume (see the pink & blue lines)]; and
- the 10-day SMA crossing above the 20-day SMA.
Chart: KLCIs daily chart as at April 15, 2008 (courtesy of Quickcharts)
Abu Dhabi group may buy into MBSB
Yesterday, I have posted on MBSB's bullish breakout (go here). Now, it seems that a Abu Dhabi group is in discussion to buy a stake in MBSB. This was reported in the Star today (go here).
While this may sound like a good news, I believe that traders would probably take profit rather than wait for the outcome of the discussion. You may want to do the same. From the chart, you can see that the immediate resistance is about RM1.40 & thereafter RM1.50.
Tuesday, April 15, 2008
HUAAN should benefit from strong demand for steel
Background
Sino Hua-An International Bhd ('HUAAN') is involved in the production of metallurgical coke and related by-products. Coke is used as the main fuel in iron-making blast furnaces (for more on Coke [Fuel], go here).
HUAAN assumed the listing status of Antah Holdings Bhd after the completion of the restructuring scheme. HUAAN's production facilities are located in China and it is the only Chinese-owned company listed on our exchange.
With strong demand seen in the steel sector, HUAAN has proposed to increase its production facilities by 50% from 900,000 tonne to 1.5 million tonnne. The increased production facilities should be ready by middle of this year.
Financial Results
HUANN's net profit for the past 4 quarter amounted to RM127.5 million, representing an increase of 10.9% over the net profit of the preceding 4 quarters totaling RM115.0 million. During the same periods, turnover has increased by 16.7% from RM730.7 million to RM852.7 million.
For FY2008, HUAAN expects its turnover to touch RM1.0 billion when the additional production of 600,000 tonne is ready in mid-2008. On pro rata basis, its net profit might increase to RM160 million. This means HUAAN may earn 14 sen per share. Based on this, HUAAN is trading at a forward PE of 4.3 times.
Technical Outlook
From both the daily & weekly charts, we can see that HUAAN is poised to break to the upside of the short-term downtrend as well as the medium-term downtrend. By 4.30 pm, HUAAN has gained 4 sen to reach RM0.64- breaking above the short-term downtrend line resistance at RM0.62 level. The volume is still small at 1.7 million units traded.
Chart 1: HUAAN's daily chart as at April 14, 2008 (courtesy of Quickcharts)
Chart 2: HUAAN's weekly chart as at April 14, 2008 (courtesy of Quickcharts)
Conclusion
Based on buoyant demand from the steel sector, HUAAN's financial performance is likely to improve. Technically speaking, the stock may have broken above its downtrend line. Thus, HUAAN could be a safe & promising BUY for the medium-term.
Evergreen may have broken above its downtrend line
Evergreen has been dropping since making a recent high of RM2.07 on October 5th to hit a recent low of RM1.21 on March 10th. Its all-time high was RM2.16, achieved in May last year.
In the past few weeks, Evergreen has been range-bound between RM1.25 and RM1.35. Today, it appears that it has broken above the downtrend line at RM1.30. This should confirm the end of Evergreen's downtrend. If it can break above the RM1.35 level, the stock's recovery could commence. As at 3.05 pm, the stock was trading at RM1.32.
Chart: Evergreen's daily chart as at April 14, 2008 (courtesy of Quickcharts)
For more on Evergreen, please go here.
MBSB has a bullish breakout
MBSB has broken above its ascending triangle (ABC) at the RM1.05 level as well as its medium-term downtrend line at the RM1.12 level (see Chart 1 below). This breakout was further confirmed today, with the share price surging 17 sen to RM1.30 on volume of 2.6 million units done as at 10.00 am.
Chart 1: MBSB' daily chart as at April 14, 2008 (courtesy of Quickcharts)
Interestingly, the stock occupying the top volume spot is RCECap, which gained 3.5 sen to RM0.635, on volume of 3.8 million units done as at 10.00 am. These 2 stocks were rumored to be involved in some corporate exercises a few months back. From Chart 2 below, we can see that RCECap has also broken above its short-term downtrend line at the RM0.55 level as well as a horizontal resistance at RM0.57 level.
Chart 2: RCECap' daily chart as at April 14, 2008 (courtesy of Quickcharts)
Is the corporate exercise involving these 2 stocks about to be announced? Based on the bullish breakout, these 2 stocks (especially, MBSB) could be a good trading BUY. As MBSB has run up quite a bit, you may like to buy after the share price has pulled back.
Note: MBSB reported a net profit of RM53.2 million on a turnover of RM358.8 million for FYE31/12/2007. RCECap reported a net profit of RM38.0 million on a turnover of RM95.8 million for 9-month ended 31/12/2007. MBSB's full year EPS & RCECap's 9-m EPS stood at 15.43 sen and 5.87 sen, respectively.
PBBank's net profit jumped in 1Q2008
PBBank has just announced its results for its 1Q2008 ended 31/3/2008. Its net profit increased by 23.7% q-o-q or 50.6% y-o-y to RM717.4 million, while its revenue increased by 2.4% q-o-q or 19.3% y-o-y to RM2.64 billion. The improved performance was attributable to:
PBBank (closed at RM10.90) is now trading at a trailing PE of 15.4 times. At this PE, PBBank may appear fairly valued. However, the management has been able to grow the bank's operation very well in the past, and we can expect the same to continue.
Chart: PBBank's weekly chart as at April 14, 2008 (courtesy of Quickcharts)
Based on continued growth in its bottomline, PBBank remained an attractive bank stock. As observed in my previous post, I believe that PBBank's upside appreciation may be limited. However, the stock has a very good dividend track record. In FY2007, it paid dividend totaling 65%, while in FY2006, it paid dividend totaling 50%. Assuming it maintains its dividend at 65% for FY2008, the dividend yield will be 6.0%.
- increase in Interest Income of 15% (while interest margin remained at 44%); and
- increase in Other Operating Income of 93% vis-a-vis a 16%-increase in Other Operating Expenses.
PBBank (closed at RM10.90) is now trading at a trailing PE of 15.4 times. At this PE, PBBank may appear fairly valued. However, the management has been able to grow the bank's operation very well in the past, and we can expect the same to continue.
Chart: PBBank's weekly chart as at April 14, 2008 (courtesy of Quickcharts)
Based on continued growth in its bottomline, PBBank remained an attractive bank stock. As observed in my previous post, I believe that PBBank's upside appreciation may be limited. However, the stock has a very good dividend track record. In FY2007, it paid dividend totaling 65%, while in FY2006, it paid dividend totaling 50%. Assuming it maintains its dividend at 65% for FY2008, the dividend yield will be 6.0%.
Friday, April 11, 2008
Technical Outlook of equity markets in developed nations
I have summarized the technical outlook of the stock markets of developed nations in the table below. Basically, all these markets should be in a consolidating mode for the next few weeks (maybe, a few months), since the 200-day Simple Moving Average (SMA) of all these indices have hooked down. With some indices' 50-day SMA beginning to hook up (or, poised to do so) as well as some indices breaking above their accelerated downtrend line, there is a good chance that these markets are in the 'bottoming' phase. The most likely scenario is that these markets would move sideway. Their upside might be capped by strong horizontal resistance, which none had surpassed yet. In fact, some had tested these strong horizontal resistance & fell back.
Chart 1: DJIA's daily chart up to April 10th (from Yahoo Finance)
Chart 2: IXIC's daily chart up to April 10th (from Yahoo Finance)
Chart 3: N225's daily chart up to April 10th (from Yahoo Finance)
Chart 4: AORD's daily chart up to April 10th (from Yahoo Finance)
Chart 5: FTSE's daily chart up to April 10th (from Yahoo Finance)
Chart 6: GDAX's daily chart up to April 10th (from Yahoo Finance)
Chart 7: FCHI's daily chart up to April 10th (from Yahoo Finance)
Subscribe to:
Posts (Atom)