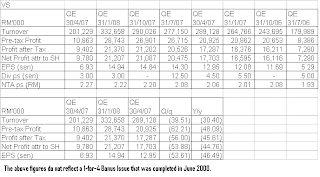
VS has just announced its results for 3Q2008 ending 30/4/2008, where its net profit dropped by 53.9% q-o-q or 44.8% y-o-y to RM9.8 million. Its turnover had similarly dropped by 39.5% q-o-q or 30.4% y-o-y to RM201 million. The company attributed the poor performance to lower sale volume to key customers during the quarter.
VS' main customer is Dyson- a producer of vacuum cleaners- has outsourced the manufacturing of its products to VS & a Singapore-based company, Meiban Group Ltd. It is likely that VS' reduced turnover was due to a sharp contraction of its sale to Dyson. This highlights the risk whenever a company is too dependent on one or a few customers for the bulk of its turnover.
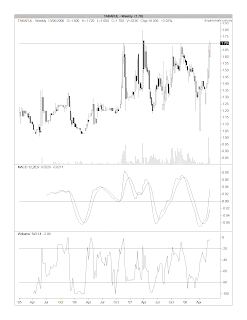
From the chart, we can see that VS share price is slowly breaking below its immediate accelerated uptrend line support at RM2.25-30. The next support would be the psychological RM2.00 level & thereafter its long-term uptrend line support at RM1.70-80.
Chart: VS' weekly chart as at June 26th (source: Quickcharts)
Since the immediate uptrend line has been violated & the latest quarterly results was very disappointing, it is safer to wait for the next quarterly results before making any decision on this stock.
This is a personal weblog, reflecting my personal views and not the views of anyone or any organization, which I may be affiliated to. All information provided here, including recommendations (if any), should be treated for informational purposes only. The author should not be held liable for any informational errors, incompleteness, or delays, or for any actions taken in reliance on information contained herein.
Friday, June 27, 2008
Thursday, June 26, 2008
SPSetia broke its immediate uptrend line
SPSetia has just broken below its immediate uptrend line support at RM3.20-30. The next support is the horizontal line as well as psychological support of RM3.00. The RM3.00 support level should provide a respite from the sharp selldown but, if it were violated, the stock could test its long-term uptrend line support at RM2.70.
Chart 1: SPSetia's weekly chart as at June 26th (source: Quickcharts)
Chart 2: SPSetia's monthly chart as at June 26th (source: Quickcharts)
Chart 1: SPSetia's weekly chart as at June 26th (source: Quickcharts)
Chart 2: SPSetia's monthly chart as at June 26th (source: Quickcharts)
Hiaptek's net profit soared
Hiaptek has announced its results for 3Q2008 ending 30/4/2008. Its net profit increased by 101% q-o-q or 180% y-o-y to RM46.0 million while its turnover increased by 3.6% q-o-q or 32.8% y-o-y to RM446 million. The improved performance was attributable to higher business volume to strong market demand coupled with the increase in steel prices. The company expects its profit margins to soften because its input cost is catching up with the selling price of its products. Going forward, the company's manufacturing division is likely to benefit from its American Petroleum Institute (API) monogram certification and the CE mark (a mandatory conformity mark on products aimed at Europe), coupled with the global shortage for steel pipes.
A recent report from OSK Research reiterated its buy recommendation on Hiaptek at RM1.60 but lowered its 12-month target price to RM2.84 due to market uncertainty, adding that the fair value was derived from the latest 10 times steel sector price earnings ration on CY08 numbers (go here).
Chartwise, Hiaptek's uptrend is still intact, with uptrend line support at RM1.50-55.
Chart: Hiaptek's weekly chart as at June 26th (source: Quickcharts)
Based on improved performance & nice technical picture, Hiaptek could be a good investment for the medium-term.
Friday, June 20, 2008
A funny look at Recession, Inflation & Interest Rate
YTLPower-WB, an attractive alternative entry to YTLPower
In the current market correction, you can find quite a number of bluechip stocks that had corrected back to their long-term uptrend line (as well as some that had broken below their uptrend line). One such stock that is at its uptrend line is YTLPower (see Chart 1 below). Of course, there are concerns regarding this stock. Among these concerns are possible adjustment to the charges payable by Tenaga to IPPs; proposed tax to be levied on IPPs for excessive profit; and possible rise in interest regime (thus, a higher rate for calculating the discounted cashflow, which will give rise to a lower value for the stock). Nevertheless, if the long-term uptrend line is not violated at the RM2.00 level, there is a chance that the stock may stage a rebound from here.
Chart 1: YTLPower's monthly chart as at June 19th (source: Quickcharts)
A cheaper entry into this stock is its newly-listed warrant, YTLPower-WB. This new warrant has a 10-year tenor (expiring on 6th November 2018); exercise price of RM1.25; and exercise ratio of 1-for-1. At yesterday's prices, YTLPower-WB (closed at RM0.685) is trading at a discount of 3.7%. YTLPower closed at RM2.01 yesterday.
YTLPower-WB looks more attractive than the older YTLPower-WA, which has a short tenor (expiring on 8th January 2010) but lower exercise price of RM1.20 (or, RM1.22 after 11th January 2009) and a similar exercise ratio of 1-for-1. At yesterday's prices, YTLPower-WA (closed at RM0.74) is trading at a discount of 3.5%. With nearly the same discount but a longer duration to expiry, YTLPower-WB would be preferred over YTLPower-WA. In addition, one can see that YTLPower-WA's long-term uptrend line support of RM0.78-80 has been violated (see Chart 2 below).
Chart 2: YTLPower-WA's monthly chart as at June 19th (source: Quickcharts)
Based on the above, YTLPower-WB could be a good indirect entry to YTLPower, provided that the underlying share price does not violate its long-term uptrend line support of RM2.00.
Wednesday, June 18, 2008
No-confidence motion to be tabled against Badawi
Sabah Progressive Party (SAPP)- a small political party from Sabah- today announced that it would propose a no-confidence motion against Prime Minister Abdullah Ahmad Badawi, when Parliament resumes on Monday. If my memory served me correctly, the leaders of SAPP led a defection in 1994/95 which culminated to the collapse of the Parti Bersatu Sabah ['PBS'] State Government in Sabah. The leaders of SAPP (then, members of PBS) had opted out of PBS to form SAPP, which later joined Barisan Nasional. It will be a real irony if the present Federal Government under Barisan Nasional were to be toppled by its converted comrades, proving once again that there is no permanent enemy or friend when it comes to politic.
While this political maneuvering will certainly be a negative for the stock market, I believe that it will likely be a short-term affair. The market will likely to benefit from more certainties in our political sphere, and this will be forthcoming after the no-confidence motion- irrespective of whether the motion is carried or not. Meanwhile, we will have to wait & see how the motion is played out. This is indeed a very exciting time.
Tuesday, June 17, 2008
Prices of timber products eased off their April high
Except for Particleboard & Medium-density Fibreboard, the prices of most timber products had eased off from their recent high. Despite the differing background, none of the timber products players were spared in the current correction in the stock market. Their share price had all declining and, surprisingly, one of the worst hit was Evergreen, the biggest producer of fibreboard in Malaysia.
Friday, June 13, 2008
Shanghai broke its 3000 psychological support today
Today, the Shanghai Stock Exchange Composite Index ('SSECI') & the Shenzhen A index broke below their April 22nd low. The SSECI traded at 2869 as at 10.30 pm ET while the Shenzhen A closed at 896 for today. The April 22nd low for SSECI & Shenzhen A index were 3000 & 912, respectively. The indices begun to slide this week after China's central bank ordered lenders on June 7th to set aside more money as reserve, the fifth such move this year. The reserve-requirement ratio would be raised by 0.5 percentage points on June 15, and another 0.5 percentage points on June 25.
I have attached the daily & weekly charts for SSECI for your easy reference. You can see that the next support for that index is at 2600.
Chart 1: SSECI's daily chart up to April 22nd (source: Stockcharts.com)
Chart 2: SSECI's weekly chart up to April 22nd (source: Stockcharts.com)
For the chart of Shenzen A index, go here. You may like to check out my April post on the outlook for SSECI (here).
Thursday, June 12, 2008
Resorts broke below RM3.00 psychological support
Resorts reported its results for 1Q2008 ending 31/3/2008 on May 28th. Its net profit dropped 13.6% q-o-q to RM297.4 million on the back of a 4.3%-decline in turnover to RM1.091 billion. The lower net profit is attributable to lower visitors' arrival to Genting Highlands Resort. When compared to the same quarter last year, its net profit increased by 25.1% on a 2.6%-increase in turnover. The main reason for the sharply higher net profit was because Resorts did not have to account for the results of Star Cruises since 31/7/2007. Resorts' share of loss in Star Cruises amounted to RM94.0 million for 1Q2007.
Resorts has been drifting lower since making a high of RM3.60 in July 2007. It should have good supports at horizontal line of RM2.80 & its immediate uptrend line at RM2.50. Subsequent horizontal line support will be at RM2.40 & the long-term uptrend line support will be at RM2.00.
Chart: Resorts' monthly chart as at June 11th (source: Quickcharts)
Resorts could be a good investment for the long-term. Unfortunately, even good stocks are indiscriminately sold off in a weak market. Further slide in Resorts' share price could present good opportunity to gather entry into this stock at attractive prices.
Genting broke its uptrend line
Genting reported its results for 1Q2008 ending 31/3/2008 on May 29th. The net profit declined 14.6% q-o-q or 33.1% y-o-y to RM439.4 million. Turnover of RM2.164 billion was 6.6% higher than the same quarter last year, but 3.8% lower than the immediately preceding quarter.
The 33.1%-drop in net profit, when compared to the same quarter last year, was attributable to one-off gain recorded previously, such as the RM510.7 million net gain arising from the dilution of its shareholdings in Resorts World and Genting International PLC as well as a gain on dilution of RM63.2 million arising from Resorts World's investment in Star Cruises.
The 14.6%-drop in net profit, when compared to the immediately preceding quarter, was attributable to lower profits from the Leisure & Hospitality Division (due to lower visitors arrival in Genting Highlands Resort & its UK casinos) as well as the Plantation Division (due to lower FFB production).
Genting expects its results for the rest of its current financial year to be satisfactory due to anticipated increase in visitors to Genting Highlands Resort (in line with the Visit Malaysia Year promotion) as well as positive contribution from its Plantation Division. In its opinion, these should offset any negative impact from its Power Division (due to higher fuel prices) & continued weakness in its UK casino operation.
Technically speaking, Genting has broken below its immediate uptrend line support of RM6.15 about 4 weeks ago (see the weekly chart, Chart 1). The next supports are at RM5.20 (horizontal support) & RM4.50 (long-term uptrend line support) [see the monthly chart, Chart 2].
Chart 1: Genting's weekly chart as at June 11th (source: Quickcharts)
Chart 2: Genting's monthly chart as at June 11th (source: Quickcharts)
While Genting's long-term uptrend line is still intact, its poorer results coupled with weaknesses in the equity market (due to both local & international factors) could lead to further downside for the share price. It is safer to let the stock test its next few support levels (especially the long-term uptrend line support of RM4.50) & to recover from it, before investing in this stock.
Tuesday, June 10, 2008
Takaful may have a bullish breakout
Background
Syarikat Takaful Malaysia Bhd ('Takaful') is involved in the provision of Islamic insurance products & services. It operates mainly in Malaysia, with a small presnece in Indonesia. Its Indonesian operation accounts for only 13% of its turnover.
Recent Financial Results
Takaful's financial performance is profitable, but fairly erratic. For 3Q2008 ending 31/3/2008 it reported a net profit of RM7.1 million of a turnover of RM281 million. This compared favorably to a net loss of RM3.6 million incurred in QE31/12/2007 on a turnover of RM200 million. The loss was attributable to a write-off of a loan granted to a subsidiary, ASEAN Retakaful International (L) Ltd of RM10 million.
Valuation
Based on yesterday's price of RM1.70, Takaful is now trading at a PE of 11.8 times (based on last 4 quarters' EPS totaling 14.7 sen (including the above-mentioned RM10 million write-off) or 8.1 times (if the write-off is excluded). Its P/Book is about 0.9 times (based on NTA per share of RM1.95 as at 31/3/2008). At these multiples, Takaful is fairly attractive.
The true value of Takaful is its takaful licence. These licences are valuable in Malaysia, as Bank Negara has issued only eight licences to takaful operators. As per a recent article in the Edgedaily (go here):
Technical Outlook
Based on the weekly chart below, we can see that Takaful had just surpassed its strong RM1.70 resistance yesterday. Today, it has even surpassed its March 2007 high of RM1.80. While the volume is still relatively thin, I believe that this could be a genuine breakout & the stock could soon test the RM2.00 level. If the RM2.00 level were taken out, then the stock could shoot for the RM2.40 level. [As at the close of the morning session, Takaful was trading at RM1.84.]
Chart 1: Takaful's weekly chart as at June 9th (source: Quickcharts)
Chart 2: Takaful's monthly chart as at June 9th (source: Quickcharts)
Conclusion
Based on cheap valuation & possible technical breakout, Takaful could be a good stock to short to medium-term investment.
Syarikat Takaful Malaysia Bhd ('Takaful') is involved in the provision of Islamic insurance products & services. It operates mainly in Malaysia, with a small presnece in Indonesia. Its Indonesian operation accounts for only 13% of its turnover.
Recent Financial Results
Takaful's financial performance is profitable, but fairly erratic. For 3Q2008 ending 31/3/2008 it reported a net profit of RM7.1 million of a turnover of RM281 million. This compared favorably to a net loss of RM3.6 million incurred in QE31/12/2007 on a turnover of RM200 million. The loss was attributable to a write-off of a loan granted to a subsidiary, ASEAN Retakaful International (L) Ltd of RM10 million.
Valuation
Based on yesterday's price of RM1.70, Takaful is now trading at a PE of 11.8 times (based on last 4 quarters' EPS totaling 14.7 sen (including the above-mentioned RM10 million write-off) or 8.1 times (if the write-off is excluded). Its P/Book is about 0.9 times (based on NTA per share of RM1.95 as at 31/3/2008). At these multiples, Takaful is fairly attractive.
The true value of Takaful is its takaful licence. These licences are valuable in Malaysia, as Bank Negara has issued only eight licences to takaful operators. As per a recent article in the Edgedaily (go here):
As of end-June 2007, the total assets of the takaful industry were worth RM7.6 billion, representing 6.3% of the asset size of the larger insurance industry in the country. It is learnt that the central bank has no intentions to grant new takaful licences to insurance operators for the moment, which in turn would enable those that have these licences to capture a large market share in the industry. With no new takaful licences in sight, insurance operators who are keen on establishing takaful operations would have to either acquire stakes from operators that have these licences or merge their operations. However, it is not easy to find an insurance operator who is willing to share its takaful businesses with other players in the industry, given the bright prospects and lucrative returns that takaful services are capable of providing.
Technical Outlook
Based on the weekly chart below, we can see that Takaful had just surpassed its strong RM1.70 resistance yesterday. Today, it has even surpassed its March 2007 high of RM1.80. While the volume is still relatively thin, I believe that this could be a genuine breakout & the stock could soon test the RM2.00 level. If the RM2.00 level were taken out, then the stock could shoot for the RM2.40 level. [As at the close of the morning session, Takaful was trading at RM1.84.]
Chart 1: Takaful's weekly chart as at June 9th (source: Quickcharts)
Chart 2: Takaful's monthly chart as at June 9th (source: Quickcharts)
Conclusion
Based on cheap valuation & possible technical breakout, Takaful could be a good stock to short to medium-term investment.
Monday, June 09, 2008
Market Outlook as at June 6th
Since my comment on May 29th (go here), the market has turned down quite sharply. The big jump in the price of petrol & diesel and the increase in the tariff rates for Tenaga would add to the inflationary pressure confronting consumers. As noted in the May 29th post, the short-term downtrend has commenced (notwithstanding the other comment about the school holiday effects on the market).
From Chart 1 below, we can see that the KLCI dropped as much as 39 points to hit an intra-day low of 1214 on Thursday (June 5th) before recovering partially to close at 1224. The recovery was given a big boost on Friday (June 6th), when Tenaga was re-quoted & rose RM1.70 to close at RM9.00. So, the supports for the KLCI are the horizontal supports at 1214-16 and the psychological support of 1200. A break of the 1200 level could see the KLCI testing its recent March lows of 1157-66.
Chart 1: KLCI's daily chart as at June 6th (source: Quickcharts)
Equity markets worldwide are facing strong headwinds from high crude oil prices & renewed fear that the credit crunch might not be over. We can see below the exponential rise in the price of crude oil is showing no sign of weakening while the Philadelphia Banking Index ('BKX') had finally broken below its strong support of 75 level, signaling another round of selldown for financial stocks.
Chart 2: BKX's daily chart as at June 6th (source: Stockcharts.com)
Chart 3: WTIC's daily chart as at June 6th (source: Stockcharts.com)
Based on the strong headwinds & the bearish outlook for the KLCI, it is advisable to stay on the sideline for a while.
Friday, June 06, 2008
Tenaga rebounding strongly
Tenaga has finally gotten its tariff revision. This revision is however intended to offset the gas price hike. As such, the impact will be very marginally and one should use the strong rebound to take profit or trim his position in this stock.
From the chart below, we can see that Tenaga is likely to face strong resistance at RM8.50-60 level (from horizontal line as well as the immediate downtrend line) & the next resistance will be at RM10.00 (from horizontal line and the next downtrend line). Given the poor sentiment, I think one should aim to sell at the RM8.50-60 level. As at 9.30 am, Tenaga is trading at RM8.25-30 level, off its high of RM8.70 as at 9.09 am).
Chart: Tenaga's daily chart as at June 5th, 2008 (source: Quickcharts)
Subscribe to:
Posts (Atom)