Tuesday, May 26, 2020

BAT: Sales Dropped Sharply due to MCO Disruption

Result Update

For QE31/3/2020, BAT's net profit dropped 46% q-o-q or 43% y-o-y to RM51 million while revenue dropped by 27% q-o-q or 23% y-o-y to RM481 million.

The sharp drop in revenue was attributed to disruption from the Movement Control Order (MCO) in the last two weeks of quarter one, which caused consumers to turn to cheap, black market cigarettes. Operating expenses were marginally lower due to improvement in operational efficiencies but this was not enough to offset revenue loss, resulting in a decline of 48% q-o-q or 41% y-o-y  in profit from operations to RM71 million. 


Table: BAT's last 8 quarterly results


Graph: BAT's last 53 quarterly results

Valuation

BAT (closed at RM11.72 last Friday) is now trading at a PER of 10.9 times (based on the last 4 quarters' EPS of 107.8 sen). BAT has paid out quarterly dividend payment totaling of 105 sen over the past 4 quarters; thus giving a Dividend Yield of 9.0%. Though its valuation looks attractive, the concern for many investors is whether BAT can stop the continuous decline in both revenue and profits, since the MCO period covers the whole of the next quarter. Only time will tell.

Technical Outlook

BAT broke below its medium-term uptrend line, SS at RM12.60. It may slide to the horizontal line at RM11.00.


Chart: BAT's daily chart as at May 22, 2020 (Source: Malaysiastock.biz)

Conclusion

Based on a weak financial performance and a bearish technical outlook, BAT may be a contrarian stock for long-term investment. All the negative factors could be substantially factored in the share price which is trading at a PER of 10.9 times and a dividend yield of 9.0%.

Note:
I hereby confirm that I do not have any direct interest in the security or securities mentioned in this post. However, I could have an indirect interest in the security or securities mentioned as some of my clients may have an interest in the acquisition or disposal of the aforementioned security or securities. As investor, you should fully research any security before making an investment decision.

Sunday, May 24, 2020

Selamat Hari Raya Aidilfitri

I wish all my readers a safe and blessed Hari Raya Aidilfitri.


Thursday, May 21, 2020

Glove Stocks' Stunning Rally

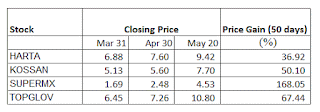
Over the past 1 month, glove stocks' prices have rallied spectacularly. The top 4 glove makers have risen between 37 and 168% since end of March.

Table 1: Glove stocks' price gain over last 50 days

The rise is so sharp that the top producers are now trading at PER of 44 to 71 times. If that is not enough, analysts are falling over one another to upgrade their target prices, giving each stock even higher target price.

Table 2: Glove stocks' valuation by Kenanga

This afternoon, one of my clients sent me a table of the market capitalization of our banking stocks and  the top 4 glove makers. It is indeed a surprise to see Harta and Topglov commanding market cap comparable to HLBANK and RHBBANK. 

Table 3: Banking and glove stocks' market cap & valuation compared 

When will the rally in glove stocks peak? I used an unorthodox approach in determining the potential peak for glove stocks by looking at the unadjusted price charts of Harta, Topglov and Kossan. 

All these 3 stocks have consistently been giving out 1-for-1 bonus issue (1-to-2 share split is very similar to a 1-to-1 bonus) over the past 10 years. If you looked at the unadjusted price charts, each of these stocks had subsequently rallied back to their respective unadjusted prior peaks- which effectively means that their share prices have doubled up during that period. There were only one occasion when Harta and Kossan's rallies had exceeded their prior peaks- in 2018 and 2016 respectively. Today, Topglov and Kossan share prices are very close to their prior peaks. Harta share price has another RM2.00  to go to reach its prior peak.


Chart 1: Harta's monthly chart as at May 21, 2020_11.00am (Source: Malaysiastock.biz)

Chart 2: Kossan's monthly chart as at May 21, 2020_11.00am (Source: Malaysiastock.biz)


Chart 3: Topglov's monthly chart as at May 21, 2020_11.00am (Source: Malaysiastock.biz)

I have left out Supermx because it had not been consistently giving out bonus shares. It may be an outlier in this pact.


Chart 4: Supermx's monthly chart as at May 21, 2020_11.00am (Source: Malaysiastock.biz)

In my opinion, the potential upside for the top 4 glove stocks is now fairly limited. It is advisable to take some profit on these stocks after the strong rally, notwithstanding the analysts' very favorable rating and extremely high price target.

Market Outlook as at May 21, 2020

The market has been on the roll in the past 6 days. Volume has increased substantially above 7 billion units traded a day. In fact, there were 3 days of 9 billion units traded (on May 13, 15 & 19) and there was one day of 11 billion units done (on May 18). While the play has been concentrated in the 2nd and 3rd liner stock, even the blue chip stocks have seen a pick-up in volume as well as price gain.

 Yesterday, FBMKLCI surpassed the recent intra-day high of 1429 recorded on April 20. With MACD starting to climb up, after entering the positive territory in late April, and ADX beginning to turn up, though still below the 25 mark, we may be seeing another upleg in this rally. If FBMKLCI can break above the 100-day SMA line at 1455, it has a clear path to the test of the psychological 1500 mark as well as the 200-day SMA line at 1520 in the next 1-2 weeks. Bear in mind that the long-term downtrend line, RR will pose a resistance at 1550.

Chart 1: FBMKLCI's daily chart as at May 20, 2020 (Source: Malaysiastock.biz)

Chart 2: FBM70, FBMSCAP, FBMFLG & FBMACE's daily charts as at May 20, 2020 (Source: Kenanga's BTX chart)

The big question in every investors' mind now is whether the bear market is over. The quick answer is a NO. I have to refer you back to my post in March where I compared the current downturn to what we had in the Asian Financial Crisis in 1998 as well as the Global Financial Crisis in 2008 (here).

In that post, I lay down the set-up for the start of market uptrends, as witnessed in November 1998 (the numbers are in blue) and March 2009 (see the numbers in green) are:
    1. Index rose above both 10 & 20-week SMA lines
    2. MACD crossed above the MACD signal line
    3. Stochastic RSI was above 80 (or, in oversold territory)
    4. +DMI crossed above -DMI and continued to diverge
The current rally is still developing (see the numbers in black) with conditions (2) and (3) met while conditions (1) and (4) are still pending. We can refer to the failed market recovery in June 1998 which didn't meet condition (4) as well as not fully satisfy condition (1) i.e. unable to cross above the 40-week SMA line. 

Chart 3: FBMKLCI's weekly chart for 1997-1999, 2007-2009 and 2018-2020 (Source: Malaysiastock.biz)

However, we may be getting ahead of ourselves- no thanks to 6 days of big volume! If we referred to the daily charts for 1998 and 2008, we can see that the 100-day SMA line capped the initial rally at points (A) and (B). Today we are again coming very close to the 100-day SMA line [approaching point (C) at 1455].

Chart 4: FBMKLCI's daily chart for 1997-1999, 2007-2009 and 2018-2020 (Source: Malaysiastock.biz)

In conclusion, our market's short-term target is the 100-day SMA line at 1455. An upside break out of the 100-day SMA line may see the index going up to the psychological 1500 mark as well as the 200-day SMA line at 1520 in the next 1-2 weeks. 

Some players believe that even if FBMKLCI were to falter, the play in our market will continue as retail players are all charged up to punt on 2nd and 3rd liner stocks. I am inclined to believe that the rally in lower liner stocks may continue if the FBMKLCI is still heading higher. Good luck to all in your trading & investing. As always, be careful out there.


Tuesday, May 19, 2020

Crude Oil Price Recovery May Start Soon

O&G stocks may rally next as WTIC & Brent crude oil prices have reversed. The reversal is achieved when they broke above the neckline of their respective inverted head and shoulders formation. See charts below.


Chart 1: WTIC's daily chart as at May 18, 2020 (Source: Stockcharts.com)


Chart 2: Brent's daily chart as at May 18, 2020 (Source: Stockcharts.com)

Among the lower line O&G stocks, we can see Velesto has broken above the line connecting the recent high at RM0.16, It may go to RM0.20 and, beyond that, to RM0.26.


Chart 3: Velesto's daily chart as at May 18, 2020 (Source: Malaysiastock.biz)

Armada has broken above the horizontal line at RM0.20. It will test the next horizontal lien at RM28 and, beyond that, to RM0.33.


Chart 4: Armada's daily chart as at May 18, 2020 (Source: Malaysiastock.biz)

For Sapnrg shareholders, you have to wait for Sapnrg to break above the slopping line at RM0.11.


Chart 5: SAPNRG's daily chart as at May 18, 2020 (Source: Malaysiastock.biz)

Since these stocks have not gone up too excessively, you can consider them for your trading purpose or medium-term investment. Good luck.

Friday, May 15, 2020

GPacket-WB: Why Is it trading at a discount

Yesterday, GPacket (now at RM1.24) broke above its February high of RM0.93. GPacket-WB (now at RM0.49) also broke above its February high of RM0.46 yesterday.


Chart 1: GPacket's daily chart as at May 15, 2020_10.30am (Source: Malaysiastock.biz)


Chart 2: GPacket-WB's daily chart as at May 15, 2020_10.30am (Source: Malaysiastock.biz)

The bullish breakout is probably due to the news concerning the partnership between GPacket's Kiplepay and Tencent Cloud to offer electronic know-your-customer service known as KipleID e-KYC targeting banks and other financial institutions. For more, go here.

On the surface, everything looks good since the news flow is positive and the technical outlook is bullish. However, there is a nagging issue of GPacket-WB trading at a discount of 28% since its exercise price is RM0.40 and there is also no concern about short tenor as its expiry date is on Nov 24, 2023. The warrant is trading at below its intrinsic value of the warrant is RM0.84!!

The dichotomy between both securities achieving new highs and the warrant trading at a discount is more than a bit perplexing. It is actually worrying. In the stock market, where every sen counts, arbitraging activities should have taken place, with shareholders selling off their shares (thus depressing the share price) and buying the warrants (thus pushing up the warrant price) for the purpose of converting to shares. Why isn't this taking place now?

In the past, we have seen similar development in other stocks & their underlying warrants, which were eventually resolved with both the share price and warrant price dropping back when the players exit abruptly. When will this happen to GPacket and GPacket-WB? No one knows but the market.

If you have GPacket or GPacket-WB, you should track it closely and take profit along the way. If you have both securities, the one to sell first should preferably be the share. Good luck!

Wednesday, May 13, 2020

What's the Rally in Glove Stocks Telling Us?

In the past few days, glove stocks have risen steadily. That steady ascent has gone exponential yesterday and today. The rally has also spilled over to stocks that would benefit from Covid-19, such as Ocncash (producer of non-woven material used in the production of face mask) etc. 

Covid-19 pandemic has created increased demand for gloves, which led to higher sales volume and higher average selling prices. The sharp and urgent rally in glove stocks seem to suggest that concern or fear of the pandemic has returned. Is this due to the opening up of the economies around the world, which is causing increased concern or fear of a spike in infection cases?

If you looked at the composite chart below- made up of FBMKLCI, Harta and Topglov- you would see 2 prior periods when the share prices of Harta and Topglov (our top 2 glove makers) rose while FBMKLCI weakened. In both of these periods, Harta and Topglov would eventually peak and roll over, while FBMKLCI would drop significantly. These periods are denoted as A and B, respectively. 


Chart: FBMKLCI, Harta and Topglove's daily chart from Sep 2019 to May 13, 2020 (Source: Kenanga's BTX chart)

This is my interpretation; when the fear of the pandemic started to rise, investors would buy into Harta and Topglov while selling off other stocks. This led to higher prices for Harta and Topglov while FBMKLCI weakened. When the fear of the pandemic overwhelmed investors' profit-seeking instinct, the sell-off would be broad-based - including a sell-off in glove stocks too.

If this interpretation is accurate, then we may be seeing a build-up of fear of the pandemic which has led to the current rally in glove stocks while FBMKLCI has been moving sideways. When will the fear of the pandemic overwhelm investors' profit-seeking instinct, leading to a sell-off in the market? Only time will tell.

For those who have glove stocks or stocks related to Covid-19, such as Ocncash, Hexza, HLT, it is advisable to take some profit in this super-charged environment. Good luck.

Tuesday, May 05, 2020

Covid-19: Every Dog Has His Days

In this period of Covid-19, glove manufacturers and companies that supply to the healthcare sector have rallied substantially. While the price rally for the well-run profitable glove manufacturers is justifiable, it is hard to make a case for the huge rally in smallish glove manufacturers and companies involved in the healthcare sector or supplying input to the production of masks or sanitizers. Below are some stocks that have been played up substantially, which we should avoid or, if you are fortunate to have bought earlier, you can consider taking profit.

Table 1: The Also-ran Shines

 Just look at how much they have rallied in last 2 weeks!

Chart 1: Carepls's monthly chart as at May 5, 2020_10.30am (Source: Malaysiastock.biz)

Chart 2: Comfort's monthly chart as at May 5, 2020_10.30am (Source: Malaysiastock.biz)


Chart 3: Ruberex's monthly chart as at May 5, 2020_10.30am (Source: Malaysiastock.biz)

 Chart 4: Hexza's monthly chart as at May 5, 2020_10.30am (Source: Malaysiastock.biz)

 Chart 5: LKL's daily chart as at May 5, 2020_10.30am (Source: Malaysiastock.biz)

If you want to have exposure to some stocks which may benefit from increased sales as a result fo Covid-19, I believe the bigger glove manufacturers are safer- though they are hardly cheap at this point of time. I prefer Kossan. See the table below.

Table 2: The Big Dogs

BAT: Rising from the Ashes

BAT share price has been dropping for so long that many investors have learned to avoid the stock. See the monthly chart below.

Chart 1: BAT's monthly chart as at May 4, 2020 (Source: Malaysiastock.biz)

The share price decline is brought on by the decline in revenue and profits. I have constructed a graph of BAT's rolling 4 quarters' revenue and profits, excluding lumpy restructuring expenses, from Dec 2007 up to Dec 2019.

Graph: BAT's rolling 4-quarter revenue and profit from Dec 2007 to Dec 2019

The latest quarterly results will be announced in 3 weeks' time. It will probably show further decline in revenue and profits. If that panned out, we can expect share prices, which have rallied from RM10 to RM13, may renew their decline. Why are investors buying into BAT shares now or in the near future?

The Investment Case for Buying BAT 

1) The share price has broken above the medium-term downtrend line, RR at RM12.00.


Chart 2: BAT's daily chart as at May 4, 2020 (Source: Malaysiastock.biz)

2) It is a well-managed multinational company. The downside is its products pose health risks which led to legal restrictions being imposed which curtailed its consumption.

3) BAT is trading at a fairly attractive valuation with PER at 10.9 times an dividend yield at 8.9%.

4) Due to poor enforcement, illegal cigarettes are widely available in Malaysia, and these compete very successfully against BAT's products as their selling prices are substantially lower. The result of this illegal trades is lower sales for cigarettes manufacturers, leading to plant shutdown and loss of employment. An example is BAT shutting down its main factory in Petaling Jaya, and moving its production to Indonesia. In addition, Malaysian government loses more than RM5 billion annually in term of duties/taxes collection due to the illegal trades (here).

In the Covid-19 environment where government income is sharply lower and employment opportunity is scare, a case can be made that the government will finally crack down on the illegal trades in cigarettes. This will lead to higher income flowing to the government coffers and greater employment opportunities for Malaysians. Consequently, we can expect increased sales and profits for the legal cigarette manufacturers such as BAT further down the road.

Conclusion

Based on technical and fundamental consideration, I believe BAT is a good stock for medium to long-term investment.

Note:

I hereby confirm that I do not have any direct interest in the security or securities mentioned in this post. However, I could have an indirect interest in the security or securities mentioned as some of my clients may have an interest in the acquisition or disposal of the aforementioned security or securities. As investor, you should fully research any security before making an investment decision.
Monday, May 04, 2020

US Market Outlook as at May 4, 2020

Over the weekend, we heard Trump administration is seemingly eager to restart the trade war in order to punish China for the Covid-19 pandemic. With the opinion polls showing Trump losing ground in many states which carried him over the line in 2016, Trump & the republican campaign will not let off this angle of attack anytime soon.

Whether the threat would be carried out or not, the rhetoric will be enough to cause havoc to global stock markets. Over the few days, we can expect stock markets worldwide to be volatile. This new fear could be just enough to tip the balance, causing the market to go into a sell-off. Be careful!!


Chart 1: DJIA's weekly chart as at May 1, 2020 (Source: Stockcharts.com)


Chart 2: S&P500's weekly chart as at May 1, 2020 (Source: Stockcharts.com)


Chart 3: Nasdaq's weekly chart as at May 1, 2020 (Source: Stockcharts.com)

Sunday, May 03, 2020

Market Outlook as at May 4, 2020

On April 30, FBMKLCI rose 27 points to 1408. On the following day, which was the Labor Day, the government announced the relaxation of the MCO to allow for the opening of many sectors of our economy on May 4. This is known as the Conditional MCO (here). 

However, there were many who spoke out against the relaxation of the existing MCO as the number of Covid-19 cases was still high. In fact, the number of cases reported today was 122. The DG of the Health Ministry has reminded the public that the MCO is not fully lifted yet (here). In addition, 6 states (Penang, Pahang, Kelantan, Kedah, Sabah and Sarawak) chose not to open up early as allowed by the Conditional MCO (here). How would the market react next week?

The unfinished business of controlling the spread of Covid-19 and the uncertainty surrounding the re-opening of the economy would create confusion in the market. This will likely lead to weaker market, which may follow by profit-taking activity. 

FBMKLCI has rebounded substantially off the low in late March. However the rally to-date is still rightly viewed as a bear market rally, as the MACD is still below the zero line, and, while the +DMI has crossed above the -DMI, it has not yet pulled away. 

Chart 1: FBMKLCI's daily chart as at April 30, 2020 (Source: Malaysiastock.biz)

As discussed in my earlier post, the start of the recovery in 1998 & 2008 were accompanied by the presence of the following conditions on the weekly charts:
    1. Index rose above both 10 & 20-week SMA lines
    2. MACD crossed above the MACD signal line
    3. Stochastic RSI was above 80 (or, in oversold territory)
    4. +DMI crossed above -DMI and continued to diverge
I have updated my earlier charts, and you can see that FBMKLCI has not yet met the above conditions.

Chart 2: FBMKLCI's weekly chart for 1997-1999, 2007-2009 and 2018-2020 (Source: Malaysiastock.biz)

The success of the MCO in flattening the curve is indeed laudable. Once the number of cases has been brought down to low double digit, the opening of the Malaysian economy would be a boost to our stock market. Whether that boost will lead to a strong recovery is still a question that's hard to answer. Covid-19 will probably be with us for the next 2 years and the ensuing economic contraction will likely be brutal on the stock market. I do not see how the market can rally higher under such challenging conditions.