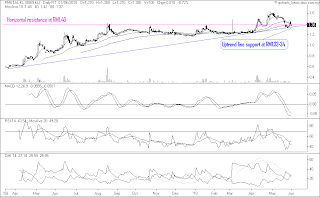
SSEC index dropped 108.22 or 4.27% to 2427.05 as at 3.01 am EDT. This means that SSEC index has just broken below the 'horizontal' support (S2-S2) at 2500. See Chart 1 below.
Chart 1: SSEC index's daily chart as at June 28, 2010 (Source: Stockcharts)
From Chart 2, we can see that today's sharp fall has also violated the Channel line support at 2450. The next support would be from the horizontal lines at 2400 & 2100.
Chart 2: SSEC index's daily chart as at June 28, 2010 (Source: Stockcharts)
The bearish breakdown in SSEC could be in reaction to the result of the G-20 meeting which seems to put more emphasis on fiscal tightening. This has disappointed many economists who think that the global economy recovery is too fragile for any significant withdrawal of economic stimulus. Paul Krugman wrote an interesting opinion piece entitled 'The Third Depression' recently on this topic.
In view of the role of SSEC index as a 'leading' index among equity markets- it was the first to recover in late 2008 & the first to peak in mid-2009- its bearish breakdown could be a warning of further downside for the equity market.
This is a personal weblog, reflecting my personal views and not the views of anyone or any organization, which I may be affiliated to. All information provided here, including recommendations (if any), should be treated for informational purposes only. The author should not be held liable for any informational errors, incompleteness, or delays, or for any actions taken in reliance on information contained herein.
Tuesday, June 29, 2010
Massive Rally after Bear Markets
Finance Trends Matter has a post about Massive Rally after Bear Markets. There are two points that you can take away from the post. Firstly, market can rally for a long period (1000 days or more) after a massive bear phase. Secondly, these rallies would encounter a period of correction approximately 250-450 trading days after the start of the rally. It so happens that we are about to enter this period where market weakness is expected. So, we must be careful not to be sucked into the current market weakness.
Chart: Rallies after Massive Bear Markets (Source: Chart of the Day)
For more, go to here or here.
Chart: Rallies after Massive Bear Markets (Source: Chart of the Day)
For more, go to here or here.
Monday, June 28, 2010
Haio- the slide continued...
Results Update
Haio has just announced its results for QE30/4/2010. Its net profit dropped by 21% q-o-q or 10% y-o-y to RM14.3 million while its turnover declined by 25% q-o-q or 26% y-o-y to RM99 million. The decline in both sales & net profit was attributable to lower recruitment of mew members due to more stringent rules in lines with new regulations set out by the government.The company hopes to overcome the decline in sales by increasing its range of health supplement & skincare products.
Table: Haio's 8 quarterly results
Chart 1: Haio's 21 quarterly results
Valuation
Haio (closed at RM4.12 last Friday) is now trading at a PER of 12 times (based on last 4 quarters' EPS of 35 sen). With declining top-line and bottom-line, Haio might even trade at single-digit PER until the situation stabilizes.
Technical Outlook
Haio is still in an uptrend. However, the negative crossover of the MACD is signaling further decline in Haio's share price. It may find support at the 50-day SMA line at RM3.35.
Chart 2: Haio's daily chart as at June 25, 2010 (Source: Tradesignum)
Conclusion
Based on the poor financial performance, I would rate Haio a SELL ON STRENGTH.
Global equity markets remained at a crossroad
Some time back, I mentioned that all the major stock markets have broken below their 200-day SMA line, which could be the start of the bear market for equity (here). Shortly thereafter, I also pointed out that a surer but slower indicator is the negative golden cross, i.e. the 50-day SMA crossing below the 20-day SMA line as a confirmation of a bear market (here). Back then, only 2 markets have seen a negative golden cross, i.e. Shanghai & Hong Kong stock markets.
Since then, some of the stock markets have rebounded above their 200-day SMA line (such as the Singapore & Seoul markets as well as our stock market) while more markets have experienced the negative golden cross. Below, we can see that 7 out of a total of 17 indexes have witnessed a negative golden cross while another 4 experienced a negative mini golden cross (where the 50-day SMA line crossed below the 100-day SMA line).
Table: Main market indices as at June 25, 2010 (Source: Stockcharts for all indexes, except FBM-KLCI where I rely on Tradesignum)
Based on signs of renewed weaknesses on the economic front as well as continued weaknesses noted in the equity markets, I believe that one should not be over-exposed to the stock market.
Signs of Economic Weaknesses surfaced
Recent reports of weaknesses in the US economy raised concern that the world economy could soften significantly in the later part of 2010 or early 2011. As noted by an article entitled "It;s more than just a scare" by Comstock Partners, the followings weaknesses are highlighted:
1. ISI's weekly company survey has been trending lower since peaking in April;
2. ISI retail survey dropped by 4.8% last week or 20% since the April peak;
3. Employment's survey dropped 3.1% last week or 7% from recent peak.
4. Homebuilders' survey at 4 months' low; and
5. Transportation survey declined in the past 4 weeks.
The above is consistent with the ECRI weekly leading indicators where the latest smooth growth rate is minus 5.7%, a level that had led to the last seven recession & was only wrong once. See the ECRI weekly index below.
Chart 1: ECRI index as at June 24, 2010 (Source: Rubbernet)
[Note: ECRI index is in blue. The red line is the Sicom TSR index.]
Another indicator which is closely watched by economists is the Aruoba-Diebold-Scotti real-time business conditions indicator maintained by the Philly Fed. We can see that this indicator is rolling over again.
Chart 2: Aruoba-Diebold-Scotti Business Conditions Index as at June 24, 2010 (Source: Philadelphia FED)
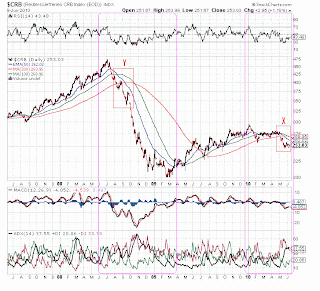
Finally, we can see that commodity prices as reflected by the CRB index is dropping, with a downtrend clearly formed. See Chart 3 below. In addition, we can see that BDI has also formed a downtrend. See Chart 4 below (Note the lower 'high' and lower 'low').
Chart 3: CRB index's daily chart as at June 24, 2010 (Source: Stockcharts)
Chart 4: BDI's daily chart as at June 24, 2010 (Source: Investment Tools)
Based on the weakness on the economic front, we must be cautious about putting too much money in the stock market.
Wednesday, June 23, 2010
MPHB has a bullish breakout
MPHB may have commenced on its next upleg with the upside breakout above the 'horizontal' resistance at RM2.06. See the 60-minute chart below.
Chart 1: MPHB's 60-minute chart as at June 23, 2010_11.00am (Source: Quickcharts)
Earlier, MOHB has broken above its short-term downtrend line at RM2.00-2.02 on June 16. Its next horizontal resistance is at RM2.13 & then at RM2.20.
Chart 2: MPHB's daily chart as at June 23, 2010_11.00am (Source: Quickcharts)
Based on the above, MPHB could be a good trading BUY.
Monday, June 21, 2010
Topglove's profit margin contracted in QE31/5/2010
Results Update
Topglove has recently released its results for QE31/5/2010, where its net profit increased by 53% y-o-y on the back of a 49%-increase in turnover. However, its net profit declined by 8.6% q-o-q despite a 9.0%-increase in turnover. The q-o-q decline in net profit was attributable to a 24%-increase in latex prices as well as a 3% weakening in USD. Topglove is optimistic that the drop in its bottom-line in QE31/5/2010 would be reversed in the next quarter as latex prices has eased off (by 7% as at 1/6/2010) and the USD has rebounded.
Table 1: Topglove's last 8 quarterly results
Chart 1: Topglove's 16 quarterly results
Chart 2: Topglove's 16 quarterly results
Valuation
Topglove (closed at RM12.92 last Friday) is now trading at a PER of 15 times (based on last 4 quarters' EPS of 86 sen). This multiple is reasonable if Topglove can maintain its earning growth going forward. Can it?
Technical Outlook
Topglove is still in an uptrend but it looks toppish. At this moment, the 10 & 20-week SMA lines are still above the 40-week SMA line. As such, Topglove is rated a HOLD.
Chart 3: Topglove's weekly chart as at June 18, 2010 (Source: Tradesignum)
Conclusion
The drop in Topglove's profit margin could be a sign of tougher times ahead for rubber glove makers. However, the stock is still rated a HOLD as the technical outlook is still positive, albeit a bit toppish.
Integra has a bullish breakout
It's good to be back! The first stock to look at is Integra.
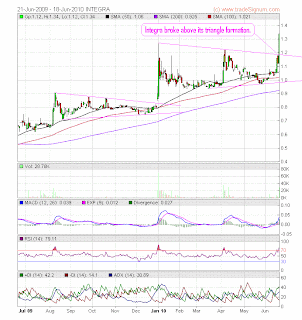
Integra had a bullish breakout of its triangle formation at RM1.18-20 last Friday (see Chart 1). It also broke above its long-term downtrend line at RM1.25 (see Chart 2). This double bullish breakout could be due to a fight between the two Rasip brothers (Harun & Amin) for control. The fight is not a straightforward affair as Harun & Amin jointly owned Halim Rasip Holdings Sdn Bhd which in turn owned 33% of Integra. This is likely to be similar to the tussle in Tan Chong Consolidated (for control of the listed vehicle, Tan Chong) or Kian Joo Holdings Sdn Bhd (for control of the listed vehicle, Kian Joo). It can be a long drawn-out affair with no clear winner. I think the best approach is to confine our analysis based on technical consideration. With that in mind, the first target to take profit is RM1.50-1.60, if one already owned the share. If you want to get into the stock, you can try at RM1.18-1.25. Good luck.
Chart 1: Integra's daily chart as at June 18, 2010 (Source: Tradesignum)
Chart 2: Integra's weekly chart as at June 18, 2010 (Source: Tradesignum)
Wednesday, June 16, 2010
Brief Hiatus
I will be on leave for the next few days & won't be posting anything for the rest of the week.
Thursday, June 10, 2010
Will Europe do a Lehman Bro?
Over the past 3 days, I posted 3 trading BUYs- Haio, IRCB & LBS. These are trading ideas that I felt comfortable with, though on the whole I am not too comfortable with the market.
Let's look at the charts of MSCI EAFE & MSCI World indexes (Chart 1 & 2). The MSCI EAFE Index is a stock market index that is designed to measure the equity market performance of developed markets (Europe, Australasia, Far East), excluding the US & Canada. The MSCI World Index is a stock market index of 1500 'world' stocks and it is often used as a common benchmark for 'world' or 'global' stock funds.
We can see that the 50-day Exponential Moving Average ('EMA') has crossed below the 100-day & 200-day Simple Moving Average ('SMA'). This is denoted as 'X' on Chart 1 & 2 below. We can see that a similar cross-under happened in early 2008 but the market managed to rebound back in April & May 2008 before the sharp selldown kicked in one month later, in June. The whole chain of events in 2008 is denoted as 'Y'. In the current cross-under, some are hopeful that a rebound would come shortly before a selldown set in. While many things can happen over the next few weeks or months, it's better & safer to accept that the current cross-under has signaled the end of the bull market & possibly the beginning of the bear market.
Chart 1: MSWorld's daily chart as at June 9, 2010 (Source: Stockcharts)
Chart 2: MSEAFE's daily chart as at June 9, 2010 (Source: Stockcharts)
The other charts that may provide some guidance to the state of the market or economy is the CRB & WTIC indexes. From Chart 3 & 4 below, we can see that the 50-day Exponential Moving Average ('EMA') has crossed below the 100-day & 200-day Simple Moving Average ('SMA'). This is denoted as 'X' on the chart. The last time we saw a similar cross-under was in August/September 2008 [denoted as 'Y'].
Chart 3: CRB's daily chart as at June 9, 2010 (Source: Stockcharts)
Chart 4: WTIC's daily chart as at June 9, 2010 (Source: Stockcharts)
Another way of interpreting the above technical signal is that market players across different asset classes are anticipating the current European problems to turn ugly in the same manner that the sub-prime crisis did in September 2008. Will it happen? We will have to wait & see.
Wednesday, June 09, 2010
Haio may have a bullish breakout
Haio may have broken above its downtrend line resistance at RM4.10 today. This could signal the start of a recovery in the share price of Haio. Based on this, Haio could be a trading BUY.
Chart: Haio's daily chart as at June 9, 2010_4.40pm (Source: Quickcharts)
Warning: Global equity market condition is quite precarious with DJIA trading below 10000 over the past few days. Further weakness in DJIA could trigger more correction in our local market. However, it is good to note that most Asian markets were relatively firm over the past 2 days, which could indicate that they might have reached a temporary bottom.
Linear- the final straw or another brick on the wall?
On December 29, 2009, Linear Corporation Bhd ('Linear')'s announced that its wholly-owned subsidiary, LCI Global Sdn. Bhd. ['LCI'] has on the same day accepted a project awarded by Global Investment Group Inc. ['GIC'] for contruction and completion works for the design, construction, completion and commissioning of a 350,000RT District Cooling Plant in Manjung in the state of Perak for the King Dome Project (“The Project”) with a contract sum of RM1.66 billion. For more, go here.
Like many, I was very surprised by the stunning feat achieved by this smallish company, which was and still is classified under PN1 [after being served with a Notice pursuant to Section 218 of the Companies Act, 1965 by EON Bank Berhad on September 25, 2009]. The Edge wrote about it in an article entitled "Puzzling deal for little-known Linear". Could this be true?
The market reacted predictably by sending Linear's share price skyward, from about 20 sen to an intra-day high of 87.5 sen on December 31, 2009. See the chart below.
Chart: Linear's chart as at June 9, 2010_12.30pm (Source: Quickcharts)
At that time, I was truly puzzled: how did Linear convinced the employer to grant such a huge contract to such a sickly company. I was also equally amazed that Linear would dare to take up the contract because if it failed to perform, it would suffer huge losses. How could it possibly raise the performance bond, etc which are normally requested by an employer in the contracting business. Then, Linear released its unaudited financial statement for QE31/3/2010, which showed that it has cash & bank balances of RM37 million. See the table below.
Table: Balance Sheet as at 31 March 2010
On June 4, Linear made a shocking announcement which seems to have escaped the attention of the press (Hat tip to Surihani who pointed this to me). One of Linear's director has delivered what would surely amount to a coup de grace to Linear by effecting a payment of RM36 million to the employer ('LCI') and yet unable to land the contract due to incomplete documentation. To wit:
The most important sentence in the above passage is: The Advance (of RM36 million) was effected solely by a Director of the Company at the material time in an autocratic manner. How could this happen? Where is the legal advice which surely must have been sought before such a sizable amount of money was paid out? Something is very wrong with Corporate Malaysia if this case and others of the same nature (example: Maxbiz & Distech) are not dealt with firmly.
Like many, I was very surprised by the stunning feat achieved by this smallish company, which was and still is classified under PN1 [after being served with a Notice pursuant to Section 218 of the Companies Act, 1965 by EON Bank Berhad on September 25, 2009]. The Edge wrote about it in an article entitled "Puzzling deal for little-known Linear". Could this be true?
The market reacted predictably by sending Linear's share price skyward, from about 20 sen to an intra-day high of 87.5 sen on December 31, 2009. See the chart below.
Chart: Linear's chart as at June 9, 2010_12.30pm (Source: Quickcharts)
At that time, I was truly puzzled: how did Linear convinced the employer to grant such a huge contract to such a sickly company. I was also equally amazed that Linear would dare to take up the contract because if it failed to perform, it would suffer huge losses. How could it possibly raise the performance bond, etc which are normally requested by an employer in the contracting business. Then, Linear released its unaudited financial statement for QE31/3/2010, which showed that it has cash & bank balances of RM37 million. See the table below.
Table: Balance Sheet as at 31 March 2010
On June 4, Linear made a shocking announcement which seems to have escaped the attention of the press (Hat tip to Surihani who pointed this to me). One of Linear's director has delivered what would surely amount to a coup de grace to Linear by effecting a payment of RM36 million to the employer ('LCI') and yet unable to land the contract due to incomplete documentation. To wit:
To-date, a sum of RM36 million has been advanced by LCI to GIG as part payment of a performance consideration sum prior to the commencement of the Project("Advance"). The Advance was effected solely by a Director of the Company at the material time in an autocratic manner.
Following the reconstitution of the Board of Directors ("BOD") in early May 2010 (as detailed hereinafter), the BOD has immediately undertaken a critical and objective re-assessment of the Project. The preliminary findings are set out below:-
(i) lack of full and proper documentation relating to the contractual relationships;
(ii) no documentary evidence to demonstrate the overall viability of the King Dome Project with an estimated construction cost of about USD 5 billion;
(iii) no documentary evidence on the background and business experience of the promoters of GIG and on the financial standing of GIG;
(iv) absence of proper procedures and internal controls within Linear Group, especially limit on the powers of directors to enter into any financial and contractual commitment on behalf of the Linear Group; and
(v) no evidence of any significant progress towards the execution of the Contract.
Consequently, the BOD has resolved to take action for the full recovery of the Advance in the interest of Linear, its shareholders and other stakeholders. Currently, the BOD is seeking legal advice on this matter. A further announcement will be made at the appropriate time.
The most important sentence in the above passage is: The Advance (of RM36 million) was effected solely by a Director of the Company at the material time in an autocratic manner. How could this happen? Where is the legal advice which surely must have been sought before such a sizable amount of money was paid out? Something is very wrong with Corporate Malaysia if this case and others of the same nature (example: Maxbiz & Distech) are not dealt with firmly.
Tuesday, June 08, 2010
IRCB may have a bullish breakout
Integrated Rubber Corporation Bhd ('IRCB') broke above its downtrend line at about RM0.70 today. From the 60-min intra-day chart (Chart 1), we can see that IRCB has broke above its triangle at RM0.68 & the downtrend line that stretched back to mid-April at RM0.70-71. From the daily chart (Chart 2), we can see a breakout at RM0.67 a few days ago. The next resistance will be at RM0.80 and then at RM0.85.
Chart 1: IRCB's 60-min chart as at June 8, 2010_3.00pm (Source: Quickcharts)
Chart 2: IRCB's daily chart as at June 8, 2010_3.00pm (Source: Quickcharts)
Based on the above breakout, IRCB could be a trading BUY.
Warning: Global equity market condition is quite precarious with DJIA closing below 10000 yesterday. Further weakness in DJIA could trigger more correction in our local market.
Monday, June 07, 2010
Kenmark- the truth must prevail
Kenmark was a badly managed company. Its financial position has deteriorated over the past three years and the group is on the verge of insolvency. Instead of working hard in a last bid effort to revive the company, the management carried out more shenanigan, possibly for their own personal benefit. For more on the charade, go here & here.
What I find most despicable is the effort to generate extremely negative publicity via the disappearing act of the MD which led to a sharp selldown of the shares. The subsequent appearance of a white knight, who apparently acquired the shares in the market at extremely depressed prices, seems to be part of a well-orchestrated move. Fred Tam, an old hand in the field of technical analysis, painted a very interesting scenario of an elaborate market operation which resulted in a selldown of the stock & the huge profit accruing to the operator or pool. To wit:
For more, go here for Fred Tam's post on Kenmark.
From the study of Kenmark's financial statements & the news of the disappearance of its MD and subsequent resignation of its Deputy GM & Finance-cum-Admin Manager, my opinion is that Kenmark is a lost cause. The appearance of Datuk Ishak Ismail as a white knight gives a ray of hope that all was not lost, which I hope to be true. It would be extremely cynical & cruel if Datuk Ishak Ismail is part of the elaborate play to defraud investors, via what Fred Tam called the Wyckoff Method.
I hope the authority would do as Fred Tam has suggested, which is to suspend the counter & investigate all the trades carried out over the past few days relating to this stock. If Datuk Ishak Ismail is a genuine white knight, he should have no objection to the suspension. However, if his motive is to continue to trade on the shares (in order to realize the profit), then we must suspend the stock to plug the escape. Finally, if there is any evidence of fraud, the authority should not hesitate to throw the book at the perpetrators for such an outrageous scam.
What I find most despicable is the effort to generate extremely negative publicity via the disappearing act of the MD which led to a sharp selldown of the shares. The subsequent appearance of a white knight, who apparently acquired the shares in the market at extremely depressed prices, seems to be part of a well-orchestrated move. Fred Tam, an old hand in the field of technical analysis, painted a very interesting scenario of an elaborate market operation which resulted in a selldown of the stock & the huge profit accruing to the operator or pool. To wit:
7. Last week, a little known stock called KENMARK made headlines with its sudden and sharp price plunge from 0.83 on 25/5 to 0.035 sen by 1/6 accompanied by huge selling volume that even exceeded its share capital of 181.7 million shares!
8. Then at about the lowest level of around 0.04 sen, One Datuk Ishak Ismail and company came in to mop up at least 32% of the shares between June 1 and 2 at firesale prices of between 0.035 and 0.06 sen!
9. To those of you who have studied the Wyckoff Method, this is a text book case of the Composite Man using the news media, and insider conniving strategies to cause public panic triggering all and sunder (including brokerages and banks who were holding Kenmark shares as collateral) to “dump” Kenmark shares at or near to its lowest point from 0.035 – 0.06.
10. And at about the lowest point, guess who came in to mop up the shares? The Composite Man! This Composite Man must be investigated by the Securities Commission, Bursa Malaysia and they must bring those responsible for this classical manipulation move used by the likes of Jesse Livermore since the 1900s to book. This is a long forgotten classical technique taught by Richard D. Wyckoff and it is now taught in a technical analysis course offered by the Open University Malaysia-IPD.
For more, go here for Fred Tam's post on Kenmark.
From the study of Kenmark's financial statements & the news of the disappearance of its MD and subsequent resignation of its Deputy GM & Finance-cum-Admin Manager, my opinion is that Kenmark is a lost cause. The appearance of Datuk Ishak Ismail as a white knight gives a ray of hope that all was not lost, which I hope to be true. It would be extremely cynical & cruel if Datuk Ishak Ismail is part of the elaborate play to defraud investors, via what Fred Tam called the Wyckoff Method.
I hope the authority would do as Fred Tam has suggested, which is to suspend the counter & investigate all the trades carried out over the past few days relating to this stock. If Datuk Ishak Ismail is a genuine white knight, he should have no objection to the suspension. However, if his motive is to continue to trade on the shares (in order to realize the profit), then we must suspend the stock to plug the escape. Finally, if there is any evidence of fraud, the authority should not hesitate to throw the book at the perpetrators for such an outrageous scam.
LBS may have a bullish breakout
On a terribly bad day, like today, one would be very surprise that a stock made a strong upside move. One such stock is LBS. There were persistent rumors over the past few weeks that LBS has found a buyer for its Zhuhai land. Could this be the reason for the current price rally?
Technical speaking, the stock looks poised to test its downtrend line at the resistance of RM0.55 this morning. The indicators are generally positive, except for the price movement to confirm the breakout. As at 3.50pm, LBS broke above the RM0.55 resistance & was trading at RM0.56. With this upside breakout, LBS could rally to test its immediate horizontal resistance at RM0.62.
Chart: LBS's daily chart as at June 7, 2010_10.00am (Source: Quickcharts)
For those who are very nimble & brave, LBS could be a trading BUY.
Market Outlook as at June 7, 2010
After the sharp selldown in late MAy, our FBM-KLCI rebounded above the 40-week SMA (or, almost equivalent to 200-day SMA). If the market weakened in the coming weeks, FBM-KLCI would test again the 40-week SMA line at 1261 as well as the "horizontal line" at 1240. It is critical that FBM-KLCI stay above these supports, failing which our market could enter into a downtrend. The market today is quite similar to 1st quarter 2008, where the breakdown of the 40-week SMA line & subsequently the "horizontal line" led to a sharp downtrend.
Chart 1: FBM-KLCI's week chart as at June 4, 2010 (Source: Quickcharts)
Euro index broke its horizontal support at 121 last Friday. Let's take a quick look at EUR/USD chart below. We can see that EUR/USD broke below the horizontal support at 1.25 in late May. Its immediate horizontal support is at 1.17-1.18. If we assumed that EUR/USD is in a ABC corrective waves since July 2008 and these wave patterns take the zig-zag pattern, then the target for the completion of these waves (or, final Wave C) would be about 1.17-1.18. Let's wait & see whether this will pan out. For more on Elliot Waves, go here.
Chart 2: EUR/USD's daily chart as at June 4, 2010 (Source: Yahoo Finance)
The fresh weakness in EURO is again affecting global equity markets, including our FBM-KLCI. As noted above, it is critical that FBM-KLCI should not violate the 40-week SMA line (almost equivalent to the 200-day SMA line) & "horizontal line" supports at 1261 & 1240, respectively. A breakdown of both supports could signal the start of a downtrend for our market.
Wednesday, June 02, 2010
GenM- still standing...
Results Update
GenM has just announced its results for QE31/3/2010 on May 27. Despite a 5%-increase in its turnover (from RM1.28 billion to RM1.35 billion), GenM's net profit dropped by 24% q-o-q (from RM358 million to RM272 million). On the other hand, its net profit dropped by a marginal 1% y-o-y while turnover was up by 14%. The q-o-q drop in GenM's net profit was attributable to impairment loss arising from the investment in Walker Digital Gaming, LLC ('WDG') of RM108 million.
Table 1: GenM's last 8 quarterly results
Chart 1: GenM's 15 quarterly results
Investors' Main Concerns
Two of the main concerns that investors have regarding GenM are:
i) the use of the company's funds for inter-company transactions, such as the acquisition of WDG in 2008; and
ii) the potential drop in GenM's casino business due to the opening of the casino by its sister company, Genting Singapore.
The first concern will persist but the second issue may be put to rest with the announcement of the latest results. I have prepared the charts for the revenue, pre-tax profit & pre-tax profit margin for GenM's Leisure & Hospitality division (which houses the casino operation) from June 2006 until Mar 2010. It is quite clear that despite the start of the Genting Singapore's casino operation in February 2010, the casino operation of GenM did not suffer at all. In fact, we can see that revenue & pre-tax profit have increased (as per Chart 2) & pre-tax profit margin has also inched up (as per Chart 3).
Chart 2: GenM's Leisure & Hospitality Division's top-line & bottom-line for the past 16 quarters
Chart 3: GenM's Leisure & Hospitality Division's pre-tax profit margin for the past 16 quarters
Valuation
As at 31/3/2010, GenM has cash reserves of RM5.273 billion and it also held AFS totaling RM1.618 billion. These cash-cum-liquid assets are equivalent to RM1.17 per share. If this amount is deducted from its closing price of RM2.80 yesterday, GenM is now trading at a PER of 7 times (based on last 4 quarters' EPS of 23 sen). If we valued GenM at a PER of 15 times & add back the cash-cum-liquid assets of RM1.17 per share, GenM would have a fair value of RM4.62.
Technical Outlook
GenM has been moving sideway, between RM2.70 & RM2.90 after "breaking" above its long-term downtrend line ('RR') in November last year. It re-tested that downtrend line last week at RM2.50. With the fear of revenue cannibalization by its sister casino in Singapore disproved, I believe that GenM's may see better prices in the near future.
Chart 4: GenM's weekly chart as at June 1, 2010 (Source: Quickcharts)
Conclusion
Based on good financial performance & cheap valuation, GenM is a good stock for long-term investment. However, its technical outlook is still neutral & showing no sign of a move to the upside.
Tuesday, June 01, 2010
EURO is sliding again...
As at 8.46am GMT, USD/EUR cross rate was trading at 0.825. This is above the high of 0.823 recorded on May 26. See Chart 1 below.
Chart 1: USD/EUR as at June 1, 2010_8.46am GMT (Source: Yahoo Finance)
From the chart below, we can see that EURO index found support at the horizontal line at 121. Without a rebound, we cannot call this a double bottom reversal. If the breakout in the USD/EUR cross rate is signaling further weakness for EURO, then we can expect the EURO index to break below the 121 horizontal support. At this moment (5.00am EDT), the major European stock markets (FTSE, CAC & DAX) are all down by 2%.
Chart 2: EURO index's daily chart as at May 28, 2010 (Source: Stockcharts)
PMetal- to test its uptrend line
Results Update
PMetal has just announced its results for QE31/3/2010. Its net profit increased by 157% q-o-q from RM12.6 million to RM32.4 million, while turnover increased by 18.0% from RM335 million to RM395 million. Compared to the previous corresponding quarter (QE31/3/2009), PMetal has turnaround from a net loss of RM8.8 million on the back of a 53%-increase in turnover from RM258 million. Higher revenue was mainly due to the contribution from the smelting plant in Mukah, Sarawak, which commenced operations on November 2009. PMetal's bottom-line for QE31/3/2010 includes a negative goodwill of RM18.0 million arising from the acquisition of equity share from the minority interest. If this exceptional item is excluded, its pre-tax profit would be about RM22.6 million as compared to RM22.3 million recorded in the immediate preceding quarter (QE31/12/2009).
Table 1: PMetal's last 8 quarterly results
Chart 1: PMetal's 10 quarterly results
Valuation
PMetal (closed at RM1.39 yesterday) is now trading at a PER of 7.5 times (based on last 4 quarters' EPS of 18.6 sen). If we exclude the negative goodwill of RM18 million, the last 4 quarters' EPS would be about 14 sen. On this basis, PMetal's PER would be about 10 times. If we valued PMetal at a PER of 12 times, then its fair value would be about RM1.68.
Technical Outlook
PMetal has tested its uptrend line support at RM1.33. It should also get good support from the 40-week SMA line (equivalent to 200-day SMA line) at RM1.28.
Chart 2: PMetal's daily chart as at May 31, 2010 (Source: Quickcharts)
Chart 3: PMetal's weekly chart as at May 31, 2010 (Source: Quickcharts)
Conclusion
Based on good financial performance, reasonable valuation & positive technical outlook, PMetal could be a good stock for medium-term investment.
Axiata is ripe for some profit-taking
Results Update
Axiata has just announced its results for QE31/3/2010. Its net profit increased by 65% q-o-q or 13-fold to RM921 million while turnover increased by 3% q-o-q or 31% y-o-y to RM3.812 billion. The improved bottom-line was attributable to the following factors:
i) one-off gain on disposal of shares in XL of RM307.5 million; and
ii) one-off gain arising from the completion of the merger of Spice & Idea of RM173.2 million.
If these one-off gains are excluded, Axiata's bottom-line would actually drop when compared to the immediate preceding quarter (QE31/12/2009).
Table 1: Axiata's last 8 quarterly results
Chart 1: Allianz's 13 quarterly results
Valuation
Axiata (closed at RM3.77) is now trading at a PER of 9.2 times (based on last 4 quarters' EPS of 30 sen). However, if we exclude the aforementioned one-off gains of RM480 million, the last 4 quarters' EPS would be about 24 sen. On this basis, Axiata's PER would be about 15.7 times. As such, I believe Axiata is trading at its fair value.
Technical Outlook
Axiata has been consolidating in a "flag" formation over the past 3 months. Recently, it tested the 100-day SMA line & rebounded. That rebound was checked by the 50-day SMA line yesterday. I think Axiata will continue to drift & retest the 100-day SMA line at RM3.63 and, if this support failed, it might test the 200-day SMA line at RM3.36.
Chart 2: Axiata's daily chart as at May 31, 2010 (Source: Tradesignum)
Conclusion
Based on unexciting valuation and mildly bearish technical outlook, Axiata is deemed a candidate for some profit-taking.
Subscribe to:
Posts (Atom)