Thursday, December 30, 2010

IJM also dropped sharply

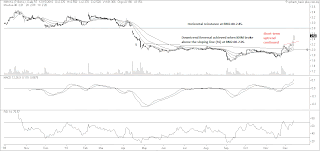
IJM plunged 37 sen to RM6.13 as at 11.30am this morning. At the low, it was trading at only RM6.07. From the daily chart, we can see that IJM tested its accelerated uptrend line at RM6.05 while the longer term uptrend line support is at RM5.70. It also has good horizontal support at RM6.10 & RM6.00.


Chart: IJM's daily chart as at Dec 30, 2010_11.25am (Source: Quickcharts)

Again, I have to reiterate that I do not know why this stock was dropping. The plunge coincides with a selldown for its subsidiary, IJMLand. As at 11.41 am, we can see that both IJM & IJMLand are trading off their low.

The selldown could have been a good buying opportunity for IJM when it tested its accelerated uptrend line at RM6.05 or at the horizontal line support of RM6.10.

IJMLand plunged on heavy volume.

IJMland plunged 49 sen to RM2.75 as at 11.00am this morning. At the low, it was trading at only RM2.66. We do not know the reason for the selldown but the selling is extremely heavy. From the daily chart, we can see that IJMLand has broken below its uptrend line at RM3.00-3.05. It also broke below the horizontal line support of RM2.80. The next horizontal support is at RM2.65.


Chart: IJMLand's daily chart as at Dec 30, 2010_10.55am (Source: Quickcharts)

Why is this stock plunging today? Is there a negative development in relation to its recent proposal for a merger with MRCB? We will have to wait & see.

Wednesday, December 29, 2010

YTLPower may have a bulish breakout

On November 9, YTLPower's share price suddenly shot up to an intraday high of RM2.74. Scanning through the Bursa website, one cannot figure out why the share price jumped so much & so sudden on that day. Two subsequent announcements which could be considered as price-sensitive are the results announcement on November 25 (nothing spectacular) and the setting up of a wholly-owned subsidiary, YTL Jordan Energy Limited which would be involved in investment holdings (of what business we do not know). In the market, there were rumors as always of privatization exercise which not many serious investors would care to believe. What could have cause the sharp spike?

Interestingly, the share price had subsequently consolidated in a descending triangle. On December 23, YTLPower broke to the upside of that triangle at RM2.40. See Chart 1 & 2 below. This bullish breakout was not accompanied by heavier volume. Nevertheless, it did not fall back below the breakout level over the past few days. With the indicators turning positive, this breakout could be the continuation of the prior gradual uptrend for the stock. Whatever that has propelled YTLPower to spike up on November 9 could come into play again. From Chart 3, we can see that YTLPower is in a long-term uptrend line with support at RM1.90. The parallel line may cap the next rally and that resistance posed by this line is at RM3.20-3.30.


Chart 1: YTLPower's daily chart as at Dec 29, 2010_9.20am (Source: Quickcharts)


Chart 2: YTLPower's 60-min chart as at Dec 29, 2010_9.20am (Source: Quickcharts)


Chart 3: YTLPower's monthly chart as at Dec 1, 2010 (Source: Tradesignum)

Based strictly on technical analysis, YTLPower could be a good trading BUY.

Tuesday, December 28, 2010

Hapseng- a big miss!


Chart: Hapseng's monthly chart as at Dec 1, 2010 (Source: Tradesignum)

A picture that paints a thousand WORDS! How could we have missed it?!

Thursday, December 23, 2010

Merry Christmas & Happy New Year

I like to wish all my readers a Merry Christmas & a Happy New Year.


(Source: 123greetings.com)

Adventa- rising sharply on better results?

Results Update

Adventa has just announced its results for QE31/10/2010. Its net profit increased by 44% q-o-q or 119% y-o-y to RM11.8 million, while turnover increased by 4% q-o-q or 22% y-o-y to RM91 million. The increased in the net profit is due solely to lower effective tax rate due to availability of reinvestment allowances from capital expenditure incurred by certain subsidiaries and profits exempted under pioneer status for a period of 10 years and other fiscal incentives from the government. This led to a transfer from deferred tax of RM7.7 million for QE31/10/2010.

Adventa's pre-tax profit level continued to slide- dropping 50% q-o-q or 31% y-o-y to RM4.2 million. The company attributed the decline to "the high raw material cost and weak US dollar. The fast hike in rubber prices induced a large time-lag related delay in revenue increase even though cost are eventually passed into selling price. This dragged down the quarter’s earnings. A new factory was completed in this period, adding capacity to the tight high utilization rate in some products."


Table: Adventa's last 8 quarterly results


Chart 1: Adventa's 23 quarterly results

Valuation

Without the deferred tax effect, Adventa's EPS for QE31/10/2010 would be about 2.75 sen (or full-year EPS of 11 sen). In the current environment, it is likely that this EPS number may go down. Assuming that this number can be maintained, Adventa (at RM2.49 now) is trading at a current PE of 23 times. That makes Adventa fairly expensive.

Technical Outlook


Adventa is enjoying a very strong rally this morning. As at 11.40am, Adventa was trading at RM2.49- a gain of 57 sen or 30% from yesterday's close! This means that Adventa has broken above its downtrend line resistance at RM2.40 (see Chart 2 below). The strong rally is very strange as the above results shows that the operating performance has actually deteriorated.


Chart 2: Adventa's daily chart as at Dec 22, 2010 (Source: Tradesignum)

From Chart 3 (plotted on log scale), we can see that Adventa had broken below the longer term uptrend line at RM2.20. It may be a moot point now to note that the stock has also broken below the psychological RM2.00 level.


Chart 3: Adventa's weekly chart as at Dec 20, 2010 (Source: Tradesignum)

Conclusion

The strong rally today causes a crash between the fundamental view- which is still negative- & the technical view- which has turned positive. Which view should we follow? I am inclined to take the fundamental view for now and recommend a "sell into strength" for those holding the stock or an "avoid" for those hoping to get in.

Wednesday, December 22, 2010

GenM in another casino venture

Genting Malaysia Bhd today confirmed that it- together with a partner, Vina Capital- has obtained approval from the government of Vietnam for a US$4 billion (RM12.53 billion) casino resort project in Hoi An city. For more, go here.

Readers may recall my numerous positive posts on GenM (an example here) but this stock has disappointed many. It even lagged behind its younger "siblings" such as Genting SP & Genting HK (see this post).

At one stage, GenM sat a cash pile of more than RM6 billion & many analysts & investors were hoping that GenM would declare a bumper dividend or capital repayment but alas none was forth coming. Instead of rewarding its shareholders with cash handouts, GenM has begun to invest the funds in casino ventures, starting with the acquisition of the Genting group's casino interest in UK (here) & then venturing into a racino business in New York (here). The above announcement confirms the trend of more future casino ventures to come for GenM. This news flow- some positive, some not so- could stir up interest in this much-neglected stock.

From the chart below, we can see that GenM (closed at RM3.29 yesterday) is resting on its medium-term uptrend line at RM3.30. Its overhead downtrend line resistance is at RM3.45. It is relatively safe to take a position in GenM at the uptrend line. If the stock can break above the RM3.45 level, it could be a trading BUY.

Chart: GenM's daily chart as at Dec 21, 2010 (Source: Quickcharts)

For those with a more aggressive appetite, you may try GenM-JA or GenM-CL. The former is like a Callable Bull Certificate (or 'CBLC'), which is very similar to a Call Warrant (or 'CW') except it has the added feature of having a Mandatory Call Event ('MCE') which automatically forces the issuer to recall the CBLC when it hit a Minimum Trading Price ('MTP') (for more, go here). At a premium of 3%, GenM-CL is the cheapest structured instrument but it has a relatively short lifespan of about 2 months. Gen-JA has a longer lifespan than GenM-CO as well as trading at a premium of half that of GenM-CO. My preference is for GenM-JA.


Table: GenM's CWs & CBLC valuation & terms

Based on the above, I believe GenM remained a good stock for long-term investment.

Tuesday, December 21, 2010

Petra's upleg may have commenced


Petra has surpassed its recent high of RM0.99 recorded on December 14. As at 4.20pm, Petra was trading at RM1.09. The market action for this stock is strong and the volume is heavy.


Chart 1: Petra's daily chart as at Dec 21, 2010_ 4.00pm (Source: Quickcharts)

In addition, we can see that Petra has also broken above its long-term downtrend line at RM0.80-85 in early December. The technical indicators have turned up.


Chart 2: Petra's weekly chart as at Dec 21, 2010_ 4.00pm (Source: Quickcharts)

Based on the technical outlook, Petra could be a good stock for trading purposes or even medium-term investment. However, it must be noted that Petra's recent financial performance has been disappointing, with huge losses recorded in the past 2 quarters (here a& here). For QE30/9/2010 & QE30/6/2010, Petra chalked up net losses of RM24 million & RM33 million, respectively.

Monday, December 20, 2010

Haio- the free fall has stopped!

Results Update

Haio reported its results for 2Q2011 ended 31/10/2010. Its net profit dropped 21% q-o-q or 70% y-o-y to RM6.1 million while its turnover declined 4% q-o-q or 60% y-o-y to RM53 million. The poor results is attributable to "the lower contribution from the MLM division and unusually, sales during Ramadhan month were significantly lower". The poor performance of the MLM division is due to "the slower membership growth" which is in turn due to the "recent amendments to the Direct Sales Act appear to have affected the confidence of the direct selling industry".


Table: Haio's last 8 quarterly results


Chart 1: Haio's 23 quarterly results

Valuation


Haio (closed at RM2.83 as at 10.00am) is now trading at a current PE of 20 times (based on the annualized EPS of 13.96 sen derived from the 1H2011 EPS of 6.98 sen). Without a quick recovery, Haio's share price would continue to drift lower as investors discount the stock to an acceptable PE (possibly to 15 times earning). As such, Haio's fair value could be about RM2.10.

Technical Outlook


Haio may test its long-term uptrend line at RM2.75-2.80 soon. While this is a strong support level, the continued poor performance may bring forth more selling which would severely test the uptrend line. We will have to wait & see whether the stock would stage a decent rebound from here.


Chart 2: Haio's monthly chart as at Dec 1, 2010 (Source: Tradesignum)

Conclusion


Based on weak financial performance & unattractive valuation, Haio is a stock to be avoided for now. However, it may enjoy a technical rebound from the long-term uptrend line support at RM2.75-2.80.

Friday, December 17, 2010

Unisem may have a bullish breakout

Unisem may have broken above its medium-term downtrend line at RM2.15 this morning. The indicators are swinging up to confirm this potential breakout. The volume has increased significantly. If this breakout can recruit sufficient support, it may soon test its immediate horizontal resistance at RM2.40 & thereafter its recent high st RM2.60.


Chart 1: Unisem's daily chart as at Dec 17, 2010_ 12.30pm (Source: Quickcharts)

Based on the above technical outlook, Unisem could be a good trading BUY.

Thursday, December 16, 2010

Topglov's top-line dropped but bottom-line maintained

Results Update

Topglov has just announced its results for QE30/11/2010, where its net profit dropped 20% q-o-q or 45% y-o-y to RM36.0 million Its turnover declined 9% q-o-q but rose 4% y-o-y to RM492 million. Topglov attributed its poorer performance for the last 2 quarters to "higher latex prices & weaker US Dollar".


Table: Topglov's last 8 quarterly results


Chart 1: Topglov's last 18 quarterly results

Valuation

Topglov (closed at RM5.45 yesterday) is now trading at a trailing PE of 15.5 times (based last 4 quarters' EPS of 35.6 sen). At this PE multiple, Topglov is deemed fairly valued.

Technical Outlook

From the 2 charts below (plotted on log & linear scale), we can see that Topglov is now trading between the 10-month SMA line & the 20-month SMA line. The 10-month SMA line has flatted out & poised to curve downward. The likely outlook for Topglov is either a sideway trend or downtrend. The last time Topglov's 10-month SMA line curved downward as well as breaking below its 20-month SMA line was in August 2007. The stock then entered into a downtrend for the next 14 months. That downtrend was reversed in January 2009 when the stock once again broke above its 10-month SMA line & curve upward.


Chart 2: Topglov's weekly chart as at Dec 13, 2010 (Source: Tradesignum)

Conclusion


Based on poor financial results & technical outlook, I maintain the SELL call for Topglov.

Wednesday, December 15, 2010

Market Outlook as at December 15, 2010

FBM-KLCI is holding very well but we mustn't be complacent. I am often dumbfound when some one asked me "Are we going to have a bull run?" I thought we are in a bull run- albeit a rather stealthy bull run- with the FBM-KLCI gaining 80% since March 2009.

From the chart below, we can see that a few indicators, such MACD, RSI & William %R , have turned negative. The market could enter into some correction with the FBM-KLCI dropping to test the psychological 1500 level or even the 10-week SMA line (equivalent to 50-day SMA line) at 1493. A minor correction, if it happened, is not a bad thing. With ample liquidity, I believe any correction will likely to be short & shallow. Or, am I being complacent?!!


Chart : FBM-KLCI's weekly chart as at Dec 15, 2010_3.00pm (Source: Quickcharts)

Based on the above, I think we should reduce our trading activities for the next few days (or for 1-2 weeks) until the technical indicators have recovered.

TChong- time for some profit-taking

The call to stay invested in TChong was one of the best calls I've made last year. As you may recall, I had earlier called for profit taking on TChong on December 8, 2009 (here). TChong then surprised me by breaking above the high of RM2.70 recorded on Nov 18. More importantly, it has also surpassed the rising 'horizontal' line connecting the peak or 'high' for this stock since 1993. Go here. I then extrapolated that TChong could potentially reach a high of RM6.00. This it did on September 17, 2010 and thereafter TChong entered into a correction. From Chart 1 below, we can see the following:

1) Based on the linear chart (on the left), TChong has broken below its 20-week SMA line (or, 100-day SMA line) at RM5.44;
2) Based on the logarithmic chart (on the right), TChong has broken below its uptrend line at RM5.35-5.40; and
3) The MACD & ADX indicators are flashing negative signals, with MACD hooking down & -DMI crossing above +DMI.
TChong (currently at RM5.19) could reverse these negative technical readings if it has a strong rebound & recover above RM5.45 over the next few days. Failing which, TChong could have peaked & it could enter into a sideway trend or even a downtrend.


Chart: TChong's weekly chart as at Dec 13, 2010 (Source: Tradesignum)

Based on the above technical reading, I think it is time to take some profit on TChong by reducing your position in this stock (say, 20-30%).

KNM broke above its downtrend line at RM2.20-2.25.

KNM had a downtrend reversal when it broke above the sloping line (SS) at RM2.00-2.05 on November 26. KNM dropped back to test this sloping line (SS) at RM2.00 when it underwent some correction & then rebounded off this line on December 8. Yesterday, KNM surpassed the recent high of RM2.20, which signal the continuation of the short-term uptrend line. See Chart 1 below.


Chart 1: KNMs daily chart as at Dec 15, 10.20am (Source: Quickcharts)

The upside breakout of the recent high also coincided with the upside breakout of the medium-term downtrend line (RR) at RM2.20-2.25 (see Chart 2). With this breakout, KNM is likely to test its next horizontal resistance at RM2.80-2.85.


Chart 1: KNMs weekly chart as at Dec 15, 11.20am (Source: Quickcharts)

Based on the above, KNM could be a good trading BUY.

OSK's uptrend to continue

OSK has just surpassed its strong horizontal resistance at RM2.00 as well as its recent high at RM2.03 (see Chart 1). This could signal the continuation of its prior uptrend. Its next resistance is at RM2.25 & thereafter at RM2.40.


Chart 1: OSK's daily chart as at Dec 15, 10.00am (Source: Quickcharts)


Chart 2: OSK's weekly chart as at Dec 15, 10.00am (Source: Quickcharts)

Based on the upside breakout at RM2.00-2.03, OSK could be a good trading BUY.

Thursday, December 09, 2010

PICorp- the recovery to come...

Background

Progressive Impact Corporation Bhd ('PICorp') is principally involved in the provision of environmental consulting, monitoring equipment/system integration, waste management engineering, environmental training, Environmental, Safety and Health (ESH) Consulting, laboratory testing and environmental data management services.

Recent Corporate Development

PICorp had a strong rally in 2007-2008, riding on the back of the followings:
1) a generous bonus issue & share split (here); and
2) its 60%-owned subsidiary, Seeco Engineering for Sewerage & Environmental Co. Ltd ("SEECO") securing a contract of USD55 million from the Sudanese Government (which was later raised to USD85 million). For more, go here & here.

The Sudanese contract did not work out as the Sudanese Government failed to furnish an international bank guarantee as security for the payment of contract works to be carried out. This contract has now been terminated & PICorp has disposed off its 60%-stake in SEECO (here).

Recent Financial Results

Due to the provision made for the impairment of concession assets under construction (as per the Sudanese contract) of RM13.656 million, PICorp incurred a huge net loss of RM4.8 million in QE30/6/2010. In QE30/9/2010, PICorp's financial performance was still very weak. The company expressed the opinion that the 4Q2010 results would be favorable.


Table: PICorp's last 8 quarterly results


Chart 1: PICorp's last 13 quarterly results

Valuation & Other comments

A company that is afflicted by a loss-making subsidiary or division would usually suffer a drop in its profitability & this would lead to a decline in its share price. After the loss-making operation has been shut down or expunged, the company's bottom-line would slowly improve & along with that an improvement in its share price.

PICorp (closed at RM0.255 yesterday) is now trading at a PE of about 13 times (assuming a normalized earning of 2 sen). At this multiple, PICorp- a smallcap- is deemed fairly valued.

Technical Outlook


From the daily chart below, we can see that PICorp has broken above its downtrend. It has surpassed its 100 & 200-day SMA line at about RM0.245-0.25.


Chart 2: PICorp's daily chart as at Dec 8, 2010 (Source: Tradesignum)

Conclusion


Based on positive technical outlook & a potential shift in operational results & market psychology, PICorp could stage a steady recovery from its recent low. Its valuation is however not cheap & its results have yet to confirm its turnaround. As such, it would warrant further monitoring or only slow accumulation.

UEMLand to test the resistance of RM2.57-2.60 shortly.

UEMLand is all set for another "loud hailer" test. In the past 12 months, UEMLand consolidated 4 times & formed a "loud hailer" each time (see the daily chart below). In the past three occasions where it managed to surpass the upside resistance, the stock had gone higher. The first attempt usually failed. If it succeeds in an upside breakout, the stock would rise further but it tends to slid back to the breakout level a few weeks later. In the current test, we will see whether UEMLand can take out the upside resistance at RM2.57-2.60. If it can do so, the stock may charge to RM3.00. If not, it may enter into a short correction and prepare for another attempt a few days or weeks later. With this information, you may be better prepared to take the opportunities that may arise. Good luck!


Chart: UEMland's daily chart as at Dec 9, 11.30am (Source: Quickcharts)

Wednesday, December 08, 2010

PPB is testing its uptrend line at RM17.00

PPB dropped 52 sen to trade at RM17.00 as at 3.00pm today. It is now resting at its accelerated uptrend line support at about RM17.00. This happens to be the horizontal support area as well. The indicators have however weakened, thus raising the prospects that the RM17.00 support may not hold. If this support failed, there are multiple support at RM16.00, RM15.00 and then RM14.00.


Chart: PPBs weekly chart as at Dec 8, 2010_3.00pm (Source: Quickcharts)

The drop on PPB share price comes hot on the heel of a similar decline suffered by its related company, Wilmar International Ltd (which is listed on SGX). The drop in Wilmar share price was attributable to a 60%-drop in its earning for 3Q2010 (here). This has also affected PPB, which saw its net profit dropping by 52% q-o-q or 9% y-o-y to RM288 million for 3Q2010 ended 30/9/2010. For the 9-month ended 30/9/2010, Wilmar's contribution profit contribution to PPB's bottom-line dropped by RM344 million "largely due to weaker performance in its oilseeds and grains segment". In term of valuation, PPB is now trading at 17 times its annualized EPS of RM1.00 (which is based on the EPS for QE30/9/2010 & QE30/6/2010 of 24 & 27 sen, respectively).

While the drop in PPB share price to its accelerated uptrend line may be viewed as a buying opportunity, we have to be careful given the deterioration in its recent financial performance and the sign of weakness in its technical indicators. To be sure, we should wait for a rebound from the uptrend line before jumping into this stock.

Allianz- preparing for a breakout?


Results Update

Allianz announced its results for QE30/9/2010 in late November. Its net profit increased by 17% q-o-q or 50% y-o-y to RM34.7 million while its turnover dropped marginally by 1% q-o-q or 4% y-o-y to RM607 million. The lower turnover was attributable to lower gross earned premiums from the general insurance business. Nevertheless, Allianz reported a higher net profit due to improved underwriting results which is attributable to lower claim ratio & expenses ratio.


Table: Allianz's last 12 quarterly results


Chart 1: Allianz's 19 quarterly results

Other Comment


In 4Q2009, Allianz transferred a surplus of RM12.0 million from its Life Fund to the Shareholder's Fund. I expect a similar transfer for 4Q2010 ending 31/12/2010. If this happened, Allianz's full-year EPS for FY2010 could be about 96 sen.

Valuation (amended)

Based on the above earning expectation, Allianz (closed at RM4.24 on December 6) is now trading at a gross PE of 4.4 times. However, Allianz has 192.337 million Allianz-PA which can be converted to ordinary shares on a 1-to-1 basis starting June 2011. Assuming all of them were converted to ordinary shares, Allianz's EPS would be diluted from 96 sen to 43 sen. Allianz's diluted PE would be 10 times. At this multiple, the stock is deemed attractive.


Note: Hat tip to reader Polite Market for bringing this to my attention.


Technical Outlook


From the chart below, we can see that Allianz tried to break to the upside of its symmetrical triangle at RM4.30. It made an intra-day high of RM4.36 before retracing to the overnight close at RM4.24 as at 11.05am. The indicators are slowly curving up- indicating an potential upside breakout.


Chart 2: Allianz's weekly chart as at Dec 8, 2010_9.10am (Source: Quickcharts)

Conclusion


Based on good financial performance & attractive valuation, Allianz continued to be a good stock for long-term investment. It could even be a good trading BUY if it can break above the RM4.30 level.

Friday, December 03, 2010

Jerneh- should we worry about the PN17 classification?

Jerneh is considered "an affected listed issuer pursuant to PN17 of the Listing Requirements whereby a listed issuer has suspended or ceased its major business or operations as a result of the disposal of the listed issuer’s major business" (here). As you are well aware Jerneh has disposed off its major business- the insurance business- for RM523.2 million (here). What's Jerneh's plan for the future? Capital repayment or new business injection? If it's the latter, what is this new business? Would Jerneh remain in the Robert Kuok group? All these uncertainties are weighing on the share price and some investors have decided to cash out & look for other stocks to invest in. However I do not believe that you should just dump this stock because of the PN17 classification as Jerneh is well-backed by good assets & it is still a part of the well-managed Robert Kuok group.

Market Outlook as at December 3, 2010

November 2010 would be remembered for all economic uncertainties & political problems that have cropped up. Despite all these problems, the global stock markets were fairly resilient. After a strong rally which started in March 2009, some (like me) thought that the market would consolidate or even enter into a deep correction. We were proven wrong.

From the chart below, we can see that our FBM-KLCI has only pulled back to its medium-term uptrend line. At the lowest point on November 29, the index tested the uptrend line support at 1174. Yesterday, it rebounded strongly & broke above its short-term downtrend line at 1490. With this upside breakout, the market may again be continuing on its prior uptrend.


Chart: FBM-KLCI's daiky chart as at Dec 2, 2010 (Source: Tradesignum)

Based on the above positive (& potentially bullish) technical outlook, we can adopt a more constructive stance by buying into stocks which have corrected back sharply.

Thursday, December 02, 2010

Tongher- a bullish breakout in slow motion?

Results Update

Tongher announced its results for QE30/9/2010 in late November. Its net profit increased by 32% q-o-q or 137% y-o-y to RM8.4 million while its turnover increased by 72% q-o-q or 125% y-o-y to RM109 million. The improved performance is attributable to higher turnover, lower raw material costs & other operating costs. In addition, it recognized a negative goodwill of RM5.1 million. Without this adjustment, Tongher's net profit would suffer a drop of 31% q-o-q but it would still record a growth of 24% y-o-y. Tongher expects its results to be positive in the current financial year.

Business Update

Tongher is mainly involved in the manufacture & sale of stainless steel fasteners (nuts & bolts). It has a 37%-stake in Fuco International Ltd, which holds a 90%-stake in Fuco Steel Corp Ltd. The latter will be involved in the manufacture & sale of steel billets in Vietnam. The steel billets mill is now under construction & nearing completion. Check out this little snippet on steel projects in Vietnam (here). Tongher's fasteners business suffered over the past 2 years due to anti-dumping charges leveled against it by the European Commission. In July this year, the company learned that the EC proceeding has been terminated. With the termination of the anti-dumping charges, Tongher's export business should pick up. For more, go here.


Table: Tongher's last 8 quarterly results


Chart 1: Tongher's 24 quarterly results

Financial Position

Tongher's financial position is considered satisfactory. As st 30/9/2010, its current ratio stood at 2.8 times & debts to equity at 0.3 time.

Valuation

Tongher (closed at RM1.98 yesterday) is now trading at a trailing PE of 10 times (based on last 4 quarters' EPS of 19.18 sen). With positive development rolling in over the next 12 months (from increased export to Europe & the opening of the Vietnam mill), Tongher's earning & its PE multiple should improve accordingly.

Technical Outlook

Tongher has been consolidating over the past 2 years in a symmetrical triangle. It may have broken to the upside of this triangle at RM1.95 yesterday. Over the past 4-5 days, the traded volume has increased. However, this volume (of about 200,000 units per day) is still relatively small. The indicators are slowly turning upward. The much-anticipated bullish breakout is still a work-in-progress at this stage. To sure, I would like to see a break above the psychological RM2.00 & a daily volume of 1 million units.


Chart 2: Tongher's weekly chart as at Dec 2, 2010_9.10am (Source: Quickcharts)

Conclusion

Based on improving financial performance & reasonable valuation, Tongher could be a good stock for long-term investment. The technical outlook is slowly turning positive.

Wednesday, December 01, 2010

TWS's net profit soared

Results Update

TWS has just announced its results for QE30/9/2010. It's a sterling performance with net profit soaring to RM124 million- an increase of 42% q-o-q or 236% y-o-y. This was achieved by a 9% q-o-q or 207% y-o-y increase in turnover to RM1.4 billion. The improved performance was due to all round improvement in its 3 divisions- Rice, Sugar & Plantation. The Rice division has benefited from stability in the price of rice while the Plantation division has benefited from higher selling prices of CPO.


Table: TWS's last 8 quarterly results


Chart 1: TWS's 9 quarterly results

Financial Position

One of the main concern for TWS is its stretched Balance Sheet. As at 30/9/2010, its current ratio is satisfactory at 1.6 times while its debt to equity is at 1.2 times. In my opinion, the slightly higher leverage is understandable since TWS has substantial exposure in the trading sector (via its Rice & Sugar divisions). It would be too conservative to expect lower leverage in trading operation in the consumer stable businesses, such as Rice & Sugar.

Valuation

TWS (RM4.55 as at 12.00pm) is now trading at a current PE of 3.5 times (based on an annualized EPS of 131 sen which in turn is based on the last 3 quarterly results). At this multiple, TWS is deemed very attractive.

Technical Outlook

TWS has broken above its pennant formation at RM4.20. With this bullish breakout, the stock will continue on its prior uptrend. Its next resistance is at RM5.15-5.20.


Chart 2: TWS's weeky chart as at Dec 1, 2010_11.00am (Source: Quickcharts)

I have also plotted the long-term monthly chart, on log scale below. From this chart, we can see that the stock could potential test the line connecting its last 17 years' peak (at RM6.00).


Chart 3: TWS's monthly chart as at Nov 1, 2010 (Source: Tradesignum)

Conclusion

Based on impressive financial performance, attractive valuation & bullish technical outlook, TWS is a very good stock to buy for medium to long-term investment.

MNRB reported another profitable quarter

Results Update

MNRB reported another quarter of good profit. The improved performance is due to the absence of big claims & additional claim provision in order to comply with BNM requirement.


Table: MNRB's last 10 quarterly results


Chart 1: MNRB's 15 quarterly results

Valuation

Based on the annualized EPS of 44 sen, MNRB (closed at RM2.78 yesterday) is now trading at a current PE of 6.3 times. However, MNRB's performance has been so erratic over the past 9-10 quarters, that one is hard pressed to accept this annualized figure. Assuming a 50% discount, MNRB would still be trading at 12.6 times. Even at the adjusted figure, MNRB is deemed inexpensive.

Technical Outlook

From the long-term monthly chart (plotted on log scale), MNRB seems to be resting on its "uptrend line" support of RM2.70-2.80.


Chart 2: MNRB's monthly chart as at Nov 1, 2010 (Source: Tradesignum)

Conclusion


Based on improved performance & good technical support at RM2.70-2.80, MNRB could be a good stock for long-term investment.

JCY posted a net loss of RM22.6 million

Results Update

JCY has just announced its results for QE30/9/2010. It's a disappointing set of results with JCY incurring a net loss of RM22.6 million as compared to a net profit of RM55.6 million for QE30/6/2010 or RM73.5 million in QE30/9/2009. Its turnover was relatively unchanged at RM486 million. The company attributed its poor performance to unfavorable exchange rate, lower average selling prices, and higher raw material & labor costs.


Table: JCY's last 7 quarterly results


Chart 1: JCY's 7 quarterly results

Financial Position


JCY's fiancial position as at 30/9/2010 is deemed satisfactory, with current ratio at 1.4 times & debts to equity ratio at 0.4 time.

Technical Outlook

JCY is in a downtrend line, with resistance at RM0.95-0.97. It just broke below the horizontal support of RM0.88, which was its previous low. The stock could potentially test the parallel line support at RM0.60.


Chart 2: JCY's daily chart as at Dec 1, 2010_9.05am (Source: Quickcharts)

Conclusion

Based on poor financial performance & bearish technical outlook, JCY should be avoided for now. The catalyst for a re-rating would be improved financial performance which would signal the end of a slowdown in HDD demand. For those with a contrarian approach & willing to take some risk, you may try slow buying at the potential support of the parallel line at RM0.60.