After making a low of RM7.30 in March 2009, F&N has rallied strongly. The sell-off in March was prompted by the decision by The Coca-Cola Company ("TCCC") not to renew the Bottler’s Agreements with F&NCC Beverages Sdn Bhd ("F&NCCB") and the Distributor’s Agreement with F&N Coca-Cola (Malaysia) Sdn Bhd ("F&N Coca-Cola") upon expiry on 26 January 2010.
Two weeks ago, F&N has surpassed its high of RM9.10 achieved in October 2008. F&N made a high of RM9.90 today. What's more interesting is that the rally is achieved on extremely thin volume. Are we see a Diet Coke and Mentos eruption?
From the monthly & weekly charts below, we can see that F&N has been rising in a slowly expanding channel. The immediate upside boundary of this channel is about RM10.00-10.40, while the downside boundary is about RM7.60-8.30. One can sell at the upside boundary and/or buy at the downside boundary.
Chart 1: F&N's monthly chart as at 29/6/2009 (Source: Quickcharts)
Chart 2: F&N's weekly chart as at 29/6/2009 (Source: Quickcharts)
I have appended below F&N's last 8 quarterly results as well as a chart of the movement of its top-line & bottom-line for the past 10 quarters. F&N's turnover has been fairly stagnant for the past 6 quarters. Despite the increased turnover in the earlier 4 quarters, F&N's bottom-line has been flattish through the past 10 quarters.
Chart 3: F&N's last 10 quarterly results (presented in line chart)
In term of valuation, F&N (closed at RM9.50 yesterday) is now trading at a trailing PE of 19 times (based on the last 4 quarter's EPS of 50.2 sen). This compared favorably to Nestle (closed at RM31.50 yesterday) which trades at a trailing PE of 22 times (based on FY2008 EPS of 145 sen). However, one must bear in mind that F&N's business may be impact by the cancellation of the Coca-Cola Bottler’s Agreements & Distributor’s Agreement.
Based on valuation & technical consideration, I believe that F&N could be a trading SELL if it ever reach a high of RM10.00-10.40.
This is a personal weblog, reflecting my personal views and not the views of anyone or any organization, which I may be affiliated to. All information provided here, including recommendations (if any), should be treated for informational purposes only. The author should not be held liable for any informational errors, incompleteness, or delays, or for any actions taken in reliance on information contained herein.
Tuesday, June 30, 2009
NTPM's steady growth continued
Background
NTPM Holdings Bhd ('NTPM') is involved in the manufacture and trading of paper products, such as toilet rolls, tissues, and serviette. The company offers tissue products consisting of facial tissue, toilet paper, kitchen towel rolls, and napkins under the Premier, Royal Gold, and Cutie brand names; and personal care products comprising feminine hygienic products, cotton products, baby diapers, and incontinent products under Intimate, Diapex, and Premier Cotton brand names.
Recent Financial Results
NTPM has just announced its results for 4Q2009 ended 30/4/2009. Its net profit increased by 20.6% q-o-q or 45.4% y-o-y to RM10.3 million while its turnover increased by 18.1% q-o-q or 19.4% y-o-y to RM87 million. The improved performance is attributable to an overall increase in its sale of tissue products, sanitary napkins & diapers.
Note: NTPM had a Bonus Issue of 4-for-5 which was ex on April 2.
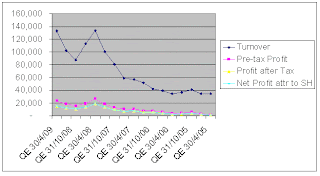
As you can see from Chart 1 below, NTPM's top-line & bottom-line has been on a steady rise in the past 15 quarters.
Chart 1: NTPM's 15 quarterly results
Valuation
NTPM (closed at RM0.455 yesterday) is now trading at a trailing PE of 11 times (based on last 4 quarters' EPS totaling 4.1 sen). With growth averaging about 15% over the past 3 years, a rough PEG ratio is about 0.7 times. However, a more precise calculation of PEG ratio is to divide the PE ratio by the product of growth estimate (say, 10%) & dividend yield (2.1 sen/45.5 sen x 100%).
PEG ratio = PE / (Growth Estimate + Dividend Yield)
= 11 / (10 + 4.6)
= 0.75 times
A PEG ratio of less than 1 means that the stock is attractive.
Technical Outlook
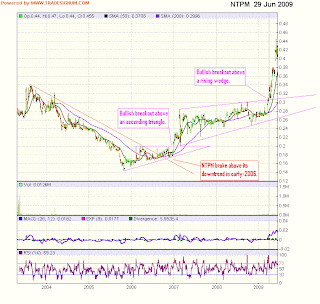
NTPM broke above its downtrend line in 2006. Its subsequent uptrend has not been a steady affair. This stock tends to have sharp rally, followed by prolonged consolidation (in the form of ascending triangle or rising wedge). NTPM had a bullish breakout of a rising wedge formation at RM0.31 in April. Since then, it has been in a steep rally which has only encountered minor corrections. Would a more severe correction set in soon? Would that correction be followed by a consolidation lasting 1 or 2 year(s)?
Chart 2: NTPM's daily chart as at 29 June 2009 (Source: Tradesignum)
Conclusion
Based on good financial performance & attractive valuation, NTPM is a good stock for long-term investment. Since the stock is currently in a steep rally, gain a cheap entry is not easy. One may adopt a slow accumulation on price weakness (or, pullback to RM0.40).
Monday, June 29, 2009
Haio- a comeback kid
Results Update
Haio has just announced its results for 4Q2009 ended 30/4/2009. Its net profit increased by 22.4% q-o-q to RM14.7 million on a 30.1%-increase in turnover to RM133 million. The company attributed the improvement to the success of its house brand "Bio Aura" water filter and increased membership in its MLM division. However, Haio's net profit for 4Q2009 was lower than its 4Q2008 by 22.7% while turnover was down 0.5%. The results pf 4Q2008 had benefited from the presence of the CNY2008 festival while CNY2009 festival fell in 3Q2009 (where the positive effect was muffled by the poor consumer confidence resulting from the global financial crisis).
I have appended below Haio's top-line & bottom-line performance for the past 17 quarters. One can see clearly that Haio's results peaked in 4Q2008 and dropped back for the next 2 quarters before recovering in the past 2 quarters. Can Haio maintain its impressive growth rate in this challenging time? Only time will tell...
Chart 1: Haio's 17 quarterly results
Valuation
Haio (closed at RM4.44 last Friday) is now trading at a trailing PE of 7.2 times (based on last 4 quarters' EPS of 62.3 sen). For a well-managed company, Haio's valuation is undemanding.
Technical Outlook
Despite the strong financial performance, I am a bit wary about this stock. I feel that Haio is rather extended after rising from RM0.80 in early 2006. From the daily chart, I have highlighted the negative cross where the 50-day SMA cut below the 100-day SMA in early-Mar 2008 (denoted as 'A') and the negative golden cross where the 50-day SMA cut below the 200-day SMA in mid-December 2008 (denoted as 'B'). Despite the negative golden cross and the share price dropping below the 200-day SMA, Haio managed a complete recovery in April this year! The positive golden cross has been achieved & share prices are above the 200-day SMA. This complete reversal can be attributed to 2 factors- the strong recovery in Haio's financial performance & the thinly-traded volume of this stock.
One thing to note: Haio may have benefited from its steady share buybacks which commenced in March 2003. Its holding of Treasury shares stood at 1.25 million units as at June 2, 2009. In August 2008, Haio distributed 3.23 million Treasury shares to its shareholders on the basis of 1-for-40. With its strong financial position as at 30/4/2009, where its low gearing stood at 0.1 times, current ratio stood at 1.5 times plus cash balance of RM51 million, Haio can continue with its share buyback for a long while.
Chart 2: Haio's daily chart as at 20090626 (Source: Tradesignum)
Conclusion
Based on improved financial performance & relatively attractive valuation, Haio could be a good stock for long-term investing. Nevertheless, it is not easy to call a buy on this stock at the current level. A good entry is around RM3.50-4.00 but that's not likely to happen any time soon. The dilemma for those who have this stock is equally daunting- to take profit at RM4.50-5.00 or not to take profit.
Haio has just announced its results for 4Q2009 ended 30/4/2009. Its net profit increased by 22.4% q-o-q to RM14.7 million on a 30.1%-increase in turnover to RM133 million. The company attributed the improvement to the success of its house brand "Bio Aura" water filter and increased membership in its MLM division. However, Haio's net profit for 4Q2009 was lower than its 4Q2008 by 22.7% while turnover was down 0.5%. The results pf 4Q2008 had benefited from the presence of the CNY2008 festival while CNY2009 festival fell in 3Q2009 (where the positive effect was muffled by the poor consumer confidence resulting from the global financial crisis).
I have appended below Haio's top-line & bottom-line performance for the past 17 quarters. One can see clearly that Haio's results peaked in 4Q2008 and dropped back for the next 2 quarters before recovering in the past 2 quarters. Can Haio maintain its impressive growth rate in this challenging time? Only time will tell...
Chart 1: Haio's 17 quarterly results
Valuation
Haio (closed at RM4.44 last Friday) is now trading at a trailing PE of 7.2 times (based on last 4 quarters' EPS of 62.3 sen). For a well-managed company, Haio's valuation is undemanding.
Technical Outlook
Despite the strong financial performance, I am a bit wary about this stock. I feel that Haio is rather extended after rising from RM0.80 in early 2006. From the daily chart, I have highlighted the negative cross where the 50-day SMA cut below the 100-day SMA in early-Mar 2008 (denoted as 'A') and the negative golden cross where the 50-day SMA cut below the 200-day SMA in mid-December 2008 (denoted as 'B'). Despite the negative golden cross and the share price dropping below the 200-day SMA, Haio managed a complete recovery in April this year! The positive golden cross has been achieved & share prices are above the 200-day SMA. This complete reversal can be attributed to 2 factors- the strong recovery in Haio's financial performance & the thinly-traded volume of this stock.
One thing to note: Haio may have benefited from its steady share buybacks which commenced in March 2003. Its holding of Treasury shares stood at 1.25 million units as at June 2, 2009. In August 2008, Haio distributed 3.23 million Treasury shares to its shareholders on the basis of 1-for-40. With its strong financial position as at 30/4/2009, where its low gearing stood at 0.1 times, current ratio stood at 1.5 times plus cash balance of RM51 million, Haio can continue with its share buyback for a long while.
Chart 2: Haio's daily chart as at 20090626 (Source: Tradesignum)
Conclusion
Based on improved financial performance & relatively attractive valuation, Haio could be a good stock for long-term investing. Nevertheless, it is not easy to call a buy on this stock at the current level. A good entry is around RM3.50-4.00 but that's not likely to happen any time soon. The dilemma for those who have this stock is equally daunting- to take profit at RM4.50-5.00 or not to take profit.
Friday, June 26, 2009
Integrax- a good long-term investment
Background
Integrax is currently the owner-operator of 2 port facilities- Lumut Maritime Terminal & Lumut Bulk Terminal. In 2006, it diversified into nickel mining business by buying a 20%-stake in the Philippines-based Platinum Group Metals Corp (PGMC) for USD12 mil. PGMC has been experiencing losses due to the collapse in the demand for nickel. In 2008, it shutdown all mining operations except for the Surigao mine as well as idling its smelting plant.
Integrax is negotiating with relevant authorities to develop 2 ports in Aceh, Indonesia at Kuala Langsa and Krueng Guekeh. It is also assessing other ports in Indonesia for acquisition.
Recent Financial Results
Due to the shutdowns in PGMC, Integrax has written off 75% of the carrying value of its investment in PGMC amounting to RM35.2 million in 4Q2008 ended 31/12/2008. This led to a net loss of RM27.2 million for that quarter. Integrax bounds back in 1Q2009 with a net profit of RM7.8 million on a turnover of RM19.9 million.
Table: Integrax's 8 quarterly results
Valuation
Integrax (closed at RM0.69 today) is now trading at a PE of 6.7 times. This is based on its annualized EPS of 10.3 sen. At this multiple, the stock is still attractive.
Favorable Development ahead
Since the last quarterly results announcement, the price of Nickel has been rising since April (see Chart 1). This could be a big positive for PGMC, which could allow the company to re-start its mines & smelting plants again. If this happened, there is a good chance that Integrax may write-back some of the provision for diminution in the value of its investment in PGMC.
Chart 1: Nickel's 5-year price chart (Source: Kitco)
Recently, Vale International SA, the world’s second largest diversified metals and mining company, has agreed to buy 165.5ha in Manjung, Perak, from property developer KYM Holdings Bhd. In addition, Vale had an option to buy another 305.95ha, putting the total amount of land available to Vale at 471.46ha in Manjung. It has was investing RM9bil in an iron ore pelletizing plant on the site. Pelletizing of iron ore is the process of converting the raw ore into pellets with characteristics appropriate for use in a blast furnace. If this plant takes off, the importation of iron ore to the plant will likely to benefit Integrax's existing 2 port facilities- Lumut Maritime Terminal & Lumut Bulk Terminal- significantly. For more, go here.
Technical Outlook
From the monthly chart below, we can see that Integrax has bottomed out in March. The share price has crossed above its 20-month SMA while the monthly MACD & Williams' %R have hooked up. Good entry level is about RM0.60-65.
Chart 2: Integrax's monthly chart as at 25/6/2009 (Source: Quickcharts)
Conclusion
Based on attractive valuation, potential positive development as discussed and bullish technical outlook, Integrax is a good stock for long-term investment.
Dogs of Bursa did not outrun the Bull
On December 26 last year, I posted on an investment strategy known as the Dogs of the Dow (go here). The strategy proposes that an investor annually selects for investment the ten Dow Jones Industrial Average stocks whose dividend is the highest fraction of their price. As dividend payouts are fairly constant through good time & bad time, a follower of the Dogs of the Dow will end up investing in the ten most attractively-priced components of the Dow. Applying the same approach to the Malaysian stock market, one would be looking at the components of FBM30, i.e. the top 30 stocks on Bursa and select the ten top dividend-yielding stocks. As at December 26, these stocks were Digi.com, Maybank, Public Bank, YTLPower, KLKepong, Sime Darby, Berjaya Sport Toto, BAT, Tanjong & Petronas Dagang. Today- six months later- we shall examine how well these stocks have fared. The short answer: Not very well.
The top ten stocks are highlighted in green & blue; the next ten stocks in white & yellow; and the last ten stocks in brown & pink. From this, we can observed the following:
Note: Maybank & Axiata's closing prices as at Dec 26, 2008 have been adjusted to reflected the recently completed Rights Issue.
Table: FBM30 stocks & their return over 6-month period (Dec 26, 2008 to Jun 25, 2009)
Chart 1: KLCI's daily chart as at 20090626_12.14noon (Source: Quickcharts)
From the above, one would be better off investing in an index-linked funds with low management fee. This can be a mutual funds or an ETF. The value of a mutual funds is based on the underlying value of the investment held while the ETF is determined by the market. There is an ETF based on FBM30 & it's called FB30ETF (see Chart 2 below). As at Dec 26, 2008, FB30ETF closed at RM5.71, while its NAV per unit RM5.7042. As at Jun 25, 2009, FB30ETF closed at RM6.79, while its NAV per unit RM6.9623. Between Dec 26, 2008 & Jun 25, 2009, the FB30ETF paid out an income of 6 sen. As such, a person investing in this ETF would gain a return of 20% (based on increase in price from RM5.71 to RM6.79 & an income of 6 sen). On the other hand, if the FB30ETF is a mutual funds, the increase in value is about 23% (based on increase in NAV per unit from RM5.7042 to RM6.9623 plus income distribution of 6 sen). Mutual funds tend to have higher management fee than ETFs.
Chart 2: FB30ETF's daily chart as at 20090626_12.30noon (Source: Quickcharts)
The top ten stocks are highlighted in green & blue; the next ten stocks in white & yellow; and the last ten stocks in brown & pink. From this, we can observed the following:
1) The top ten stocks did not provide outstanding return when compared to the other 20 stocks;
2) Three stocks provided outstanding performance- MMC (100%), Genting (58%) and Commerce (56%); and
3) The under-performers are YTLCorp (-2%), Petronas Gas (0%), MISC (2%) and BAT (2%);
4) The top 30 stocks provide an average return of 24.1% over the past six months. Not surprisingly, this return coincided with the 23.9% gain in KLCI & 23.6% gained in FBM30, during the same period. For KLCI movement, see Chart 1 below. The chart of FBM30 is not appended as there is an error on that chart.
Note: Maybank & Axiata's closing prices as at Dec 26, 2008 have been adjusted to reflected the recently completed Rights Issue.
Table: FBM30 stocks & their return over 6-month period (Dec 26, 2008 to Jun 25, 2009)
Chart 1: KLCI's daily chart as at 20090626_12.14noon (Source: Quickcharts)
From the above, one would be better off investing in an index-linked funds with low management fee. This can be a mutual funds or an ETF. The value of a mutual funds is based on the underlying value of the investment held while the ETF is determined by the market. There is an ETF based on FBM30 & it's called FB30ETF (see Chart 2 below). As at Dec 26, 2008, FB30ETF closed at RM5.71, while its NAV per unit RM5.7042. As at Jun 25, 2009, FB30ETF closed at RM6.79, while its NAV per unit RM6.9623. Between Dec 26, 2008 & Jun 25, 2009, the FB30ETF paid out an income of 6 sen. As such, a person investing in this ETF would gain a return of 20% (based on increase in price from RM5.71 to RM6.79 & an income of 6 sen). On the other hand, if the FB30ETF is a mutual funds, the increase in value is about 23% (based on increase in NAV per unit from RM5.7042 to RM6.9623 plus income distribution of 6 sen). Mutual funds tend to have higher management fee than ETFs.
Chart 2: FB30ETF's daily chart as at 20090626_12.30noon (Source: Quickcharts)
Thursday, June 25, 2009
Market Outlook as at June 25, 2009
The recent correction had brought the KLCI to an intra-day low of 1028 on June 23rd. This is quite close to the level that I have predicted as the objective of an overbought correction in a fairly extended market. In the light of the current strong recovery, we must be wondering whether the worst is over?
To answer that question, let's look at the extremely bullish market from November 2006 to February 2007, which was at the early part of the bull run that started in October 2006 & terminated in January 2008. After the bullish breakout of a rising wedge (aka bearish wedge) at the 985 level in October 2006, the KLCI rallied strongly until it made an intra-day high of 1110 on December 11, 2008. 3 days of correction brought the market down to an intra-day low of 1069 before rebounding to an intra-day high of 1092 on December 18. A sharp 1-day sell-down followed which sent the KLCI to an intra-day low of 1050- before the bull run continued all the way to the January 2008 high of 1524.
Let's look at our recent correction. After an intra-day high of 1095 on June 16, the correction set in. Without any decent rebound in between, it swept the KLCI down to an intra-day low of 1028 on June 23 (exactly 6 days after the correction started).
The 6 days of correction in December 2006 was a great buying opportunity and the recent one may turn out to be the same. Will there be another down-leg? I think it is quite likely there will be sharp pullbacks, though I think the KLCI may not break below the recent low of 1028. Even if it come to that level or surpass that level marginally (say, 10-20 points), I think that one should use the opportunity to accumulate the stocks for long-term investment.
Chart 1: KLCI's daily chart in Dec 2006 & Jun 2009 (Source: Tradesignum)
After scanning through the charts of all the major markets, I observed that the European & the US markets are now below their respective 50-day SMA. Except for Taiwan, Korea & Australia, most of the Asian markets are above the 50-day SMA. Our market is above its 50-day SMA as well as the 20-day SMA after today's rally. The out-performance of the Asian markets will give the bulls & the bears something to chew on; the bulls will view the glass as half-full (i.e. the Asian markets will continue to out-perform the markets of the advanced economies) while the bears will see the glass as half-empty (with more room for these markets to decline).
Chart 2: HSI & STI's daily chart as at 24/6/2009 (Source: Stockcharts.com)
Chart 3: TWII & BSE's daily chart as at 24/6/2009 (Source: Stockcharts.com)
Chart 4: AORD & KOSPI's daily chart as at 24/6/2009 (Source: Stockcharts.com)
Chart 5: DAX & DJIA's daily chart as at 24/6/2009 (Source: Stockcharts.com)
Chart 6: FTSE & CAC's daily chart as at 24/6/2009 (Source: Stockcharts.com)
As at 3.10 pm, the KLCI was up 16.4 points to 1074.3, on relatively thin volume of 1 billion. Gainers outnumbering losers by 458 to 137. I feel that this rebound off the low is overdone & could easily be followed by a sharp pullback. Traders may do well to take some profit in this environment.
Wednesday, June 24, 2009
Topglove's net profit jumped
Background
Topglove just announced its results for 3Q2009 ended 31/5/2009, where its net profit increased by 17% q-o-q or 62% y-o-y to RM42.2 million, while its turnover increased by 7.3% q-o-q or 4.4% y-o-y to RM372 million. The company attributed its better performance to "improvement in cost efficiency, product quality and product mix, and had maintained strong customer relationship to position itself as a market leader".
In press statement accompanying the release of the financial results, the company stated:
Below is the chart showing the steady growth in Topglove's top-line & bottom-line over the past 12 quarter.
Technical Outlook
As noted in an earlier post (here), Topglove has broken above its ascending triangle at RM6.20. With this breakout, I expect Topglove to continue its prior uptrend.
Chart: Topglove's daily chart as at 23/6/2009 (Source: Quickcharts)
Look at other rubber glove manufacturers
Based on the strong growth in Topglove's bottom-line as compared to its top-line, one may conclude that rubber glove manufacturers are enjoying better bargaining power due to demand outstripping supply. The additional plants & equipment coming on stream 9-12 months out may address the imbalance. Until then, many rubber glove manufacturers should report higher profit. You may want to look at other manufacturers in this sector.
Conclusion
Based on improving results & bullish technical outlook, Topglove is a trading BUY.
Topglove just announced its results for 3Q2009 ended 31/5/2009, where its net profit increased by 17% q-o-q or 62% y-o-y to RM42.2 million, while its turnover increased by 7.3% q-o-q or 4.4% y-o-y to RM372 million. The company attributed its better performance to "improvement in cost efficiency, product quality and product mix, and had maintained strong customer relationship to position itself as a market leader".
In press statement accompanying the release of the financial results, the company stated:
The group’s Factory 19, which has 16 new production lines, has started operation early this month. With a total of 355 glove production lines, its production capacity is 31.5 billion pieces a year.
It has also completed the construction of Factory 20 and will start installing 16 new production lines next month. The company said it targeted to complete the installation by February next year.
In addition, the construction of Factory 21 is scheduled to commence in August this year. All the three factories are located in Klang.
Below is the chart showing the steady growth in Topglove's top-line & bottom-line over the past 12 quarter.
Technical Outlook
As noted in an earlier post (here), Topglove has broken above its ascending triangle at RM6.20. With this breakout, I expect Topglove to continue its prior uptrend.
Chart: Topglove's daily chart as at 23/6/2009 (Source: Quickcharts)
Look at other rubber glove manufacturers
Based on the strong growth in Topglove's bottom-line as compared to its top-line, one may conclude that rubber glove manufacturers are enjoying better bargaining power due to demand outstripping supply. The additional plants & equipment coming on stream 9-12 months out may address the imbalance. Until then, many rubber glove manufacturers should report higher profit. You may want to look at other manufacturers in this sector.
Conclusion
Based on improving results & bullish technical outlook, Topglove is a trading BUY.
Monday, June 22, 2009
Random thoughts on Buying stocks
There were a few inquiries as to what would be good buys & their entry level during this period of correction. You may choose from the stocks that were covered earlier in this blog or you may look through your stockbrokers' recommended buy list. You may also want to check out Bursa's e-Research reports, which include some pretty good small & medium-size companies that are normally not covered by stockbrokers (go here). As to how you may execute your buying, I will now look at 2 stocks that had done very well in the recent rally & are currently undergoing some correction. The two stocks are Genting & Resorts.
Genting rose from a recent low of RM3.08 to the high of RM6.10- gaining RM3.02. Based on Fibonacci ratio of 38-50%, we can expect Genting to drop back to RM4.60-95 in a correction. The short-term uptrend line support for Genting is at RM5.40, which is rather high. This is above the 38%-retracement target of RM4.95. If you choose to buy at this uptrend line, you may want to do so very slowly.
Chart 1: Genting's daily chart as at 22/6/2009 (Source: Quickcharts)
On the other hand, you may have less hang-up about buying Resorts at its short-term uptrend line support of RM2.55. Resorts rose from a recent low of RM1.84 to the high of RM2.93- gaining RM1.09. Based on Fibonacci ratio of 38-50%, we can expect Resorts to drop back to RM2.39-52 in a correction. For Resorts, you may accumulate at a faster pace.
Chart 2: Resorts' daily chart as at 22/6/2009 (Source: Quickcharts)
You may choose to play it safe & buy only when this corrective phase is over. That's fine because one can never tell how long & deep a correction may be. In any case, you should continue to track the stocks on your buy list & update them on a regular basis. Some may choose a hybrid system- buy half now & buy the balance when the correction is over. There is no hard & fast rule. If you no time to track the stock market or to identify stocks to invest in, then you should look at unit trusts.
CPO may test its short-term uptrend line support of RM2100
CPO has broken below its neckline support at RM2320 a few days ago. As noted earlier (here), this breakdown of the neckline of the Head & Shoulder formation would likely be followed by a test of the short-term uptrend line support of RM2100.
Chart 1: CPO's daily chart as at June 22, 2009_12.30noon (source: ifs.marketcenter.com)
If the short-term uptrend line is also violated, then CPO may test the horizontal line of RM2000-2010. I think the possibility of it testing the next horizontal line of RM1770-1780 is quite remote at the present moment.
Chart 2: CPO's weekly chart as at June 22, 2009_12.30noon (source: ifs.marketcenter.com)
Based on the above, we can expect more weakness ahead for plantation stocks.
WTIC- the MACD has just hooked down
From the daily chart, we can see that WTIC's MACD indicator has just done a negative cross-under. The last time that we saw this was in late March when WTIC underwent a minor correction-- lasting 4-5 weeks-- with prices dropping back to the 50-day SMA line. It is probable that WTIC may experience a similar correction soon, with the prices pulling back to the 50-day SMA (presently at USD60-62).
Of late, the mainstream has put up many articles on the crude oil price bubble. So, a sharp reversal in WTIC could be a serious psychological blow to investors presently conditioned to higher crude oil prices. This may then lead to an over-reaction & a sharp sell-off in oil & gas stocks. You may want to reduce your position ahead of the crowd.
Chart: WTIC's daily chart as at 19/6/2009 (Source: Stockcharts.com)
Friday, June 19, 2009
Market Outlook as at June 19, 2009
As at 11.00 am, the KLCI is up 2.81 to 1057.22. Out of a total listing of 1227 issues, only 651 were traded. Gainers outnumbered losers 312 to 142, with 197 stocks traded unchanged. Volume traded was 457 million units.
The KLCI may enjoy a rebound from the 20-day SMA line. However, I believe this rebound is likely to be weak & the market may succumb to fresh selling pressure. Looking at the daily chart below, we can make the following observations:
Chart: KLCI's daily chart as at 18/6/2009# (Source: Quickcharts)
While prices are presently much lower than what they were a few days ago, to trade in the market is no easy feat. One has to be nimble & quick to take profits offered or accept any losses suffered. Protective stop is a must.
For those looking to buy for longer term, you may do so slowly now. Deploying 20-25% of the intended sum at this juncture may not be such a bad idea as one can never be too sure where market is headed next. It is certainly a better idea than doing so last week!
Note:
The KLCI may enjoy a rebound from the 20-day SMA line. However, I believe this rebound is likely to be weak & the market may succumb to fresh selling pressure. Looking at the daily chart below, we can make the following observations:
1) MACD, which has done a bearish cross-under a while back, could enter into the negative territory shortly if the recovery does not happen soon. The entry of the MACD into the negative territory would merely confirm the start of a longer & deeper price consolidation*.
2) Willams %R has just broken below its support (near the 50 level). In the past, this would be followed by a price consolidation lasting 2-4 weeks.
3) +DMI for the past 3 months was never euphoric, unlike the -DMI for the period from July to October 2008 which displayed clear sign of panic. However, the ADX for both periods were elevated; thus confirming the underlying strength of the trend. The absence of euphoria in the uptrend for the past 3 months does raise some doubts as to the return of the animal spirit that is so needed to drive the market higher. This is something worth pondering about...
Chart: KLCI's daily chart as at 18/6/2009# (Source: Quickcharts)
While prices are presently much lower than what they were a few days ago, to trade in the market is no easy feat. One has to be nimble & quick to take profits offered or accept any losses suffered. Protective stop is a must.
For those looking to buy for longer term, you may do so slowly now. Deploying 20-25% of the intended sum at this juncture may not be such a bad idea as one can never be too sure where market is headed next. It is certainly a better idea than doing so last week!
Note:
(a) I have appended a link (here) to a very good series of articles on Technical Analysis written by Chip Anderson in Stockcharts.com*. Part 8 of that series dealt with minor downtrend & intermediate downtrend, which could aptly describe the possible price consolidation in our market.
(b) There is a slight error# in the presentation of yesterday data in the chart above. I do not believe that this minor error will significantly alter the reading of the chart.
Thursday, June 18, 2009
UEMLand- a double whammy!!
In the market, our stock occasionally enjoys a boost from good news or suffers a knock from bad news. Not very often does our stock enjoy or suffer a double dosage of good news or bad news. Today, UEMLand suffered a double whammy.
In the morning, we have a newspaper report that the Sales and Purchase Agreement (SPA) between UEMLand and Damac Properties Sdn Bhd for the sale of approximately 17.416 hectares in Puteri Harbour, Nusajaya has lapsed. The sale of the land was for RM396 million cash. More than the lost revenue, the termination of the SPA represents a serious setback to the planned development of Nusajaya.
While investors were digesting this news, another blow came in the afternoon. The Sultan of Johor was reported to be not in favor of the proposed third bridge linking Malaysia and Singapore (go here). This news impact all property-related stocks with substantial exposure to Johor, especially UEMLand, since no one is more closely tied to property development in the state of Johor than UEMLand.
From the chart below, we can see that UEMLand may find support at its 50-day SMA line which coincides with the support of the immediate uptrend line at RM1.45. I expect some support from the horizontal line at RM1.50.
Chart 1: UEMland's daily chart as at 18/6/2009 (Source: Quickcharts)
A few weeks back, a friend asked me what I thought the upper limit of the rally in UEMLand would be. I told her that UEMLand might follow the footsteps of its predecessor, UEMWorld which in turn followed the footsteps of its predecessor, Renong. What I've meant was that UEMland would slowly rise to the RM4.00 level over a period of a few years, but the present rally would probably top off at RM2.00. I do not have the chart of Renong any longer, but I have combined the previous chart of UEMWorld & the current chart of UEMLand. The just-concluded rally in UEMLand would be similar to the run-up in UEMWorld from Feb to May 2006 where the share price rose from RM0.40 to RM2.00 (denoted as 'A'). Thereafter, UEMland would consolidate for many months (maybe even a year or two) like what UEMWorld did from May 2006 to Feb 2007 (denoted as 'B'). Then, a big rally to RM4.00, like what happened in UEMWorld from Feb to May 2007 (denoted as 'C'). The timeline will vary according to corporate development & economic conditions.
Chart 2: The combined daily chart of UEMWorld (up to its delisting on May 25, 2007) & UEMLand as at 18/6/2009(Source: Tradesignum)
So, don't write off UEMLand. It may return with a vengeance... one fine day.
Wednesday, June 17, 2009
US markets may correct further
DJIA joined the rank of stock markets that have violated their 20-day SMA.
Chart: DJIA's daily chart as at 16/6/2009 (Source: Stockcharts.com)
PS- This post was earlier entitled "Calling Plunge Protection Team...". On second thought, I think it is inappropriate. The mission of this team is suppose to be the prevention of a catastrophe, similar to the Black Monday, from hitting the US capital markets. For the unconventional take on the role of this team, check out John Mauldin's article of the same title.
Crude Oil may move sideway for a while
Crude Oil prices have gained nearly 50% since early May. The movement of Crude Oil prices is inversely correlated to the movement of the USD. From Chart 1 below, we can look at the movement of Crude Oil prices (WTIC) & USD index over a 1-year period, divided into 3 phases:
Chart 1: WTIC & USD's daily chart as at 16/6/2009 (Source: Stockcharts.com)
Looking at Chart 2, we can see that WTIC's immediate horizontal line resistance & support are at USD78 & USD68, respectively.
Chart 2: WTIC's daily chart as at 16/6/2009 (Source: Stockcharts.com)
WTIC dropped from its high of about USD150 to its recent low of about USD30- losing USD120 in the process. Applying Fibonacci ratio 38% & 50% for normal retracement of its prior move would mean that WTIC could easily rebound back to about USD76-90. WTIC made a high of USD74 at the beginning of the week. Subsequent weakness in the USD- if it happened further down the road- could cause WTIC to even hit the USD90 mark. From Chart 2 above, we can see that it has strong horizontal resistance at USD86 & thereafter at USD100.
A mild correction in Crude Oil prices should lead to similar correction in Oil & Gas stocks, which have risen handsomely in the past 3 months. If that happened, it would be a good opportunity to buy into this sector which I believe may outperform the general market later on.
1) From Jul to Dec 2008, USD was rising while WTIC was dropping [denoted as 'A'];
2) After a sharp sell-off in USD in early Dec 2008, USD resumed its uptrend but WTIC traded sideway between USD30-50 [denoted as 'B']; and
3) After that, USD entered into its present short-term downtrend, while WTIC rallied. During this period, USD had a corrective move from end Mar to April 2009 against the prevailing downtrend [denoted as 'C-1'] where WTIC reacted by moving sideway. Presently, USD appears to be in another corrective move against the prevailing downtrend [denoted as 'C-2'], and I similarly expect WTIC to move sideway.
Chart 1: WTIC & USD's daily chart as at 16/6/2009 (Source: Stockcharts.com)
Looking at Chart 2, we can see that WTIC's immediate horizontal line resistance & support are at USD78 & USD68, respectively.
Chart 2: WTIC's daily chart as at 16/6/2009 (Source: Stockcharts.com)
WTIC dropped from its high of about USD150 to its recent low of about USD30- losing USD120 in the process. Applying Fibonacci ratio 38% & 50% for normal retracement of its prior move would mean that WTIC could easily rebound back to about USD76-90. WTIC made a high of USD74 at the beginning of the week. Subsequent weakness in the USD- if it happened further down the road- could cause WTIC to even hit the USD90 mark. From Chart 2 above, we can see that it has strong horizontal resistance at USD86 & thereafter at USD100.
A mild correction in Crude Oil prices should lead to similar correction in Oil & Gas stocks, which have risen handsomely in the past 3 months. If that happened, it would be a good opportunity to buy into this sector which I believe may outperform the general market later on.
Tuesday, June 16, 2009
European markets- further correction ahead?
The main European stock markets (FTSE, DAX & CAC) broke below their respective 20-day SMA yesterday. This could be prompted by a sharp drop in Euro of 1.6% overnight (see Chart 1 below). Euro looks vulnerable to looming contagion effect from the developing currency crisis in Latvia.
Chart 1: Euro index's daily chart as at 15/6/2009 (Source: Stockcharts.com)
FTSE, DAX & CAC may attempt to claw back above their respective 20-day SMA today. A failure to do so could signal the start of the much-anticipated consolidation for these markets for the days & weeks ahead.
Chart 2: FTSE's daily chart as at 15/6/2009 (Source: Stockcharts.com)
Chart 3: DAX's daily chart as at 15/6/2009 (Source: Stockcharts.com)
Chart 4: CAC's daily chart as at 15/6/2009 (Source: Stockcharts.com)
CPO to the test the crucial support at RM2320
Since my last post on May 21, where I'd warned about the impending correction in CPO prices, the same has dropped from RM2700 to its current price of RM2400. A close study of the daily chart revealed the price correction has taken the shape of a Head-and-Shoulder (H-&-S) formation. As all chartists are well aware that a reading from a H-&-S formation is a very reliable reading. CPO's future direction lays in the outcome of the test of the neckline of the H-&-S formation. A break below the neckline of an upright H-&-S formation will be a bearish reversal, while a break above the neckline of an inverted H-&-S formation would be a bullish reversal. In the case of CPO, we are awaiting the former, where a bearish reversal would be flagged if CPO prices broke below the RM2320 level. The opposite could happen, whereby CPO prices could rebound off the neckline & march higher.
Chart 1: CPO's daily chart as at June 15, 2009 (source: ifs.marketcenter.com)
If CPO were to break below the neckline of the H-&-S formation, then it would likely to drop to its short-term uptrend line support of RM2100. At lower level, it may find support at the horizontal line of RM2000.
Chart 2: CPO's weekly chart as at June 15, 2009 (source: ifs.marketcenter.com)
Market Outlook as at June 16, 2009
We have observed that the 20-day SMA has provided support to the KLCI in the event of mild correction over the past few months. I expect the same support to be forthcoming in the present correction as well. That support is at 1060-62 level.
Chart 1: KLCI's daily chart as at 16/6/2009_12.30noon (Source: Quickcharts)
A break below the 20-day SMA would mean that we are facing more than a mild correction. If this happened, the KLCI could retreat further to the psychological 1050 level or the 80-week SMA support (currently, at 1045-1047 level). If these supports were also violated, then the KLCI could even test the psychological 1000 level or the 20-week & 50-week SMA support zone (currently, around 991-1007). At this moment, I think this is the most that the KLCI may retreat to if we hold the view that the KLCI as well as most global equity markets have entered into a bullish phase, consistent with the view that the global economy is slowly recovering from the global financial crisis. I would call this "the bull retreat", which is the opposite of the bear rally of April-May 2008.
Chart 2: KLCI's weekly chart as at 16/6/2009_12.30noon (Source: Quickcharts)
At this moment, we have to watch & see whether the KLCI can hold above the 20-day SMA support of 1060. If so, this could be an opportunity to buy some stocks which have been badly sold down. Since the market looks rather extended, we should exercise caution by nibbling slowly instead of buying aggressively.
Monday, June 15, 2009
Asian markets look toppish
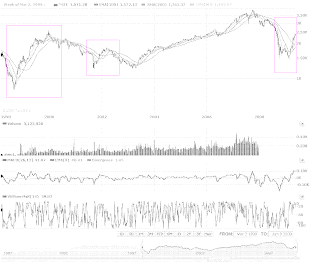
Looking to the Asian stock markets since 1998 up to today, one would be struck by the steep gradient of the current market rally & the ground gained. Of course, this rally was preceded by an extreme market sell-off in 2008. I have appended below the charts for all the Asian markets, except Shanghai (because Yahoo Finance's data stretched back to only 2000). Look through these charts and ask yourself this questions: Can this steep rally sustain? If not, when will the correction come? How much will it pullback? The current rally & previous sharp rallies are highlighted in pink boxes. I believe that the market's upside potential is less than the downside risk and, consistent with my earlier view (here), I believe we should reduce our position accordingly when the price moved in our favor.
Chart 1: TWII's daily chart as at June 8, 2009 (Source: Yahoo Finance)
Chart 2: BSE's daily chart as at June 8, 2009 (Source: Yahoo Finance)
Chart 3: KOSPI's daily chart as at June 8, 2009 (Source: Yahoo Finance)
Chart 4: STI's daily chart as at June 8, 2009 (Source: Yahoo Finance)
Chart 5: N225's daily chart as at June 8, 2009 (Source: Yahoo Finance)
Subscribe to:
Posts (Atom)