Wednesday, April 29, 2015

MPI: Bottom-line jumped

Result Update

For QE31/13/2015, MPI's net profit jumped 25% q-o-q or 188% y-o-y to RM30million. PBT increased q-o-q due to higher revenue from the smartphone sector, strengthening of USD via-a-vis the MYR and lower material costs. Revenue increased q-o-q from RM338.3 million to RM351.3 million while revenue mix shifted by 3 ppt from Asia to USA & Europe by 1 ppt & 2 ppt, respectively.


Table: MPI's last 8 quarterly results


Chart 1: MPI's last 33 quarterly results

Valuation

MPI (closed at RM6.55 yesterday) is now trading at a trailing PER of 15 times (based on last 4 quarters' EPS of 44 sen). At this PE multiple, MPI is deemed fairly valued.

Technical Outlook

From Chart 3, we can see that MPI has broken above the long-term downtrend line at RM4.50 last year.


Chart 2: MPI's monthly chart as at Apr 29, 2015 (Source: ShareInvestor.com)

From the daily chart (Chart 3), MPI has broken its steep uptrend line, SS at RM7.00 last Thursday. While it managed to rebound from the horizontal line at RM6.50, it is unlikely that the stock can climb back above the uptrend line. The best that we can hope for is a consolidation around the price level of RM6.00-7.00.
  

Chart 2: MPI's daily chart as at Apr 29, 2015 (Source: ShareInvestor.com)

Conclusion

Despite the negative technical outlook, MPI is a good stock for medium-term investment based on the good financial performance and reasonable valuation.

Note:
In addition to the disclaimer in the preamble to my blog, I hereby confirm that I do not have any relevant interest in, or any interest in the acquisition or disposal of, MPI.

AEON: Bullish breakout noted

Technical Outlook

AEON has just broken above its triangle, ABC at RM3.20. This followed the upside breakout of its intermediate downtrend line at RM3.10 in mid-April. See Chart 1.


Chart 1: AEON's daily chart as at Apr 29, 2015_2.45pm (Source: ShareInvestor.com)

Similar breakout of the downtrend line was seen in Mar 2014 where the share price rose from RM3.60 to about RM4.10. See Chart 2 below.


Chart 2: AEON's weekly chart as at Apr 29, 2015_2.45pm (Source: ShareInvestor.com)

Recent Results

AEON's latest results for QE31/3/2015 should be out in 1-2 weeks time. Meanwhile if you look at the results for QE31/12/2014, we can see that the NP was marginally lower y-o-y at RM75 million while revenue was up 4% to RM972 million. The last calender quarter, which has always been the best quarter for AEON. as such, we saw a big jump in the bottom-line of 72% over the immediate preceding quarter, despite a small 4%-imcrease in revenue.


Table: AEON's last 8 quarterly results


Chart 3: AEON's last 32 quarterly results

Valuation

AEON (closed at RM3.22 as at 2.45pm today) is now trading at a PE of 21.3 times (based on last 4 quarters' EPS of 5.15 sen). At this PE, AEON is deemed fairly valued. 

Conclusion

Based on good financial performance & bullish technical outlook, AEONCR is still a good stock for trading BUY or medium-term investment. However, its upside may be capped by its high valuation.

Note:
In addition to the disclaimer in the preamble to my blog, I hereby confirm that I do not have any relevant interest in, or any interest in the acquisition or disposal of, AEON.

CPO: Breaking the RM2100 support

As at 11.00am, CPO was trading at RM2084. That's below the strong horizontal support of RM2100. It confirmed the prevailing negative reading from the technical indicators, MACD and Stochastics. Unless a quick recovery happens, CPO may test the psychological RM2000.


Chart 1: CPO's weekly chart as at April 29, 2015_11.00am (Source: iFS.marketcenter.com)

A breakdown in CPO prices would be negative for plantation stocks. The Plantation index - now hanging onto its support at 7700 - may revisit its December 2014 low of 7400.


Chart 2: Plantation's daily cahrt as at April 29, 2015_11.00am (Source: ShareInvestor.com)

Note:
In addition to the disclaimer in the preamble to my blog, I hereby confirm that I do not have any relevant interest in, or any interest in the acquisition or disposal of, CPO or plantation stocks.

Gtronic: Bottom-line improved

Result Update

For QE30/6/2014, Gtronic's net profit increased by 12% q-o-q or 22% y-o-y to RM17 million while revenue was mixed- down 1% q-o-q but rose 6% y-o-y to RM89 million. The higher net profit achieved was mainly due to higher volume loadings from most of the Group's customers, better economy of scale coupled with productivity improvement/cost control program carried out in the Group.

Gtronic is optimistic of achieving satisfactory performance in financial year 2015 by focusing on "escalating up the value chain and riding on the R&D initiatives in new products’ design and development (and) improving the efficiency and cost reduction measures in its Group’s operations to achieve the necessary competitive edge in the market".


Table 1: Gtronic's last 8 quarterly results


Chart 1: Gtronic's last 33 quarterly results
  
Valuation 

Gtronic (closed at RM6.09 yesterday) is now trading at a PE of 25 times (based on last 4 quarters' EPS of 24 sen). At that PE multiple, Gtronic is deemed fairly valued.

Technical Outlook

Gtronic has been in a steady uptrend over the past 3 years- surpassing its recent high as well as its 2000 high.


Chart 2: Unisem's monthly chart as at Apr 28, 2015 (Source: ShareInvestor.com)

However, I believe the stock has reached its target price in the current move. On weakness, the RM5.00 horizontal line should be a good support. 


  Chart 3: Unisem's weekly chart as at Apr 28, 2015 (Source: ShareInvestor.com)

Conclusion

Based on good financial performance & positive technical outlook, Gtronic remains a good stock for long-term investment. Its upside potential is limited as it is trading at fair valuation.

Note: 
In addition to the disclaimer in the preamble to my blog, I hereby confirm that I do not have any relevant interest in, or any interest in the acquisition or disposal of, Gtronic.

Unisem: Bottom-line boosted by exceptional gain

Result Update

For QE31/3/2015, Unisem's NP rose 11% q-o-q or 154% y-o-y to RM23.5 million while was mixed- down 2% q-o-q but up 23% y-o-y to RM280 million. The company attributed the higher net profit for the current quarter to the improved gross profit margin as a result of product mix change and higher utilization rates. In addition, Unisem's bottom-line was boosted by gain on disposal of assets of RM2 million in one of its foreign subsidiaries.


The directors expect the performance of the Group to continue to improve for the second quarter till the end of the financial year with increasing demand seen for our products and services in the smartphone and automotive market segments.


Table: Unisem's last 8 quarterly results


Chart 1: Unisem's last 42 quarterly results

Valuation

Unisem (closed at RM2.43 yesterday) is now trading at a PE of 20 times (based on annualized FY14E EPS of 12.26 sen). At this multiple, Unisem is deemed fairly valued.

Technical Outlook

From Chart 2, we can see that Unisem has been in an uptrend for the past 15-16 months. Its immediate resistance levels are RM2.60 & RM3.00.


Chart 2: Unisem's monthly chart as at Apr 28, 2015 (Source: ShareInvestor.com)

Conclusion

Based on improving financial performance & bullish technical outlook, Unisem remains a good stock for long-term investment. Since it is trading at a PE of 20 times, its upside will be limited.

Note:
In addition to the disclaimer in the preamble to my blog, I hereby confirm that I do not have any relevant interest in, or any interest in the acquisition or disposal of, Unisem.

Tuesday, April 28, 2015

Market Outlook as at April 28, 2015

 A few days ago, I wrote about the strengthening of our Ringgit vis-a-vis the USD, which we can clearly see from the chart below.


Chart 1: USD-MYR daily chart as at April 27, 2015 (Source: XE.com)

I failed to follow through and to call a TAKE PROFIT on many stocks that had benefited from the strengthening of USD-MYR in the past 8-9 months. In a mere few days, we saw sharp drop in the prices of exporters, such as E&E players or furniture makers. This correction has now spread out to second & third liners stocks in general. Since many of these stocks had run up substantially over the past 3-4 months, their correction will be very severe.

Be careful!


Chart 2: FBMFLG's daily chart as at April 28, 2015_3.40pm (Source: ShareInvestor.com)


Chart 3: FBMACE's daily chart as at April 28, 2015_3.40pm (Source: ShareInvestor.com)


Chart 4: FBMEMAS's daily chart as at April 28, 2015_3.40pm (Source: ShareInvestor.com)

Masteel: Audited Accounts Delayed [UPDATED]

Masteel has just announced yesterday that it will not be able to comply with Bursa's Listing Requirement is that all listed companies must "furnish its Annual Audited Financial Statements ("AFS") for the financial year ended 31 December 2014 ... for public release within a period not exceeding four (4) months from the close of the financial year (“Relevant Timeframe”) which falls on 30 April 2015".

If Masteel "fails to issue the outstanding AFS 2014 within five (5) market days after the expiry of the Relevant Timeframe... Bursa Securities shall suspend trading in securities of the Company on 12 May 2015". 

If Masteel "fails to issue the outstanding AFS 2014 within six (6) months from the expiry of the Relevant Timeframe...  Bursa Securities shall commence de-listing procedures against the Company."

However, Masteel "expects its AFS 2014 (to be ready) on or before 11 May 2015, although the Company is working towards the deadline on 30 April 2015". 

Technical Outlook

We can see that Masteel broke its long-term uptrend line, SS at RM0.90 in January this year. It has just broken the tentative support line, AB at RM0.75. I see support at the horizontal lines at RM0.70, RM0.60 & RM0.55. (As at 10:15am, Masteel was trading at RM0.695.)

Chart: Masteel's monthly chart as at April 27, 2015 (Source: ShareInvestor.com)

Account Analysis

It is hard to put any faith in the account of Masteel presently. Nonetheless, we do not have anything else to go on at this point of time.

From Diagram 1 (Cash Flow statement for the past 9 years), we can see that Masteel has generated decent Cash Flow from Operating Activities. The Cash Flow used in Investing Activities has been consistently high and exceeded Cash Flow generated from Operating Activities. The shortfall was covered by Cash Flow generated from Financing Activities (or bank borrowings).

When you compared the 10 years' Profit & Loss account of Masteel and Annjoo, you would notice that Masteel has been profitable for the past 3 years while Annjoo- one of the best managed steel producers in Malaysia- was only breaking even. And, yet you would notice that Annjoo was not adding new Fixed Assets, unlike Masteel. That could be a clue.


Diagram 1: Masteel's 10 years' PL & CF (Source: ShareInvestor.com)


Diagram 2: Annjoo's 10 years' PL & CF (Source: ShareInvestor.com)

I have appended below Masteel's Balance Sheet as at 31/12/2014 & 31/1/2009. I extracted the Balance Sheet for 31/12/2014 & 31/12/2008 and studied the changes in the Balance Sheet. Thee main changes are as follows:
  • Fixed Assets (Properties, Plant & Equipment) increased by RM138 million (net off Prepaid Lease Payment) & Debtors rose by RM197 million.
  • Retained Profit rose by RM109 million.
  • Short-term Borrowings rose by RM151 million while Long-term Borrowings dropped by RM90 million.
  • Creditors rose by RM137 million.

Over 7 years period, Masteel's financial position has deteriorated with Current Ratio dropping from 1.8X to 1.2X while gearing ratio increased from 0.7X to 0.9X. Working capital requirement increased due to longer debtors collection period (from 56 to 83 days) & longer inventory holding period (from 63 to 87 days). (Note: Inventory holding period dropped from 76 days to 43 days).


Table 1: Masteel's Balance Sheet as at 31/12/2014 & 31/12/2009


Table 2: Masteel's Balance Sheet as at 31/12/2014


Table 3: Masteel's Balance Sheet as at 31/12/2009

Conclusion

At this moment, we can only say that Masteel's financial position as reported has deteriorated over the years. It has been operating in the competitive steel sector which has been weighed down by cheap import from China. That Masteel was able to record a profit over the past few years had been a feather in the cap for the company. The delay in submitting its AFS has been a real blow to its shareholders. I personally hope that this is not a serious violation and Masteel will be redeemed itself in the eyes of Malaysian investors soon.

Note:
In addition to the disclaimer in the preamble to my blog, I hereby confirm that I do not have any relevant interest in, or any interest in the acquisition or disposal of, Masteel & Annjoo.

Tenaga: Top-line & bottom-line declined q-o-q

Results Update

For QE28/2/2015, Tenaga's net profit dropped 8% q-o-q but rose 24% y-o-y to RM2.156 billion while revenue was equally mixed - down 3.8% q-o-q but up 6.1% y-o-y to RM10.610 billion. Revenue dropped q-o-q due to 1.4%-drop in demand in both the Peninsula and Sabah.This coupled with the strengthening of the USD via-a-vis the Ringgit resulted in a q-o-q drop in NP.


Table 1: Tenaga's last 8 quarterly results


Chart 1: Tenaga's last 29 quarterly results

Valuation

Tenaga (closed at RM14.58 yesterday) is now trading at a trailing PER of 10.9 times (based on last 4 quarters' EPS of 134 sen). At this PER multiple, Tenaga is deemed fairly attractive.

Technical Outlook

Tenaga is in an uptrend since late 2011. Tenaga broke above its large expanding triangle in late 2013 at RM11.00 to close at a high of RM15.08 on January 26. From the chart, we can see that Tenaga's MACD is showing signs of topping out as follows:
1. The MACD histogram is approaching zero
2. The MACD is poised to cut below the MACD signal line
The other thing to note is that Tenaga & its 10-m SMA line and 20 & 30-m EMA lines are all spread out. That's the same pattern you may notice when Tenaga peaked in 2000 & 2007.

Finally, you may notice the sharp rally on February 4 which pushed the stock to an intra-day high of RM16.96. If Tenaga were a small-cap stock - it is not - I would interpret this unusual price action as an attempt by a large shareholder to distort the technical reading. After reading the many articles on the subject of the 2010 flash crash, I believe anything is possible in the world of finance these days!


Chart 3: Tenaga's monthly chart as at April 27, 2015 (Source: ShareInvestor.com)

Conclusion

Based on good financial performance, attractive valuation and positive technical outlook (albeit signs of weakness), Tenaga remains a good stock for long-term investment. However, you may want to consider SELLING INTO STRENGTH for reasons noted above.

Note:
In addition to the disclaimer in the preamble to my blog, I hereby confirm that I do not have any relevant interest in, or any interest in the acquisition or disposal of, Tenaga.

Monday, April 27, 2015

USD: Looking toppish

USD index has formed a "flag" ("ABCD"). The indicators are negative, with MACD cutting below the MACD signal line earlier and now fast approaching the zero line plus the ADX dropping below 20 (signaling weakness in the uptrend). If USD index were to drop below the lower liner ("BD"at 96), the flag formation will turn into a double top reversal. Thus the uptrend in USD index would be over.


Chart 1: USD Index's daily chart as at April 24, 2015 (Source: Stockcharts.com)

The weekly chart below also shows weakness in the uptrend, with MACD just cutting below the MACD signal line and the ADX weakening alongside a declining +DI and a rising -DI. We can see the USD index has been well-supported by the 10-week SMA line since the rally began in July 2014. The 10-week SMA line (currently at 97) will be another important marker to check for the direction of USD index for the next few days or weeks.


Chart 2: USD Index's weekly chart as at April 24, 2015 (Source: Stockcharts.com)

The question is why is USD weakening now. Is it due to technical reason, such as overbought? Or, is it due to economic weaknesses which may delay the much-anticipated monetary tightening in the US? We will have to wait & see.

KKB: bottom-line soared

Results Update

For QE31/3/2015, KKB's net profit increased by 220% q-o-q or 602% y-o-y to RM26.7 million while revenue rose 16% q-o-q or 80% y-o-y to RM75.7 million.
The  overall  improved revenue  and operating results was mainly driven by the Group’s Steel Pipe manufacturing business and Steel Fabrication division.


The Steel Fabrication division recorded a revenue of RM10.4 million (4Q15: RM5.9 million, 1Q14: RM19.5 million) which were derived from the additional, balance on-going projects involving the fabrication of structural steel works for Petronas LNG Train 9 Project, the fabrication of steel frame works for CMS Clinker Plant, the supply of Low/High Tension Steel Poles and subcontract works for the fabrication of platforms.

The Steel Pipes manufacturing business under the two subsidiary companies, recorded an aggregate revenue of RM62.3 million (4Q15: RM55.6 million, 1Q14: RM16.5 million). The increased revenue is attributed from the on-going supply of Polyurethane Lined Mild Steel Pipes and other short notice pipe supplies.


Table 1: KKB's last 8 quarterly results


Chart 1: KKB's 31 quarterly results

Valuation

KKB (closed at RM1.64 yesterday) is trading at a trailing PE of 9.6 times (based on last 4 quarters' EPS of 17 sen). At this multiple, KKB is reasonably valued. It can command a PE of 12 times.

Technical Outlook

KKBhas rebounded off the lower line of an expanding triangle- a fairly irregular price formation. It is possible, though not probable, that KKB may go to test the upper line of the triangle (at RM3.00).


Chart 2: KKB's weekly chart as at April 27, 2015 (Source: ShareInvestor.com)
 
Conclusion

Based on improved financial performance, fairly attractive valuation & mildly positive technical outlook, KKB could be a good stock to consider for investment.

Note:
In addition to the disclaimer in the preamble to my blog, I hereby confirm that I do not have any relevant interest in, or any interest in the acquisition or disposal of, KKB

Friday, April 24, 2015

Tuneins: Tested the horizontal support at RM1.80

Tuneins tested its strong horizontal support at RM1.80 over the past 5 days. It went below that support to a low of RM1.77 yesterday & the day before that. Today, it climbed back above the RM1.80 mark. As at 4.35pm, it was trading at RM1.85.

Based on the above observation, I believe Tuneins support at the RM1.80 horizontal line is good. It could begin to recover from here.


Chart: Tuneins's weekly chart as at April 24, 2015_4.00pm (Source: Share Investors)

Note: 
In addition to the disclaimer in the preamble to my blog, I hereby confirm that I do not have any relevant interest in, or any interest in the acquisition or disposal of, Tuneins.


Harbour: May have a bullish breakout

Result Update

For QE31/12/2014, Harbour's net profit rose 15% q-o-q or 99% y-o-y to RM13 million while revenue was mixed - down 6% q-o-q but rose 19% y-o-y to RM128 million.


Table 1: Harbour's last 8 quarterly results

Bottom-line has improved y-o-y due to the logistics services and equipment rental division reporting higher profit before tax of RM12.866 million (cf RM6.542 million last year) which offset a slump in PBT from the engineering works division - from RM2.887 million to RM0.916 million - due to a sharp drop in revenue from RM24.829 million to RM11.817 million. The 1H2015 & 1H2014 segmental results are tabulated below:


Table 2: Harbour's segmental results for 1H2015 & 1H2014

Harbour's top-line, bottom-line & profit margin have grown steadily over the past 5 years.


Chart 1: Harbour's last 30 quarterly results

(Note: The next quarterly result for QE31/3/2015 should be out in mid-May.)  

Valuation

Harbour (closed at RM1.79 yesterday) is trading at a PE of 7.8 times (based on my projected EPS of 23 sen). At this multiple, Harbour is deemed fairly attractive. It could command a PE of 10 times- giving the stock an upside potential of 25%.

Technical Outlook

Harbour has broken above its downtrend line, RR at RM1.70. With this breakout, Harbour may move sideways or it may begin to rise.

 
Chart 2: Harbour's weekly chart as at April 24, 2015_3.00pm (Source: Share Investors) 

Conclusion

Based on good financial performance, reasonable valuation & mildly positive technical outlook, Harbour is still a good stock for long-term investment.

Note: 
In addition to the disclaimer in the preamble to my blog, I hereby confirm that I do not have any relevant interest in, or any interest in the acquisition or disposal of, Harbour.

PMetal: Knocked down by Chinese duties waiver

PMetal dropped 36 sen to RM2.88 due to concern that its aluminium products may be affected by Chinese scrapping of export duties on aluminium bars and rods. However, the Chinese aluminium bars which have ASP of RM2300 per tonne would be hard-pressed to match the international prices of aluminium bars at RM1970 per tonne. Thus the impact on PMetal may be muted.

PMetal broke above its immediate downtrend line at RM3.15 in March and rallied to a high of RM3.50 recently. I expect PMetal to find support at the horizontal line at RM2.85.


Chart 1: PMetal's daily chart as at Apr 24, 2015_3.00pm (Source: ShareInvestor.com)


Chart 2: PMetal's weekly chart as at Apr 24, 2015_3.00pm (Source: ShareInvestor.com)

Note:
In addition to the disclaimer in the preamble to my blog, I hereby confirm that I do not have any relevant interest in, or any interest in the acquisition or disposal of, PMetal.

Thursday, April 23, 2015

MYR: Strengthening against USD

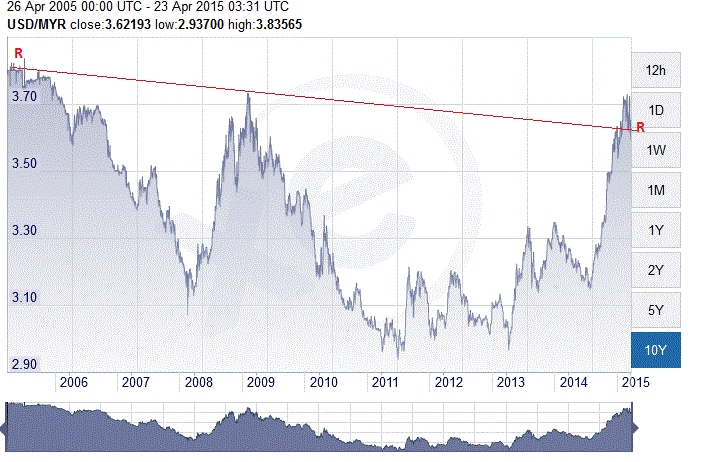
Looking at Chart 1, we can see that USD/MYR has just broken its uptrend line, SS support at 3.65. At the same time, USD/MYR has broken below the line connecting the recent peaks in 2005 & 2008, which is the resistance-turned-support at 3.65 (see Chart 2). This means that USD/MYR is likely drift down to 3.50 or 3.35 over the next 3-6 months.


Chart 1: USD/MYR's weekly chart as at April 22, 2015 (Source: XE.com)


Chart 1: USD/MYR's monthly chart as at April 22, 2015 (Source: XE.com)

The drop in USD/MYR may not be attributable to the strengthening of our Ringgit. It is likely to be the weakening of the US Dollar, which has a fine rally over the past 12-15 months. If we look at Chart 3, we can see that SGD/MYR is still in the uptrend with support at 2.68. Then again, SGD/MYR has been in an upward channel for the past 10 years (see Chart 4). The immediate support & resistance at 2.50 & 2.75, respectively.


Chart 3: SGD/MYR's weekly chart as at April 22, 2015 (Source: XE.com)


Chart 4: SGD/MYR's monthly chart as at April 22, 2015 (Source: XE.com)

Meanwhile we can see that the downtrend for JPY/MYR may be over while EUR/MYR may find support at 3.80.


Chart 5: JPY/MYR's monthly chart as at April 22, 2015 (Source: XE.com)


Chart 6: EUR/MYR's monthly chart as at April 22, 2015 (Source: XE.com)

Going forward, I believe our Ringgit is likely to strengthen in line with the improvement in the prices of crude oil, which is a very important export commodity for Malaysia. 

Tienwah: Approaching the sweet spot

Result Update

For QE31/12/2014, Tienwah reported a net loss of RM1.8 million due to lower revenue plus one-off sales rebate and retrenchment expenses totaling RM6.8 million. This is the second year that the company had carried out retrenchment exercise. In QE31/12/2014, Tienwah was impacted a provision of redundancy expenses of RM2.8 million for staff in a subsidiary.

Tienwah should be reporting its financial result for QE31/3/2015 in the middle of May. I believe that the bottom-line should be positive. Since the share price has dropped from RM2.70 in early 2014 to a base of RM1.85, this could be a good time to buy into this stock.


Table: Tienwah's last 8 quarterly results


Chart 1: Tienwah's last 32 quarterly results

Valuation

Tienwah (closed at RM1.86 yesterday) is trading at a PE of 10 times (based on my projected EPS 18 sen). At this PE, Tienwah is deemed fairly valued. However, Tienwah has a decent DY of 3.8% and trades at a PBR of 0.8 time. The decent DY makes it a good income stock while the PBR of 0.8 time gives the stock a reasonable margin of safety.

Technical Outlook

Tienwah has been in a gradual downtrend since the beginning of 2014. This downtrend has brought the share price down from a high of RM2.70 to a base of RM1.85.


Chart 1: Tienwah's daily chart as at April 22, 2015 (Source: Share Investors)

From the monthly chart, we can see that the stock is however in a long-term uptrend with support at RM1.70.

 
Chart 3: Tienwah's monthly chart as at April 22, 2015 (Source: Share Investors) 

Conclusion

Based on strong technical support & reasonable valuation, Tienwah is still a good stock for long-term investment. Its poorer financial performance is a negative factor but the company is downsizing to achieve better result ahead.

Note: 
In addition to the disclaimer in the preamble to my blog, I hereby confirm that I do not have any relevant interest in, or any interest in the acquisition or disposal of, Tienwah.