Monday, June 20, 2011
RHBCap- the poker game has just started
The news that Abu Dhabi Commercial Bank (ADCB) is selling its 25 per cent stake in RHB Capital Bhd (RHBCap) to Aabar Investments PJSC, a sister company of ADCB at a price "close to RM11" each may throw a spanner in the works by Maybank & CIMB to acquire RHBCap. For more, go here.
Prior to this news, the market was expecting an offer price for RHBCap to be in the range between RM10.16 and RM10.60 a share (based on a price-to-book value of 2.1 times). Would Maybank & CIMB be keen to bid for RHBCap at this new price? The market is now concerned that Maybank & CIMB may not proceed with the proposed acquisition since the price is too high.
RHBCap dropped 19 sen to close at RM9.56 today. It may test its uptrend line support at RM9.47 and if this support is violated, it may test the gap at RM9.37. A breakdown of these two support levels would bring on more selling & further downside to the stock. However, these twin support levels could be a good entry to this stock if you believe that the sale of the RHBCap (or RHB & other units within the group) is still a possibility. Needless to say, RHBCap- like any other M&A play- is a high risk trade. The higher selling price could be viewed negatively as a hurdle or positively a higher return if the deal is consummated.
Chart: RHBCap's daily chart as at June 20, 2011 (Source: Quickcharts)

Saturday, June 18, 2011
Topglov- earning stabilized
Results Update
Topglov announced its results for QE31/5/2011 yesterday. Its net profit inched up marginally by 1% q-o-q to RM25.6 million n the back of a 10%-increase in turnover to RM535 million. Compared to the same quarter last year, its net profit dropped by 60% while turnover was off by 4%. Topglov explained its steadier q-o-q performance as follows:
Despite the ongoing headwinds of high latex price and weaker US dollar, the Group managed to show an improvement in PBT. The continuous price revision on latex glove prices and the long-standing business relationship with its customers had enabled it to seek their understanding in passing on part of the increased raw material costs to them, which enabled it to reduce the impact on the PBT.

Table 1: Topglov's last 8 quarterly results

Chart 1: Topglov's last 20 quarterly results
Valuation
Topglov (closed at RM5.26 yesterday) is now trading at a PE of 24 times (based on last 4 quarters' EPS of 21.38 sen). At this PE multiple, Topglov is over-valued. If there is no improvement in its earning soon, Topglov's PE multiple would roll over & the share price would come tumbling down. However, this doesn't seem to be the reflected in the price chart.
Technical Outlook
Despite the deterioration in its financial performance over the past 4-5 quarters, the over-valuation as well as the recent negative news on the hike in natural gas prices, Topglov has been holding very well above the RM5.00 mark. The dichotomy between the fundamental forces & the technical picture shows the stock has strength.
Looking at Chart 2, Topglov is trading within an ascending triangle. Since prices have moved very close to the apex of the triangle, a moment of decision is coming up. The price could either break upward or downward. If the market cannot decide, then the price will continue to trade sideway & exit the apex at RM5.30-5.40 level. If so, Topglov would enter into a trendless or sideway trading. On the other hand, a breakout in either direction would point the price direction for the next few weeks or months to come.

Chart 2: Topglov's daily chart as at June 17, 2011 (Source: Tradesignum)
From the monthly chart (Chart 3), we can see that Topglov is still quite far above the 40-week SMA line (equivalent to 200-day SMA line) as well as the long-term uptrend line. These 2 lines would provide support at RM4.00-4.10 level in the event of a breakdown in Topglov.

Chart 3: Topglov's monthly chart as at June 1, 2011 (Source: Tradesignum)
Conclusion
As noted, the stock is holding very well at the present price level of RM5.00-5.40 despite the barrage of negative news. Technical analysts look to this positive reaction as a sign of strength. As such, I would recommend to those who have the stock to HOLD. I cannot recommend a BUY as the stock is overvalued & it has poor visibility.
Friday, June 17, 2011
Malton- a unique trading opportunity
One reader inquired earlier about Malton's Rights Issue of RCSLS which come with free warrant & bonus share. My reply was as follow:
Now, one of my client asked me what to do with his allotted Malton-LR, which currently trading at 16.5 sen. Malton is trading at 53.5 sen. I calculated the value of Malton new warrant, Malton RCSLS and the expected P&L from subscribing for the Rights Issue.

The computation is based on the following assumptions:
1) Warrant, which has an exercise price of RM1.00, is valued using conversion premium ranging from 15% to 20%, depending on share price. Negative intrinsic value is ignored.
2) Malton RCSLS is equivalent to share price since it is convertible 1-to-1.
Based on the above table, I advise him not to subscribe for the Rights but to sell the Rights at the current price of 16.5 sen. In fact, I further advise him that he should consider using the proceed to buy the share now. Why?
As I have said before, the trading of Rights tends to result in arbitraging activities, where shareholders would sell their shares & buy the Rights. Unfortunately, the share price dropped more, leading to a drop in the Rights traded. Normally, this would lead to a vicious cycle of further drop in share price & the traded Rights. I believe something similar also took place in Malton share trading over the past few days, with the net result being the drop in the share price & concurrently the drop in the price of Malton-LR. After ceasation of trading of Malton-LR, the share price would slowly recover back. Sometime, the recovery can be pretty sharp which may be a tradable situation. The rebound in the share price is partly due to reversion to the mean as well as some pushing of share price in the market to induce the hesitant shareholders to commit to the Rights Issue. If you choose to buy the share now, using the proceed from the sale of Malton-LR, you are effectively getting into Malton at a lower basis cost. Assuming you were holding onto 5000 Malton before the ex-date, you would be given 2000 Malton-LR. If you sell off your allotment, you would receive RM330. Then, you buy 5000 Malton at 53.5 sen, your net cost would be RM2345 [(53.5 x 5000) - 330]. Your basis cost would be 46.9 sen per unit. At this lower cost, you would be ready to sell in 2 weeks time when the share price recover from the present low.
Good luck.
MALTON has gone ex for a Rights Issue of 2 RCSLS of RM1.00 each [c/w 2 free warrant & 1 free share] for every 5 MALTON owned on ex-date. If you subscribed for the RCSLS, you would get the free warrant & share. If you don't, you get nothing.
The RCSLS is convertible to share on 1-to-1 basis. Since you are paying RM1.00 for each RCSLS, you are sure to be at a loss but the issuer sweetened the deal by giving you 2 warrant & 1 share free. Would that be sufficient to make up for the loss? The bonus share is worth 50-60 sen. The warrant is worth 10-12 sen (assuming a 20% premium & ignoring the negative intrinsic value as the exercise price is at RM1.00). If you used the lower numbers, 2 warrants plus 1 share are worth 70 sen. If you were to use the higher numbers, they are worth 84 sen. Your RCSLS is probably worth 50-60 sen- which will give you a loss of about RM0.80-1.00 for 2 RCSLS. Some may opined that the RCSLS should attract a higher value, due to the high coupon rate of 6%. I doubt it would be worth more than 60 sen, if the share is trading at 50-60 sen. (Currently, it is trading at RM0.52). As such, the exercise has a high odd against a profitable outcome for someone subscribing for the RCSLS, ranging from a small profit of 4 sen to a sizable loss of 30 sen for every 2 RCSLS subscribed. It is better to buy the RCSLS or the warrant after the whole exercise has been completed.
Now, one of my client asked me what to do with his allotted Malton-LR, which currently trading at 16.5 sen. Malton is trading at 53.5 sen. I calculated the value of Malton new warrant, Malton RCSLS and the expected P&L from subscribing for the Rights Issue.

The computation is based on the following assumptions:
1) Warrant, which has an exercise price of RM1.00, is valued using conversion premium ranging from 15% to 20%, depending on share price. Negative intrinsic value is ignored.
2) Malton RCSLS is equivalent to share price since it is convertible 1-to-1.
Based on the above table, I advise him not to subscribe for the Rights but to sell the Rights at the current price of 16.5 sen. In fact, I further advise him that he should consider using the proceed to buy the share now. Why?
As I have said before, the trading of Rights tends to result in arbitraging activities, where shareholders would sell their shares & buy the Rights. Unfortunately, the share price dropped more, leading to a drop in the Rights traded. Normally, this would lead to a vicious cycle of further drop in share price & the traded Rights. I believe something similar also took place in Malton share trading over the past few days, with the net result being the drop in the share price & concurrently the drop in the price of Malton-LR. After ceasation of trading of Malton-LR, the share price would slowly recover back. Sometime, the recovery can be pretty sharp which may be a tradable situation. The rebound in the share price is partly due to reversion to the mean as well as some pushing of share price in the market to induce the hesitant shareholders to commit to the Rights Issue. If you choose to buy the share now, using the proceed from the sale of Malton-LR, you are effectively getting into Malton at a lower basis cost. Assuming you were holding onto 5000 Malton before the ex-date, you would be given 2000 Malton-LR. If you sell off your allotment, you would receive RM330. Then, you buy 5000 Malton at 53.5 sen, your net cost would be RM2345 [(53.5 x 5000) - 330]. Your basis cost would be 46.9 sen per unit. At this lower cost, you would be ready to sell in 2 weeks time when the share price recover from the present low.
Good luck.
US Markets at a Crossroads
We have mentioned in early June that the US stock markets are likely to weaken (here). In the past 2-3 weeks, we have seen those markets dropping to the uptrend line support at 11800 for DJIA & 2600 for the Nasdaq Composite index. Can this support prevail?
For DJIA, the uptrend line support coincides with the 40-week SMA line (the equivalent of the 200-day SMA line) at 11750. This strong support was severely tested over the past 3 days & it is still holding. The last time, DJIA broke an uptrend line in April 2010, it dropped about 1000 points and then traded between 9700 & 10700 for 4 months. So, if the 11750-11800 support failed this time, DJIA could drop 1000 points into the trading band of 10750-11500 & trade therein for the next few months.

Chart 1: DJIA's weekly chart as at June 16, 2011 (Source: Stockcharts)
Nasdaq Composite index is holding onto its uptrend line support at 2600. It broke its 40-week SMA line (equivalent to the 200-day SMA line) at 2662. The last time, Nasdaq broke an uptrend line in April 2010, it loat about 200 points and then traded between 2100 & 2300 for 4 months. So, if the 2600 support failed this time, Nasdaq could drop 200 points into the trading band of 2340-2540 & trade therein for the next few months.

Chart 2: Nasdaq's weekly chart as at June 16, 2011 (Source: Stockcharts)
Some technical analysts are pretty bullish on the markets. They believe the uptrend support will hold and this could be a buying opportunity. They opined that this is a correction & not a bear market (here). On the side of fundamental analysis, we have Rober Shiller who thinks that stocks & real estate are over-valued (here) while Credit Suisse thinks that it's time to buy equities again (here).
My gut feeling is that we are going to see a repeat of April 2010, i.e. a breakdown of the uptrend line, to be followed by a 10%-drop from there & range-bound trading for the next few months (as outloned above).
Thursday, June 16, 2011
Muhibah- further thoughts on a trade that went wrong
Looking at Muhibah's detailed Financial Statements for QE31/3/2011, I must admit that there is two glaring items that I have overlooked- the Receivables of RM903.6 million & the Amount Owing by Contract Customers of RM386.6 million. If the latter is offset against the Amount Due to Contract Customers of RM256.6 million, then the total sum owing by Debtors and Contract Customers would be RM1.034 billion. Compared that with the turnover for QE31/3/2011 of RM394.3 million, Muhibah's Debtors' Collection Period is about 239 days. That's a serious problem.
If 20% of the above amount were to turn bad, the loss would be RM207 million. That would reduce Muhibah's Shareholders' Funds to RM372 million and push up its Debts to Equity ratio to 1.2 times. Based on the research note from Kenanga, it seems that the amount to be written off from one customer, APH is about RM370 million. As a result, Muhibah's Shareholders' Funds would be reduced to RM209 million and its Debts to Equity ratio pushed up to 2.1 times. If I paid more attention to these two items, I would not have posted on Muhibah. However, I wish to point out that my post did not end with an unqualified recommendation to buy. To wit:
Nevertheless, I would like to apologize for anyone who has gone into this trade because of the post, especially since I failed to highlight the severe Debtors' Collection problem experienced by Muhibah.
If 20% of the above amount were to turn bad, the loss would be RM207 million. That would reduce Muhibah's Shareholders' Funds to RM372 million and push up its Debts to Equity ratio to 1.2 times. Based on the research note from Kenanga, it seems that the amount to be written off from one customer, APH is about RM370 million. As a result, Muhibah's Shareholders' Funds would be reduced to RM209 million and its Debts to Equity ratio pushed up to 2.1 times. If I paid more attention to these two items, I would not have posted on Muhibah. However, I wish to point out that my post did not end with an unqualified recommendation to buy. To wit:
Although trading at a high PE multiple & having a relatively weak financial position, Muhibah is a stock worth tracking. Its financial performance has improved steadily over the past 4 quarters. More improvement is likely given the activity in the construction and O&G sectors. The main selling point of this stock is the improvement in the technical outlook. The stock is almost at the point of starting its next upleg.
Nevertheless, I would like to apologize for anyone who has gone into this trade because of the post, especially since I failed to highlight the severe Debtors' Collection problem experienced by Muhibah.
Muhibah- feel the wrath of a hungry bear!
What happened in Muhibah today is depressing. You have an upside breakout which was swiftly followed by a selldown. This is not the exception. We have seen quite a number of such bull trap sprung on traders in the past few weeks. Be careful out there. With each passing day, one feels the wrath of a hungry bear breathing down your neck.
Back to Muhibah- we can expect support at the medium-term uptrend line at RM1.55-1.60 and the 100-day SMA line at RM1.60 (so soon!!!). Overhead resistance at horizontal line of RM1.65 & then RM1.75. Since the play is over, we should aim to sell into this rebound. Aim for RM1.75 or near to it.

Chart: Muhibah's 30-min chart as at June 16, 2011_12.00pm (Source: Quickcharts)
Note: The drop in Muhibah is attributable to the downgrading of this stock by a few research houses. One of them is Kenanga, which posited:
News reported that CIMB Bank is pulling out the financing for APH. This could lead the potential write off for Muhibbah amount due from APH amounted up to RM370m as per audited account 2010. Based on the report, to date APH has drawn down up to RM840m loan from the RM1.4b bridging loan facility by CIMB, which secured in 2006. At present, APH’s main shareholders are KIC Sdn Bhd (40%), PTP Sdn Bhd (35%) and Trek Perintis Sdn Bhd (15%). We view this news as negative to Muhibbah in the short-term. As such, we downgrade our call from BUY to HOLD (due to the uncertainties) but maintain our Target Price of RM2.24, as we keep our forecast unchanged at this juncture, pending for further clarification on the issue.
Wednesday, June 15, 2011
Hexagon- tough times never last or never end?
Background
Hexagon Holdings Bhd ('Hexagon') is involved in many businesses, which are grouped 3 broad divisions:
1) Engineering & Design
2) manufacturing & Distribution
3) Trading & Services
Recent Financial results
Since 2008, Hexagon's financial results can only be described as unexciting. In FYE31/3/2011, that pedestrian performance took a turn for the worse. Its turnover dropped 21% from RM414.3 million to RM326.8 million, which led to a 43%-decline in gross profit from RM65.0 million to RM37.3 million. This level of gross profit was insufficient to cover overhead expenses and the company incurred an operating loss of RM33.5 million. This compared to a small operating profit of RM2.5 million recorded for FYE31/3/2010. Net losses increased from RM4.4 million to RM47.0 million.
It must be noted that the company made a provision of RM12.6 million for FYE31/3/2011 (of which RM12.3 million was booked in during QE31/3/2011). Would there be more provision or write-off in the future?

Table 1: Hexagon's past 8 quarterly results

Chart 1: Hexagon's last 16 quarterly results
Financial Position
Hexagon's financial position as at 31/3/2011 is very weak. Its leverage is excesssive as reflected by debts to equity ratio of 3.6 times. At the same time, its liquidity is tight with current ratio of 1.1 times.
What is worrying is the deterioration in the debtors' collection period, which had steadily risen from 181 days as at 31/3/2009 to 225 days as at 31/3/2011. While it is not unusual to have some debtors dragging out the settlement of their debts to 4-6 months, Hexagon's debtors seems to be setting a new record. To be sure, a longer than usual debtors' collection period raises concern about quality of some of the debts. Was a write-off of RM12.6 million in FYE31/3/2011 a reasonable sum as compared to the debtors of RM201 million as at 31/3/2011? Poor quality of high debtors (or account receivable) coupled with high leverage is a serious sign of danger. Assuming a further write-off of 20% (or RM40 million), Hexagon's debts to equity was soared to 8 times! Since Hexagon's debts are mostly short-term debts, any banker recalling its facilities could trigger a default.

Table 2: Hexagon's financial ratio as at 31/3/2011, 31/3/2010 & 31/3/2009

Table 3: Hexagon's Balance Sheet as at 31/3/2011, 31/3/2010 & 31/3/2009
Valuation
Hexagon (closed at RM0.23 yesterday) is trading at a Price to Book of 0.6 times.
Technical Outlook
Hexagon is in a downtrend line, with resistance at RM0.50-0.52. On May 31, it broke below the horizontal line RM0.40 and touched a low of RM0.18. Yesterday, the stock has a rebound which hit a high of RM0.27. This rebound will face strong resistance at the horizontal line of RM0.40 & the downtrend line at RM0.50-0.52. Instead of buying into this stock, those holding position in it should try to sell into strength.

Chart 2:Hexagon's weekly chart as at June 15, 2011 (Source: Quickcharts)
Conclusion
Based on the poor financial performance & financial position plus bearish technical outlook, Hexagon is a stock to be avoided.
RCECap- caught in a tight spot
Background
RCE Capital Bhd ('RCECap') is a non-financial institution player in the niche credit cooperative market. Its core business is in the provision of personal loans through strategic tie-ups with cooperatives. It also provides short-term financial solutions, such as factoring and confirming facilities, to corporate clients. In addition to its financing business, RCECap also has investments in AmFIRST Real Estate Investment Trust and properties, which allows it to enjoy some recurring income.
Recent Financial Results
For QE31/3/2011, RCECap's net profit dropped by 49% q-o-q or 27% y-o-y to RM16.6 million while turnover declined by 24% q-o-q or 10% y-o-y to RM59 million. The lower top-line & bottom-line was attributable to lower disbursements by the loan financing division. Loan & receivables dropped by RM60.9 million, from RM1.147 billion as at 31/12/2010 to RM1.086 billion as at 31/3/2011. Could a drop of 5.3% in loan outstanding contributed to such a severe impact on the bottom-line as well as the top-line? Look at Chart 1 below. I believe two things happened:
Unless the interest rate regime & the competitive environment changes, I expect this same pattern to persist, resulting in further decline in RCECap's bottom-line.

Table 1: RCECap's past 8 quarterly results

Chart 1: RCECap's last 16 quarterly results (plus profit margin trend)
Financial Position
RCECap's financial position is deemed satisfactory as at 31/3/2011, as reflected in its current ratio of 1.30 times & debts to equity of 2.64 times. RCECap, being a finance company, is expected to operate with a leverage of 2-3 times.
Valuation
RCECap (closed at RM0.53 yesterday) is trading at a PE of 6.2 times (based on annualized EPS of 8.48 sen). While this PE multiple looks attractive, I believe the market is expecting further deterioration in RCECap's earning and is pricing this into the share price. As such, I believe that RCECap could be a value trap- a stock that looks relatively cheap but it will stay cheap. Others may hold differing opinion, such as RHB research which valued the stock at RM1.10 (here).
Technical Outlook
I drew a price band onto the price chart of RCECap. For the near term, I expect RCECap to trade within a band of RM0.40 & RM0.60.

Chart 2: RCECap's weekly chart as at June 15, 2011 (Source: Quickcharts)
Conclusion
Based on concern for further deterioration in its financial performance & poor technical Outlook, I believe RCECap is a stock to be avoided. If you are presently holding this stock, I would recommend a sell into strength when the share price approaches the RM0.60 level.
RCE Capital Bhd ('RCECap') is a non-financial institution player in the niche credit cooperative market. Its core business is in the provision of personal loans through strategic tie-ups with cooperatives. It also provides short-term financial solutions, such as factoring and confirming facilities, to corporate clients. In addition to its financing business, RCECap also has investments in AmFIRST Real Estate Investment Trust and properties, which allows it to enjoy some recurring income.
Recent Financial Results
For QE31/3/2011, RCECap's net profit dropped by 49% q-o-q or 27% y-o-y to RM16.6 million while turnover declined by 24% q-o-q or 10% y-o-y to RM59 million. The lower top-line & bottom-line was attributable to lower disbursements by the loan financing division. Loan & receivables dropped by RM60.9 million, from RM1.147 billion as at 31/12/2010 to RM1.086 billion as at 31/3/2011. Could a drop of 5.3% in loan outstanding contributed to such a severe impact on the bottom-line as well as the top-line? Look at Chart 1 below. I believe two things happened:
1) To compete effectively against new comers, such as MBSB, RCECap lower the interest rate chargeable on its clients. This explained why its turnover, which is interest receivable, dropped faster than the decline in loan outstanding; and
2) At the same time, RCECap experienced higher interest cost from funds borrowed. This led to a squeeze in its profit margin, which explained why its bottom-line dropped faster than its top-line. Unlike banks, even MBSB which can accept Savings & Fixed Deposits, RCECap has to source its funding from the money markets. As such, its interest cost is slightly higher than other players in its core business of lending to cooperative members.
Unless the interest rate regime & the competitive environment changes, I expect this same pattern to persist, resulting in further decline in RCECap's bottom-line.

Table 1: RCECap's past 8 quarterly results

Chart 1: RCECap's last 16 quarterly results (plus profit margin trend)
Financial Position
RCECap's financial position is deemed satisfactory as at 31/3/2011, as reflected in its current ratio of 1.30 times & debts to equity of 2.64 times. RCECap, being a finance company, is expected to operate with a leverage of 2-3 times.
Valuation
RCECap (closed at RM0.53 yesterday) is trading at a PE of 6.2 times (based on annualized EPS of 8.48 sen). While this PE multiple looks attractive, I believe the market is expecting further deterioration in RCECap's earning and is pricing this into the share price. As such, I believe that RCECap could be a value trap- a stock that looks relatively cheap but it will stay cheap. Others may hold differing opinion, such as RHB research which valued the stock at RM1.10 (here).
Technical Outlook
I drew a price band onto the price chart of RCECap. For the near term, I expect RCECap to trade within a band of RM0.40 & RM0.60.

Chart 2: RCECap's weekly chart as at June 15, 2011 (Source: Quickcharts)
Conclusion
Based on concern for further deterioration in its financial performance & poor technical Outlook, I believe RCECap is a stock to be avoided. If you are presently holding this stock, I would recommend a sell into strength when the share price approaches the RM0.60 level.
Airasia- may see greater height
Results Update
For QE31/3/2011, Airasia's net profit dropped by 46% q-o-q or 23% y-o-y to RM172 million while turnover dropped 11.7% q-o-q but rose 20.4% y-o-y to RM1.048 billion. On Page 16-17 of the detailed Financial Statements (plus Notes), you would see that Airasia enjoyed a y-o-y improvement in seat load factors of 6% points (from 74% to 80%); volume growth of 17%; and, ancillary income growth of 31% (from RM38 to RM50 per passenger). This was partially offset by a 5%-decline in average fare From RM173 to RM164.
The main reason for the y-o-y decline in Airasia's net profit was the decline in Finance Income from RM306 million to RM116 million, which consists mainly forex gains that had dropped from RM287 million to RM101 million. On the other hand, Finance Costs had also declined y-o-y from RM215 million to RM155 million.

Table 1: Airasia's last 8 quarterly results

Chart 1: Airasia's last 20 quarterly results
Financial Position
The main concern for Airasia is its high leverage position. Due to its strong cashflow from operation, the leverage position has declined steadily, albeit still on the high side. Airasia generated cashflow from operation of RM454 million for QE31/3/2011 (compared to RM296 million for QE31/3/2010). Net gearing ratio dropped from 2.25 times as at 31/3/2010 to 1.57 times as at 31/3/2011.
As at 31/3/2011, current ratio stood at 1.65 times- an improvement from 1.35 times as at 31/3/2010.
Valuation
Airasia (closed at RM3.19 yesterday) is now trading at a PE of 8.7 times (based on last 4 quarters' EPS of 36.8 sen). However, it must be noted that the last 4 quarters' total net profit of RM1.014 billion consists of net forex gain of RM370 million. If we exclude this forex gain from the net profit, the EPS would be adjusted lower to 23.4 sen. This would give an adjusted PE of 13.6 times.
Singapore Airlines Ltd [SIA] (SGX Code: C6L), a full-service airline, is currently trading at a PE of 15.4 times. SIA's top-line & bottom-line did not grow over the past 4 years (from FY Mar2008 to Fy Mar2011). Turnover dropped from S$15.97 billion to S$14.52 billion while Net Profit plummeted tfrom S$2.05 billion to S$1.09 billion. For more, go here. SIA has just announced that it would be started a low-cost airline next year to capture the market for budget flyers.
When we compare the two airlines, Airasia looks the more promising model while SIA is well-known to be financially strong. Since Airasia is trading at a lower PE multiple than SIA, I would consider its upside potential to be better. If it can command the same PE multiple as SIA, Airasia's fair value could be RM3.60.
Technical Outlook
Airasia is in an uptrend line, with support at RM2.85. Its immediate support is the horizontal line at RM3.05. See Chart 2.

Chart 2: Airasia's daily chart as at June 15, 2011_10.30am (Source: Quickcharts)
The weekly chart (plotted on log scale) shows that Airasia has broken above its "loud hailer" formation. Like most bullish breakout, this could lead to further rally for the stock. On the other hand, if Airasia were to go below the upside breakout level at RM2.60, this would be construed as a reversal of the current uptrend. We had seen a similar but opposite reversal in 2009 when Airasia crossed above the downside breakout level at RM1.00-1.10 and a recovery in the share price ensued- which we are still seeing today.
We should note that there is a bearish divergence in the indicators which may signal some short-term weakness ahead.

Chart 3: Airasia's weekly chart as at June 14, 2011_10.30am (Source: Tradesignum)
Conclusion
Based on good financial performance, attractive valuation & positive technical outlook, Airasia is still a good stock for long-term investment.
AeonCr- did not disappoint
Results Update
AeonCr announced its results for QE30/5/2011 yesterday. Its net profit dropped marginally by 1% q-o-q to RM19.2 million while turnover increased by 4.6% to RM77 million. The decline in net profit was attributable to higher operating expenses, in particular promotional expenses, personnel expenses & administrative expenses. Compared to the same quarter last year, net profit increased by 45.3% while turnover gained 22.5%.

Table 1: AEONCr's last 8 quarterly results
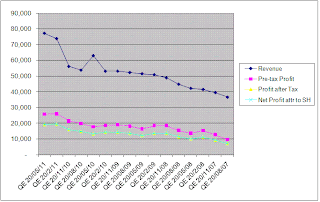
Chart 1: AEONCr's last 16 quarterly results
Valuation
AeonCr (closed at RM4.90 yesterday) is now trading at a PE of 8.4 times (based on last 4 quarters' EPS of 57.85 sen). At this multiple, AeonCr is deemed attractive. It could trade up to a PE multiple of 10 times.
Technical Outlook
AeonCr has broken above the line connecting its recent high (but ignoring the high recorded in the first 2 weeks of trading after its listing on Bursa Malaysia. If we assume that this current breakout can travel the same distance as that achieved from its recent low to the breakout point, then the potential target price would be about RM5.40.
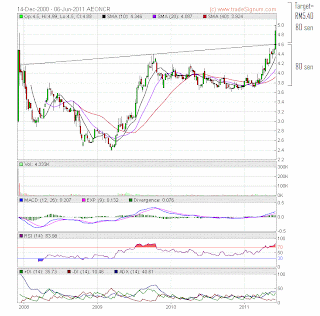
Chart 2: AEONCr's weekly chart as at June 10, 2011 (Source: Tradesignum)
Conclusion
Based on good financial performance, attractive valuation & bullish technical outlook, AEONCr could be a good stock for medium-term investment.
AeonCr announced its results for QE30/5/2011 yesterday. Its net profit dropped marginally by 1% q-o-q to RM19.2 million while turnover increased by 4.6% to RM77 million. The decline in net profit was attributable to higher operating expenses, in particular promotional expenses, personnel expenses & administrative expenses. Compared to the same quarter last year, net profit increased by 45.3% while turnover gained 22.5%.

Table 1: AEONCr's last 8 quarterly results
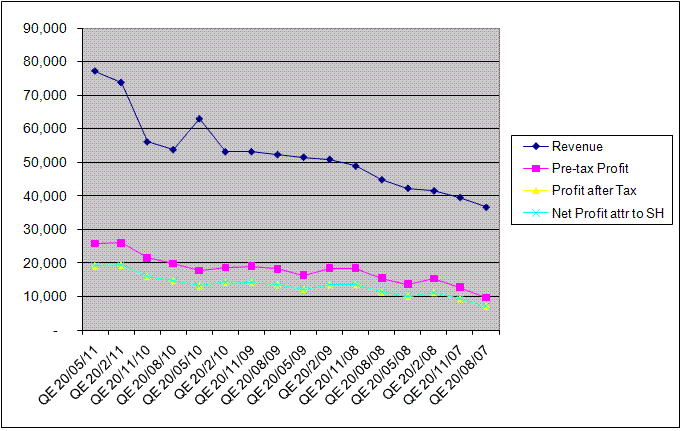
Chart 1: AEONCr's last 16 quarterly results
Valuation
AeonCr (closed at RM4.90 yesterday) is now trading at a PE of 8.4 times (based on last 4 quarters' EPS of 57.85 sen). At this multiple, AeonCr is deemed attractive. It could trade up to a PE multiple of 10 times.
Technical Outlook
AeonCr has broken above the line connecting its recent high (but ignoring the high recorded in the first 2 weeks of trading after its listing on Bursa Malaysia. If we assume that this current breakout can travel the same distance as that achieved from its recent low to the breakout point, then the potential target price would be about RM5.40.

Chart 2: AEONCr's weekly chart as at June 10, 2011 (Source: Tradesignum)
Conclusion
Based on good financial performance, attractive valuation & bullish technical outlook, AEONCr could be a good stock for medium-term investment.
Tuesday, June 14, 2011
Panamy- still attractive, albeit a dip in the bottom-line
Results Update
Panamy reported its results for QE31/3/2011 recently. Its net profit dropped by 45% q-o-q or 4% y-o-y to RM14.7 million while turnover was also lower by 26% q-o-q or 2% y-o-y to RM150 million. The q-o-q decline was mainly due to the festive seasons. However, Panamy's bottom-line was also impact by higher raw material costs, which led to a disproportionately higher decline.

Table: Panamy's last 8 quarters' results

Chart 1: Panamy's last 17 quarters' results
Valuation
Panamy (closed at RM23.96 today) is now trading at a PE of 16.5 times (based on last 4 quarters' EPS of 145 sen). As a blue chip stock with a world-renowned brand, I believe Panamy could command a PE of 18 times. This gives a target price of RM26 for Panamy.
Technical Outlook
From the monthly chart (plotted on log scale) below, we can see that Panamy has been rising within an upward channel from 1998 to 2010. In 2010, Panamy broke above the channel as the share price accelerated higher. The curvy lines (in red) may provide the new boundary for Panamy's price movement going forward. It has recently tested the new upper boundary at the RM25 mark.

Chart 2: Panamy's monthly chart as at June 1, 2011 (Source: Tradesignum)
Conclusion
Based on good financial performance (albeit one quarter of disappointing result) and attractive valuation, Panamy remained a good stock for long-term investment. However, selling into strength if/when the share price goes above the RM26 mark may be a good idea.
Monday, June 13, 2011
Chinese companies- cheap for a good reason?
In 2009, one of my clients was introduced to a Chinese stock listed on the Hong Kong Stock Exchange (HKEX), called China Zhongwang. This company was "the third largest aluminium extrusion product developer and manufacturer in the world and the biggest one in Asia and China, primarily focusing on, among others, the light-weight development of transportation, machinery equipment and electric power engineering sectors" (as per a report in Wikipedia). He bought into this stock at HK$8.00 apiece. In early 2010, the stock was suspended for a few weeks due to inaccurate information provided in its prospectus. I did not follow this stock in the past few months but I remember that the inaccurate information was never fully resolved and as a result the stock keeps sliding until it is now trading at only HK$3.10 apiece. Financial irregularities were also witnessed among Chinese stocks listed on the Singapore Stock Exchange (SGX) (here & here).

Chart 1: China Zhongwang's daily chart as at June 13, 2011 (Source: Yahoo Finance)
In the past few days, we can read a lot about similar irregularities among the Chinese companies that are listed in the U.S. stock markets. You can read more about it here & here. The problem has become so acute that it has affected even bigger names, such as Baidu (Code: BIDU). You can see from the chart below Baidu has dropped to its accelerated uptrend line (S1-S1) at USD120. If this support failed & the 200-day SMA line at USD117 also failed, Baidu could slide to the psychological USD100 level or even the long-term uptrend line support at USD80. Indicators are bearish, with negative crossover recorded in the MACD & ADX indicators while RSI is hovering at the 50 mark.

Chart 2: Baidu's weekly chart as at June 10, 2011 (Source: Stockcharts)
I am also puzzled why Chinese companies would want to list in Malaysia. The negative factors are as follows:
1) As a promoter, you would get less for the shares that you are selling in the case of an Offer for Sale. Would you go and sell your car in Kuala Lipis instead of Kuala Lumpur, especially when it would fetch a lower price?Based on the above, I can only conclude that those Chinese companies listed in Malaysia must have some serious shortcomings, such as inability to meet listing criteria, which preclude them from listing on other exchanges. My hope is that they are still decent companies and not someone's get-rich-quick Trojan horse. I believe I am not alone in holding this view, which may explain why Chinese companies listed on Bursa Malaysia are trading at such low PE multiple.
2) As the owner of the listed company, you want to be able to raise capital at competitive rate. This means that you want to issue shares at high prices because the higher the issue price, the lower is the cost of capital. You won't get that by listing the company in Malaysia as the stock would only command a PE multiple of 3-4 times.
3) Finally, you won't get any bragging right as the owner of a company listed on Bursa Malaysia. Maslow theory says that the second highest needs in human's hierarchy of needs are esteem needs, which include recognition by your peers. Imagine a tycoon being toasted at the annual CNY dinner. He would want to be known as someone whose company is listed on the Shanghai Stock Exchange (SSE) or better still on New York Stock Exchange (NYSE). If not the SSE or NYSE, then at least HKEX. He would still get a polite clapping if his company is listed on the SGX, but he would get a puzzled look all round if it is listed on Bursa Malaysia. Malaysia to a Chinese is like Myanmar is to a Malaysian.
Friday, June 10, 2011
Parkson- expanding to Indonesia
Recent Corporate Development
Yesterday, Parkson announced that its indirect wholly-owned subsidiary, Parkson Retail Asia Pte Ltd (“Parkson Asia”) and Centro Retail Pte Ltd (a wholly-owned subsidiary of Parkson Asia) proposed to acquire100% shareholding of PT Tozy Sentosa (“TS”), a subsidiary of PT Tozy Bintang Sentosa (“TBS”) at a total consideration of USD12,799,249. This is pursuant to a conditional joint-venture agreement with PT Mitra Samaya and Parkson Asia for the purposes of combining the Malaysian and Vietnamese retail business of Parkson with the Indonesian retail business of TBS. For more, go here.
Three days earlier, Parkson announced that it had completed the acquisition of a property located in Hai Phong, Vietnam for a cash consideration of USD24.15 million by Parkson Haiphong Co Ltd ("Parkson Haiphong"), a wholly-owned subsidiary of the Company, from Thuy Duong Investment Joint Stock Company of a property located in Hai Phong. For more, go here.
These two announcements signify Parkson's ambition to grow its departmental store operation aggressively in Vietnam & Indonesia.
Recent Financial Results
Parkson's net profit increased by 12% q-o-q or 26% y-o-y to Rm105 million for QE31/3/2011. Its turnover increased by 6% q-o-q as well as y-o-y to RM801 million.

Table: Parkson's past 10 quarterly results

Chart 1: Parkson's last 17 quarterly results
Valuation
Parkson (closed at RM5.96 today) is now trading at a PE of 19 times (based on last 4 quarters' EPS of 31.05 sen). At this multiple, Parkson is deemed overvalued unless it can show strong growth in the next financial year.
Technical Outlook
Parkson has been consolidating within a triangle for the past 18 months. If the share price can break above the RM6.00, the stock may continue with its prior uptrend. Thereafter, its resistance is at the clustered band of RM6.60-6.80 & then at RM7.80-8.00.

Chart 2: Parkson's weekly chart as at June 9, 2011 (Source: Quickcharts)
Conclusion
The recent corporate announcements may generate some excitement for Parkson. We will have to wait & see whether this would lead to a re-rating for the stock. The first sign of that would be an upside breakout of the resistance of RM6.00. However, it must be noted that Parkson is currently trading at a high PE of 19 times.
Muhibah- next upleg around the corner?
Background
Muhibbah Engibeering (M) Bhd ('Muhibah') is involved in infrastructure construction, cranes construction & ship repair.
Recent Financial Results
Muhibah's net profit increased by 100% q-o-q or 244% y-o-y to RM18.2 million despite the decline in its turnover of 5% q-o-q or 4% y-o-y to RM394 million. The improved bottom-line came mainly from the infrastructure construction & ship repair divisions.

Table 1: Muhibah's past 8 quarterly results

Table 2: Muhibah's segmental results for QE31/3/2011 & QE31/3/2010 compared

Chart 1: Muhibah's last 12 quarterly results
Financial Position
Muhibah's financial position as at 31/3/2011 is on a border line, with tight liquidity as reflected by a current ratio of 1.06 times and elevated leverage (a debt to equity ratio at 0.76 time ).
Valuation
Muhibah (closed at RM1.76 yesterday) is now trading at a PE of 14.9 times (based on last 4 quarters' EPS of 11.78 sen). At this PE multiple, Muhibah is deemed fully valued.
Technical Outlook
Muhibah broke above its triangle formation at RM1.75 yesterday. See Chart 2. In addition, Muhibah has earlier broken above its long-term downtrend line at RM1.70. There is one more hurdle to cross- the parallel line(P1-P1) to the uptrend line (PP) at RM1.82-1.83. See Chart 3 below. If Muhibah can break above the last hurdle, its next upleg should begin. First resistance is at RM1.93 (the high recorded in January this year) and thereafter at horizontal lines RM2.00, RM2.50 & RM3.00.

Chart 2: Muhibah's daily chart as at June 10, 2011_3.00pm (Source: Quickcharts)

Chart 3: Muhibah's weekly chart as at June 10, 2011_3.00pm (Source: Quickcharts)
Conclusion
Although trading at a high PE multiple & having a relatively weak financial position, Muhibah is a stock worth tracking. Its financial performance has improved steadily over the past 4 quarters. More improvement is likely given the activity in the construction and O&G sectors. The main selling point of this stock is the improvement in the technical outlook. The stock is almost at the point of starting its next upleg.
Kencana may have a bullish breakout
Kencana has just broken above its triangle at RM2.88-2.90 but the volume is still not substantial. This upside breakout could lead to the continuation of the prior uptrend. Kencana's existing uptrend line support is at RM2.75. Its immediate resistance would be the recent high at RM2.95. Based on technical breakout, Kencana could be a trading BUY.

Chart: Kencana' daily chart as at June 10, 2011_11.00am (Source: Quickcharts)

Chart: Kencana' daily chart as at June 10, 2011_11.00am (Source: Quickcharts)
Thursday, June 09, 2011
Bstead may have a bullish breakout
Bstead broke above its 'rising wedge' at RM6.25 today (see Chart 1). The volume is sharply higher than normal. In fact, the volume picked up over the past 2 days, which is supportive of an upside breakout. With this breakout, Bstead could potentially rally to test the line connecting its high over the past 18 years (at RM7.00). See Chart 2 below. Based on the technical breakout, Bstead could be a good trading BUY.
My main concern regarding this breakout is that it came on the heels of the issuance of Bstead-CB, a new CW based on Bstead share issued by CIMB. The issuance of a new CW tends to give the underlying share a short-term lift. I am not sure how this phenomenon came about. I would not pin this on any issuer. It is probably an activity driven by market participants based on expectation & historical behavior. At this moment, we would not know whether the current breakout in Bstead is due to this phenomenon or is actually a genuine breakout. We can either wait & see or put our money at risk & ripe the reward. If you choose the latter, you are well-advised to set your protective stop. Good luck!

Chart 1: Bstead's daily chart as at June 9, 2011_11.45am (Source: Quickcharts)

Chart 2: Bstead's monthly chart as at June 9, 2011_plotted on log scale (Source: Tradesignum)
Sapcres may have a bullish breakout
Sapcres broke above the line connecting its high for the past 8 years at RM4.10 this morning. On the daily chart, it looks like a breakout looks above a 'rising wedge' formation (see Chart 1). The volume is still moderate & not very convincing. If this breakout is the real deal, it could be the start of a big rally for this stock.
From the monthly chart below (Chart 2), we can see that the last time Sapcres had a bullish breakout (above its downtrend line, either R1-R1 or R3-R3), it put in an upward move equivalent to the distance between the previous low to the breakout level (denoted as 'a'). If the current breakout morphs into a full-blown rally and Sapcres were to put in a rise equivalent to the distance between the recent low to the breakout level, Sapcres could potentially go as high as RM6.00-8.00. The tricky part is determining the breakout level? Did the stock breakout above the overhead line at RM4.10 (based on the line, RR) or RM2.80 (based on the line, R-R2)? I think we can put aside the problem of the potential target price for now. The more important question is whether Sapcres's bullish breakout is genuine. If it is, it is a trading BUY. Since the upside could be very rewarding, I believe we should have at least take a small position in this stock.

Chart 1: Sapcres's daily chart as at June 9, 2011_11.00am (Source: Quickcharts)

Chart 2: Sapcres's monthly chart as at June 9, 2011_plotted on log scale (Source: Tradesignum)
Wednesday, June 08, 2011
PChem may have broken its uptrend line at RM7.10.
PChem dropped marginally below the medium-term uptrend line support at RM7.10 yesterday. Today, it pulled away & traded at a low of RM6.97. If PChem cannot recover back above this uptrend line quickly, its uptrend would be over. In such a scenario, I would cancel the earlier trading BUY call and instead recommend a SELL for this stock. (Note: Even if PChem failed to recover back above its uptrend line, PChem- being a GLC- is likely to drift lower instead of dropping quickly. That's one of the benefit of being a GLC stock. You can always count on the support from local funds.)

Chart: PChem's daily chart as at June 8, 2011_3.30pm (Source: Quickcharts)

Chart: PChem's daily chart as at June 8, 2011_3.30pm (Source: Quickcharts)
Plantation stocks- time to take some profit
Yesterday, we saw a few plantation stocks rallied strongly. Among the top gainers were NSOP, Glenealy, RSawit & TDM. As a result, we can see the Plantation index rising to its immediate resistance at the horizontal line 7880. See Chart 1 below.

Chart 1: Plant's daily chart as at June 8, 2011_10.30am (Source: Quickcharts)
However, CPO prices have been dropping for the past 2 weeks which is contrary to the movement in plantation stocks. We can see from Chart 2 below that CPO tested the upside of the triangle where it consolidated in April. As at 11.00am this morning, CPO futures for July was trading at RM3343, which means that CPO has dropped back into the triangle; thus negating the bullish breakout in May. Unless a quick rebound set in, CPO's upleg would be deemed to have been aborted & it would lead to further consolidation ahead. This could also lead to consolidation among plantation stocks.

Chart 1: CPO's daily chart as at June 7, 2011 (source: ifs.marketcenter.com)
For your information, Plantation sector had rallied from a low of 2973 in late 2008 to a high of 8350 in early 2011. Plantation index is now being supported by the 40-week SMA line (the equivalent to 200-day SMA line). We can see that a break below the 40-week SMA line in early 2008 presaged the end of the bull rally for Plantation sector (see Chart 3). This was also confirmed by the bearish breakdown in CPO prices in July 2008 (see Chart 4).

Chart 3: Plantation's monthly chart as at June 1, 2011 (source: Tradesignum)

Chart 4: CPO's weeky chart from April 2008 to September 2009 (source: ifs.marketcenter.com)
With the 2008 breakdown information in hand, we should track the Plantation index & CPO prices closely. If Plantation index were to break below the 40-week SMA line at 7650 and/or CPO prices were to go below RM3250, we could be seeing the end of the bull rally for plantation sector. For now, I believe we should consider taking some profit from oure plantation stocks that have risen respectably over the past few weeks.
Tuesday, June 07, 2011
MEGB may revisit its low at RM1.62
The rally for MEGB, which started in late March, ended in early April. Since then, it has dropping and it broke below the psychological cum horizontal support of RM2.00 on May 27. The stock tested the horizontal support at RM1.82-1.83 on May 30 & 31 and again yesterday & earlier today. If this support holds up, the stock may stabilize & recover. If not, it may revisit its mid-March low of RM1.62. The indicators are still weak.

Chart 1: MEGB's daily chart as at June 7, 2011_3.30pm (Source: Quickcharts)
From the daily chart below, we can see that MEGB broke above its accelerated downtrend line (R1-R1) in end March and put in a strong rally until it hit the downtrend line (RR). Since then, MEGB has been sliding in line with its prevailing medium-term downtrend (see the series of H-H1-H2-H3 & L-L1-L2-L3?). If the current short-term downtrend failed to go below the L2 at RM1.62, there is a good chance we may be see a bottom for MEGB. The recovery is not on the agenda just yet.

Chart 2: MEGB's daily chart as at June 6, 2011_plotted on log scale (Source: Tradesignum)
Based on the above charts, we should track this stock closely. If it revisits its recent low & failed to make a new low, I think we can consider buying for a rebound.
Subscribe to:
Posts (Atom)