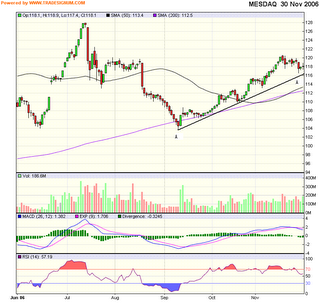
Chart 1: Mesdaq’s daily chart as at Nov 30

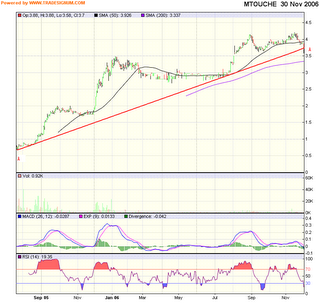
Chart 2: MTouche’s daily chart as at Nov 30

Chart 3: Green Packet’s daily chart as at Nov 30
This is a personal weblog, reflecting my personal views and not the views of anyone or any organization, which I may be affiliated to. All information provided here, including recommendations (if any), should be treated for informational purposes only. The author should not be held liable for any informational errors, incompleteness, or delays, or for any actions taken in reliance on information contained herein.

Chart 1: Mesdaq’s daily chart as at Nov 30

Chart 2: MTouche’s daily chart as at Nov 30

Chart 3: Green Packet’s daily chart as at Nov 30
3 comments:
Hi Alex,
from my view on Gpacket , Mtoucher and OSK VI will be extended its high in coming months to above RM5 , and N2N will be at least RM3 , all prices is projected by my system.
Hi Sagil,
There is a good chance that you maybe right. A trending stock is more likely to stay in its prevailing trend until it is broken. On closer reading, my posts on Mesdaq, Green Packet & MTouche maybe a tad negative. Let's wait & see.
Hi Alex,
Gpacket on 7/12/06 low at RM4.10 , in my TA view , Gpacket is reverse its gear from downtrend to uptrend , i will expect to see Gpacket above Rm5 in next 3 to 4 weeks. may be i am wrong, just wait and see.
Post a Comment