Friday, October 31, 2008

Was that the bottom?

The question on everyone's mind right now is- Did we hit a bottom on October 28th? Let's be frank, nobody knows when a bottom has arrived. A bottom, like a top, comes & goes without ringing a bell.

Notwithstanding the above comment, I believe that the market could stage a strong rebound from the low recorded on October 28th. That's based on my observation of the steady improvement in the credit market as well as some stability returning to the currency market. While we are not out the wood yet, the stock market should rally after the sharp fall of the past 3-6 months (see Chart 1 below).

To get an indication of how much of a rebound we can expect as well as how treacherous the market may be in the days & weeks ahead, let's look at our stock market during the Asian Financial Crisis in 1998 (see Chart 2 below). The present drop in our market since May this year may have traveled in the same route taken by the market in the earlier period, from June 1997 to October/November 1997. In the earlier period, our stock market rebounded back to its 50-day SMA on a few occasions, while our present market has not only failed to rebound up to its 50-day SMA since May, it has totally failed to put in any decent rebound. With improvement in credit & currency markets & a deeply oversold stock market (akin to a tightly-wound up spring), I believe that the stock market is ripe for a strong rebound. It is likely that our market may rally up to the 50-day SMA, but I believe that the 50-day SMA will also cap the rise in this strong rally in our present market. The 50-day SMA for KLCI is presently at the 1000 mark. Since the KLCI closed at 853.6 yesterday, this means that our KLCI may potentially have an upside of about 17%.


Chart 1: KLCI's daily chart as at October 29, 2008 (source: Tradesignum.com)


Chart 2: KLCI's daily chart from January 30th, 1996 to January 30th, 1999 (source: Tradesignum.com)

In conclusion, I believe that we should take some position in the market presently. While we may not be buying near the bottom, we will be buying at deeply-depressed prices that would lower our potential downside risk & increase our potential upside return. Good luck.

Thursday, October 30, 2008

Commerz tested its long-term uptrend

Commerz has just rebounded off its long-term uptrend line support at RM5.70. This stock has been sliding since making its top at RM12.60 in May 2007. Its recent low was only RM5.65, recorded 2 days ago.

Commerz (closed at RM5.80 yesterday) is now trading at a Price-to-Book of 1.03 times (based on its NTA of RM4.68 as at 30/6/2008). For the 6-month ended 30/6/2008, Commerz reported an earning of 35 sen per share. Assuming a 30% lower earning for the 2rd half, Commerz's earning for FY2008 could be about 60 sen. Thus, the stock is trading at about 10 times its current year's earning.

Technically speaking, Commerz is still in a long-term uptrend, with support at RM5.70. I have fitted in a 30-month SMA as well as 2 displaced SMAs (i.e. +30% & -30%), trying to best-fit the trend of Commerz's share price movement. As you can see from the chart, the stock tends to find support at the -30% displaced 30-month SMA, only failing to do so in 1998. Similarly, the stock's upside has been capped by the +30% displaced 30-month SMA for long period, except for 1999, 2000 & 2007. I believe that Commerz is likely to recover further, having tested its long-term uptrend line plus the -30% displaced 30-month SMA support at about RM5.70-6.00 level. On the other hand, a convincing break below this level would signal a sell on this stock.


Chart: Commerz's monthly chart as at October 29, 2008 (source: Quickcharts)

Based on attractive valuation & strong technical support, Commerz could be a good stock for medium-term investment.

IJM, another attractive BUY

IJM has been sliding since making a high of RM9.50 (in February 2007). Yesterday, IJM made a low of RM2.35 before staging a slow recovery to close at RM2.45. The share price has plunged 60% over the past 4 days, from its close of RM4.14 on October 22nd. One of the possible reason for the selldown is the unhappiness among its financiers over IJM's proposed special dividend of 25 sen as well as capital repayment of RM0.50 per share (go here). These capital management exercise may have come at a bad time when companies worldwide are conserving cash or making right issues if possible in order to ride through the different time ahead.

IJM is now trading at a P/Book of 0.5 times or 8.9 times its annualized earning for FY2008 (of 28 sen). IJM's financial position is fairly healthy, with current ratio at 1.8 times while gearing ratio is moderate at 0.59 times (based on its Balance Sheet as at 30/6/2008). Its cash in hand is very high at RM717 million, but would be lowered by RM645 million after the proposed special dividend & capital repayment exercise. The entitlement date for the special dividend was yesterday.


Chart: IJM's weekly chart as at October 29, 2008 (source: Quickcharts)

Based on the huge drop in share price, I believe that IJM is now an attractive stock for long-term investment.

IOI could be a good BUY

IOI has dropped 76% from its peak of RM8.60 (recorded in January 2008) to its recent low of RM2.08 on October 28 (last Tuesday). This is in line with the 70%-drop in CPO prices during the same period.

IOI (closed at RM2.25 yesterday) is now trading at a P/Book of 1.6 times) or 6.4 times its earning for FY2008 (of 35 sen). I will not try to estimate IOI's earning for FY2009, which could easily be lower than half its FY2008 numbers. More importantly, I can see that IOI's financial position is fairly healthy, with current ratio at 3.1 times while gearing ratio is moderate at 0.64 times (based on its Balance Sheet as at 30/6/2008). Its cash in hand is very high at RM2.9 billion.

The share price of IOI has been hammered in the past few days because of rumor of forex losses. This has since been confirmed to be true, but the actual loss of RM130 million is much lower than speculated. For more on this, you can go to here, here & here.


Chart: IOI's weekly chart as at October 29, 2008 (source: Quickcharts)

Based on the huge drop in share price, I believe that IOI is now an attractive stock for long-term investment.

Wednesday, October 29, 2008

There is nowhere to hide?

The second- and third-liners were sold down earlier, which include the Mesdaq & Second Board stcoks. The bluechips were ditched later, which include the finance stocks & lately the plantation stocks. Where can you hide? How about well-managed pricey blue-chips? The crème de la crème of Malaysian equity, such as BAT , DIGI and Nestle? They should be safer, right? Let's see...

Today, we have a report from CITI Investment Research, which has downgraded DIGI (closed at RM20.90 yesterday) from a "buy" to "sell", partly due to current weak market sentiment and its disappointing third-quarter financial results (go here). From Chart 1 below, we can see that DIGI has made a lower 'low' and a lower 'high' (marked as b & b1 and a & a1, respectively). In addition, we can see that the 5-m SMA has cut below the 10-m SMA; the monthly MACD has hooked down; and, the William %R has similarly broken its uptrend as well as gone below the 50% level. This means that DIGI will be trending lower over the near term, with immediate support at RM20.00 & thereafter at RM18.80.


Chart 1: DIGI's monthly chart as at October 28, 2008 (source: Quickcharts)

Nestle's long-term uptrend line is still intact, as long as the share price remained above RM24.50-25.00. The stock, which closed at RM27.50 yesterday, has a fairly strong horizontal support is at RM26.00.


Chart 2: Nestle's monthly chart as at October 28, 2008 (source: Quickcharts)

Finally, BAT... Based on the long-term uptrend line drawn (which exclude the sharp price plunge of 1998), we can see that this uptrend line is still intact. It should provide support at RM37.50-38.00. The stock has a fairly strong horizontal support at RM38.50-39.00. BAT closed at RM42.00 yesterday.


Chart 3: BAT's monthly chart as at October 28, 2008 (source: Quickcharts)

In a bear market, everything will be sold down. It is only a matter how much they are sold down. We will wait & see whether BAT and Nestle will be able to stay above their long-term uptrend line.

Next up, Currency crisis

Stephen Jen, the chief currency strategist at Morgan Stanley, wrote in a recent report that since the fall of Lehman, we’ve been seeing clear signs of currency crises throughout the world of emerging markets, including Eastern Europe. This time, it’s not an Asian crisis or a Latin American crisis, it’s a global crisis. He adds that "So far,the US financial sector has been the epicentre of the global crisis. I fear that a hard landing in EM assets and economies will become the second epicentre in the coming months, with very damaging feedback effects on the developed world." Yves Smith of Naked Capitalism has a very good post on the same subject, entitled "Currency Crisis is a gathering storm".

The current global deleveraging exercise has resulted in all class of assets being sold off & the proceed repatriated back to the US to meet mounting funds redemption or to lower the liabilities side of over-leveraged US financial companies. This led to a sharp rise in the US Dollar (USD). Some of this proceed would have flowed back to the other great provider of credit, Japan. This in turn has led to a rise in Japanese Yen (JPY). The latter could have triggered an unwinding of the yen carry trade, which might have reached a self-sustaining level & turned into a virtuous cycle. The high exchange rate for JPY is now hurting its export & has prompted sharp drop in the share price of many Japanese exporters. Some quarters in Japan have talked about the need for a coordinated effort- with other G7 nations- to check the rise of the JPY. Yesterday, the rumor of a cut in the interest rate had surfaced, which led to a sharp drop in the JPY. Will the slide in the JPY continue? Will it be sufficient to break the cycle of selling brought about by the unwinding of the yen carry trade?

From Chart 1 below, we can see that JPY index has risen 20% from a low of 90.4 on Oct 17th to a high of 109.25 on Oct 26th, before correcting back to 102.3 yesterday. Further weakness could send JPY to its short-term uptrend support of 96. This is also a good horizontal support level. If this support level is violated, then JPY may drop to its medium-term uptrend support of 92. This is also a good horizontal support level (see Chart 2).


Chart 1: JPY's daily chart as at October 28, 2008 (Source: Stockcharts.com)


Chart 2: JPY's weekly chart as at October 28, 2008 (Source: Stockcharts.com)

While we are on the chart of JPY, we might as well check on the direction of the USD. From Chart 3 below, we can see that the USD's immediate support is at its short-term uptrend support of 84-85 level. If this level is violated, USD could slide back to horizontal support of 80-81 and thereafter its medium-term uptrend line support of 78-79.


Chart 3: USD's daily chart as at October 28, 2008 (Source: Stockcharts.com)


Chart 4: USD's weekly chart as at October 28, 2008 (Source: Stockcharts.com)

While both JPY & USD are in overbought territory- which could signal potential corrections ahead- both the short-term & medium-term outlook of these currencies are still bullish. This means that we can expect more selling of equity & other assets class going forward.

Friday, October 24, 2008

Ajiya's topline & bottomline continued to grow

Ajiya Bhd ('Ajiya') is involved principally in the manufacture and supply of materials used in the construction and building based industries in Malaysia. In the current economic slowdown, one would expect Ajiya's business to be affected negatively. Looking at the results for 3Q2008 announced yesterday, Ajiya has not only survived but thrived in this tough times.

Ajiya's net profit for QE31/8/2008 increased by 9.2% q-o-q or 57.5% y-o-y to RM7.0 million while its turnover increased by 7.8% q-o-q or 19.0% y-o-y to RM87.0 million. Ajiya's EPS for the past 4 quarters increased by 39% to 32.5 sen (from 23.4 sen recorded in the preceding 4 quarters) while its turnover rose by 18.5% from 259 million to RM307 million during the same periods.

Based on its closing price of RM1.01 as at October 23, Ajiya is now trading at a PE of 3.1 times or at a P/Book of 0.44 times (using its NTA per share of RM2.28 as at 31/8/2008). At these multiples, I believe Ajiya is very attractively-priced.


From Chart 1 below, we can see that Ajiya has slid back from its high of RM1.75 in July 2007. Presently, it is trading very near to its strong horizontal support of RM1.00. However, the share price has violated its long-term uptrend line support of RM1.10, which commenced in August 1998. The break below the long-term uptrend line could signal further weakness ahead.


Chart 1: Ajiya's weekly chart as at October 23, 2008 (source: Quickcharts)


Chart 2: Ajiya's monthly chart as at October 23, 2008 (source: Quickcharts)

Based on attractive valuation, Ajiya could be a good stock for long-term investment. However, the technical outlook has turned negative due to the breakdown of the long-term uptrend line.

Note: This may appear to be a rather unexciting post, in the light of the carnage in the market right now. I've prepared this post quite early in the day because I was quite surprised by Ajiya's results. I would appreciate if anyone can shed some light on why Ajiya can still chalk up steady growth in this tough time.

Wednesday, October 22, 2008

Roads & Ports- a defensive play

In this uncertain time, we should look at companies with sustainable business to invest in. Among these companies are those involved in the operation of tolled highways, ports & airports. I have selected 5 stocks for our consideration (see the table below). This is, by no mean, an exhaustive list as some counters have been excluded for various reasons, such as Suria (uncertainty in its decision-making), SunInfra (financial problem) & MTDInfra (perpetual trendless movement).

From the table below, you will see that both Litrak & NCB are attractively priced at PE of about 7.4-7.6 times as well as giving a dividend yield of 10-12%.


I have appended below their monthly charts, plus the various support levels.
- Airport (Uptrend support at RM2.20 & horizontal support at RM2.20 & RM1.80)
- Biport (Uptrend just broken. Horizontal support at RM5.00 & RM4.50)
- Litrak (Uptrend just broken. Horizontal support at RM1.60 & RM1.30)
- NCB (Horizontal support at RM2.20 & RM1.80)
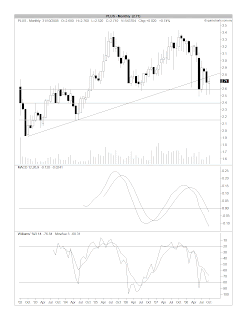
- PLUS (Uptrend just broken. Horizontal support at RM2.60 & RM2.40)


Chart 1: Airport's monthly chart as at October 21, 2008 (source: Quickcharts)


Chart 2: Biport's monthly chart as at October 21, 2008 (source: Quickcharts)


Chart 3: Litrak's monthly chart as at October 21, 2008 (source: Quickcharts)


Chart 4: NCB's monthly chart as at October 21, 2008 (source: Quickcharts)


Chart 5: Plus' monthly chart as at October 21, 2008 (source: Quickcharts)

Based on fundamental reasons, Litrak & NCB looks more attractive than the other stocks. Both stocks have weaknesses when viewed from the technical angle. NCB share price tends to be range-bound, with a glacial upward bias over the past 5 years. This "uptrend" has since been violated this month. On the other hand, Litrak was in an uptrend that was violated two months ago. I guess the breakdown of all uptrend lines are to be expected in the current bear market.

In conclusion, Litrak & NCB are the top picks. I have a slight preference for Litrak over NCB, for the simple reason that I expect Litrak to move faster once the recovery set in.

Tuesday, October 21, 2008

HSBC buying Indonesian bank at 6.1 times its book value

HSBC is buying 88.9% of Bank Ekonomi Raharja ('Bank Ekonomi') of Indonesia for US$607.5 million and is offering to buy the rest of its shares. The entire deal will be worth about US$683.4 million (RM2.4 billion) and will almost double HSBC's presence in the world's fourth most populous nation. HSBC has been operating in Indonesia since 1884 and currently has 105 outlets. Bank Ekonomi presently has a total of 86 branches.

It is interesting to note that Bank Ekonomi has a Shareholders' Funds of Rp1.121 Trillion (RM392 million), which means that HSBC is effectively buying Bank Ekonomi at a Price to Book multiple of 6.1 times! This is much higher than the Price to Book multiple of 4.6 times that Maybank will be paying to acquire Bank Internasional Indonesia ('BII') [before subsequent discounts granted by the sellers]. The different in size may account for the higher multiple demanded by the sellers in the Bank Ekonomi deal as compared to the BII deal, as part of the purchase price must include the price of the banking license itself. Nevertheless, one may wonder why does HSBC want to pay such a high premium for this bank since it already has a foothold in Indonesia? Whatever the reason maybe, this news may serve to vindicate Maybank's management's decision to acquire BII as well as confirming that it has not paid an unreasonably high price for that acquisition.

For more on the Bank Ekonomi deal, go here & here. For financial highlights of Bank Ekonomi, go here.

Monday, October 20, 2008

Gaming & Gambling stocks look attractive now

I have tabulated below the Earning & Dividend Payout of the 5 Gaming & Gambling stocks listed on our exchange. From the table below, you will see that both Tanjong & MPHB are attractively priced at PE of about 5-6 times as well as giving a dividend yield of 9-10%.


I have appended below their monthly charts (except for BJToto, which is on weekly chart). From these charts, I believe the various support levels are:

- Genting (Uptrend support at RM4.50 & various horizontal support at RM3.50-4.00)
- Resorts (Uptrend support at RM2.40 & another one at RM2.10)
- Tanjong (Uptrend support at RM10.50 & horizontal support at RM9.00)
- MPHB (Horizontal support at RM0.90-1.00)
- BJToto (Horizontal support at RM4.00 & RM4.20)


Chart 1: Genting's monthly chart as at October 17, 2008 (source: Quickcharts)


Chart 2: Resorts' monthly chart as at October 17, 2008 (source: Quickcharts)


Chart 3: Tanjong's monthly chart as at October 17, 2008 (source: Quickcharts)


Chart 4: MPHB's monthly chart as at October 17, 2008 (source: Quickcharts)


Chart 5: BJToto's weekly chart as at October 17, 2008 (source: Quickcharts)

Based on fundamental & technical reasons, MPHB looks very attractive now. While the same is applicable to Tanjong, you may like to watch the present test on its long-term uptrend line at the RM10.50 level. If the uptrend line cannot hold, the share price may drop further.

Market Outlook as at October 20, 2008

As at 10.30 am today, KLCI has dropped about 13 points to 892. This is exactly the 50% retracement of the 1263 points gained by the KLCI when it rose form the low of 261 recorded in September 1998 to the high of 1524 recorded in January 2008. This also coincides with the strong horizontal support of 880-890.


Chart: KLCI's monthly chart as at October 17, 2008 (source: Quickcharts)

From the chart above, we can see that the monthly MACD has yet to hook up. The William %R has just entered into the oversold territory- thus the bottoming phase has yet to commence. This observation does not preclude the possibility that some stocks could be making significant low or the market may enjoy a significant rally very soon. So, long-term investors may like to use the current low prices to accumulate some stocks and nimble traders may position themselves for some profitable trades.

Tuesday, October 14, 2008

Market Outlook as at October 13, 2008

On the back of strong rebound in many oversea markets, local investors are now beginning to get back into the stock market. Their main concern remained: Has the market bottomed? Would the recent low of 926 be surpassed in the next selldown? I believe that the market is likely to undergo a protracted bottoming process, lasting many months. While a V-spike reversal is possible, the market rally that followed may not have sustaining power.

In the current rebound, the KLCI will face resistance at the psychological 1000 level and at the 1030 level (posted by the immediate downtrend line). If the KLCI can break above the downtrend line, then the market could either move in a sideway manner or commence a new uptrend. While most investors would prefer an uptrending market, a sideway market is still acceptable. This sideway market would fit into a bottoming process, allowing investors to accumulate stocks before the next bullish phase of the market.


Chart: KLCI's daily chart as at October 13, 2008 (source: Quickcharts)

Friday, October 10, 2008

He who saw the train wreck

Nouriel Roubini is a professor of economics at New York University. He is also the chairman of RGE Monitor, an economic and financial analysis firm. In February 2008, he wrote "The Risk of Systemic Financial Meltdown: The 12 Steps to Financial Disaster", where he outlined how the U.S financial crisis would become more severe and virulent and eventually lead to a systemic financial meltdown and a severe recession. If you want to get a deeper insight in the current maelstrom, this article is spot-on. I do not have a link to this article, but you can get all the main points via this link (here), when Roubini recently revisited his earlier article.

In his latest article entitled "The world is at severe risk of a global systemic financial meltdown and a severe global depression", he wrote:
The US and advanced economies’ financial system is now headed towards a near-term systemic financial meltdown as day after day stock markets are in free fall, money markets have shut down while their spreads are skyrocketing, and credit spreads are surging through the roof.

He further added:
At this point the risk of an imminent stock market crash – like the one-day collapse of 20% plus in US stock prices in 1987 – cannot be ruled out as the financial system is breaking down, panic and lack of confidence in any counterparty is sharply rising and the investors have totally lost faith in the ability of policy authorities to control this meltdown.

This disconnect between more and more aggressive policy actions and easings and greater and greater strains in financial market is scary. When Bear Stearns’ creditors were bailed out to the tune of $30 bn in March the rally in equity, money and credit markets lasted eight weeks; when in July the US Treasury announced legislation to bail out the mortgage giants Fannie and Freddie the rally lasted four weeks; when the actual $200 billion rescue of these firms was undertaken and their $6 trillion liabilities taken over by the US government the rally lasted one day and by the next day the panic has moved to Lehman’s collapse; when AIG was bailed out to the tune of $85 billion the market did not even rally for a day and instead fell 5%. Next when the $700 billion US rescue package was passed by the US Senate and House markets fell another 7% in two days as there was no confidence in this flawed plan and the authorities. Next as authorities in the US and abroad took even more radical policy actions between October 6th and October 9th (payment of interest on reserves, doubling of the liquidity support of banks, extension of credit to the seized corporate sector, guarantees of bank deposits, plans to recapitalize banks, coordinated monetary policy easing, etc.) the stock markets and the credit markets and the money markets fell further and further and at an accelerated rates day after day all week including another 7% fall in U.S. equities today.

When in markets that are clearly way oversold even the most radical policy actions don’t provide rallies or relief to market participants you know that you are one step away from a market crack and a systemic financial sector and corporate sector collapse. A vicious circle of deleveraging, asset collapses, margin calls, cascading falls in asset prices well below falling fundamentals and panic is now underway.

At this point severe damage is done and one cannot rule out a systemic collapse and a global depression. It will take a significant change in leadership of economic policy and very radical, coordinated policy actions among all advanced and emerging market economies to avoid this economic and financial disaster. Urgent and immediate necessary actions that need to be done globally (with some variants across countries depending on the severity of the problem and the overall resources available to the sovereigns) include:

- another rapid round of policy rate cuts of the order of at least 150 basis points on average globally;

- a temporary blanket guarantee of all deposits while a triage between insolvent financial institutions that need to be shut down and distressed but solvent institutions that need to be partially nationalized with injections of public capital is made;

- a rapid reduction of the debt burden of insolvent households preceded by a temporary freeze on all foreclosures;

- massive and unlimited provision of liquidity to solvent financial institutions;

- public provision of credit to the solvent parts of the corporate sector to avoid a short-term debt refinancing crisis for solvent but illiquid corporations and small businesses;

- a massive direct government fiscal stimulus packages that includes public works, infrastructure spending, unemployment benefits, tax rebates to lower income households and provision of grants to strapped and crunched state and local government;

- a rapid resolution of the banking problems via triage, public recapitalization of financial institutions and reduction of the debt burden of distressed households and borrowers;

- an agreement between lender and creditor countries running current account surpluses and borrowing and debtor countries running current account deficits to maintain an orderly financing of deficits and a recycling of the surpluses of creditors to avoid a disorderly adjustment of such imbalances.

At this point anything short of these radical and coordinated actions may lead to a market crash, a global systemic financial meltdown and to a global depression. At this stage central banks that are usually supposed to be the "lenders of last resort" need to become the "lenders of first and only resort" as, under conditions of panic and total loss of confidence, no one in the private sector is lending to anyone else since counterparty risk is extreme. And fiscal authorities that usually are spenders and insurers of last resort need to temporarily become the spenders and insurers of first resort. The fiscal costs of these actions will be large but the economic and fiscal costs of inaction would be of a much larger and severe magnitude. Thus, the time to act is now as all the policy officials of the world are meeting this weekend in Washington at the IMF and World Bank annual meetings.


For the full article, go here.

International Trade Seizing Up due to Banking Crisis

Nakedcapitalism has posted about the potential negative impact of the Banking Crisis on international trade. A well-connected international investor has written to Yves Smith (of Nakedcapitalism) to say that the banking crisis is starting to bring international shipping to a halt. Before going into the problem, Yves explained a bit about the function of a letter of credit:
By way of background, letters of credit of various sorts are essential for trade. For instance, imagine the difficulty if you are, say, a Chinese manufacturer who wants to sell his wares to buyers overseas. How can he be sure the goods he ships will ever be paid for? Imagine the considerable difficulty and cost of chasing a deadbeat in a foreign country. Letters of credit. issued by banks, assure payment. They can also serve to finance the shipment (ie, fund the inventory while it is in transit).

The main point made by the well-connected international investor is:
At the end of the day, if every counterparty is bad then you don't have a market and you don't have an economy. I spoke to another friend of mine this afternoon, whose father has been in the shipping business forever. Pristine credit rating, rock solid balance sheet. He says if he takes his BNP Paribas letter of credit to Citi today for short term funding for his vessels, they won't give it to him. That means he can't ship goods, which means that within the next 2 weeks, physical shortages of commodities begins to show up. THE CENTRAL BANKS CAN'T LET THAT HAPPEN OR WE HAVE NO ECONOMY, LET ALONE A CREDIT SYSTEM.

If this problem is not tackled swiftly, we could be staring at a global recession very soon. This weekend meetings of G7 finance ministers and central bank governors must take up this issue, among the myriad of financial & banking problems.

For more on this, please go here.

Wednesday, October 08, 2008

Asian stock markets may not hold up much longer

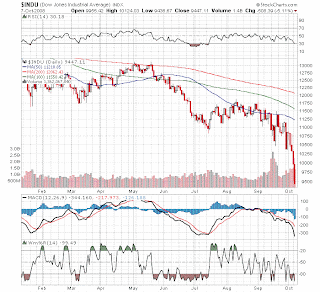
Another big fall in U.S. stock markets. Despite the Fed invoking its emergency powers to lend money to companies outside the financial sector and buy up mounds of commercial paper, the DJIA dropped 508 points to close at 9447 (see Chart 1 below).


Chart 1: DJIA's daily chart as at October 7, 2008 (Source: Stockcharts.com)

It is interesting to note that the Asian markets have been rather resilient to the fall in DJIA. On September 18 & October 7- the days after DJIA dropped by 777 points & 367 points, respectively- the Asian markets were able to recover from their earlier morning decline. We will have to wait & see whether today will be more of the same or maybe the Asian markets will finally succumb to the selloff on Wall Street.

As at 12.30 noon, the KLCI declined by 23 points to 974 (see Chart 2 below) while the Hang Seng Index dropped 932 points to 15872 (see Chart 3 below). That means that Hang Seng index is now below the low of about 16300 recorded on September 18, while our KLCI is still able to stay above the low of 963 recorded on the same day.


Chart 2: KLCI's daily chart as at October 7, 2008 (source: Quickcharts)


Chart 3: HSI's daily chart as at October 7, 2008 (Source: Stockcharts.com)

The U.S. financial crisis has morphed into the Atlantic Financial Crisis-- much like how the Thai financial crisis of 1998 turned into the Asian Financial Crisis of 1998. Regardless of the actions taken by the governments of the day, the market & the economy continue to plummet. When is this going to end?