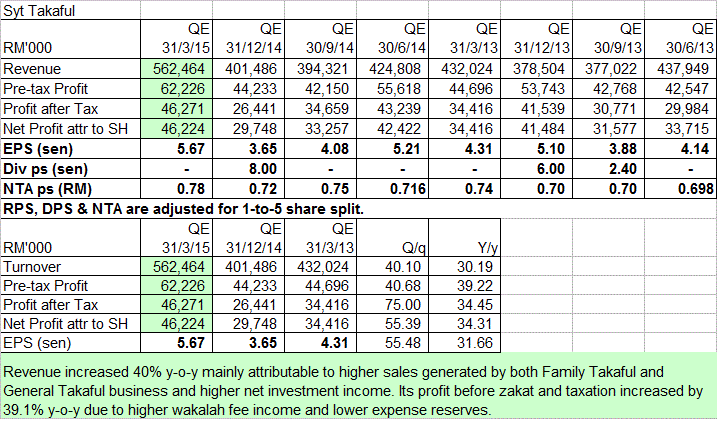
Friday, May 29, 2015

Efficen: Earnings began to rise again

Results Update

For QE31/3/2015, Efficen's net profit rose 135% q-o-q & 78% y-o-y to RM2.6 million while revenue increased by 30% q-o-q & 15% y-o-y to RM14.3 million. Profit increased q-o-q due to increase in revenue as well as higher margin from the services rendered for data and document processing contributed by adhoc projects.


Table: Efficen's last 8 quarterly results


Chart 1: Efficen's last 28 quarterly results

Valuation

Efficen (traded at RM0.275 as at 11.45am today) is now trading at a trailing PE of 29 times. At this multiple, Efficen is deemed overvalued.

Technical Outlook

Efficen has been trading in a large triangle formation from 2007 to middle of 2014. In middle of 2014, it broke above the triangle formation (at RM0.22) and rose to a high of RM0.42. Since then, the stock has corrected & consolidated. It should find support at the horizontal line at RM0.25 or the upper line of the triangle at RM0.22.


Chart 2: Efficen's monthly chart as at 29/2/2015_11.45am (Source: ShareInvestor)

Conclusion

Based on improved financial performance & improving technical outlook, Efficen is a stock worth tracking. If the earnings continue to improve - and the valuation may become less demanding - a case can be made for buying into this stock.

Note:
In addition to the disclaimer in the preamble to my blog, I hereby confirm that I do not have any relevant interest in, or any interest in the acquisition or disposal of, Efficen.

Wednesday, May 27, 2015

DLady: Earnings dropped sharply

Result Update

For QE31/3/2015, DLady's net profit dropped by 50% q-o-q or 26% y-o-y to RM17 million while its revenue dropped by 25% q-o-q or 14% y-o-y to RM197 million. Revenue dropped q-o-q due to the phasing in of the relaunch of Dutch Lady Children Formula Milk. Additionally, in the immediate preceding quarter, higher sales of UHT was due to the seeding-in of the PureFarm range and strong sales of Dutch Lady Growing Up Milk to support “Mak Kata” promotion campaign. Profit before tax in Q1 2015 was lower compared to the preceding quarter due to the lower revenue


Table: DLady's last 8 quarterly results


Chart 1: DLady's last 28 quarterly results

Valuation

DLady (closed at RM46.80 yesterday) is now trading at a PE of 29 times (based on last 4 quarters' EPS of 162 sen). At this PE, DLady is deemed fully valued. Nevertheless, the DY of 4.7% will continue to be its strongest attraction.

Technical Outlook

Since October 2012, DLady has been moving sideways around RM46-48. Its indicators gave mixed reading, with monthly MACD hooked down & Slow Stochastic at the 50-mark. A breakout of the trading range of RM46-48 will point the way forward for the stock.


Chart 2: DLady's weekly chart as at May 26, 2015 (Source: Share Investor)

Conclusion

Based on poorer financial performance, demanding valuation & technical weakness, I would rate DLady as a REDUCE.

Note:
In addition to the disclaimer in the preamble to my blog, I hereby confirm that I do not have any relevant interest in, or any interest in the acquisition or disposal of, DLady.

Tuesday, May 26, 2015

Sign: Strong earning continued

Results Update

For QE31/3/2015, Sign's net profit increased by 10% q-o-q or 225% y-o-y to RM13.4 million while revenue  grew by 23% q-o-q or 109% y-o-y to RM88 million.


Table: Sign's last 8 quarterly results

 
Chart 1: Sign's last 29 quarterly results

Valuation

Sign (closed at RM2.38 yesterday) is now trading at a trailing PE of 6.9 times (based on last 4 quarters' EPS of 34.4 sen). At this PE multiple, Sign is deemed very attractive.

Technical Outlook

Sign broke out of a Cup-with-handle formation at RM1.60. A simple 1-to-1 price extension would put the price target at RM2.60-2.70. 


Chart 2: Sign's monthly chart as at May 25, 2015 (Source: ShareInvestor.com)

Conclusion

Based on strong financial performance, attractive valuation & positive technical outlook, Sign is rated a good stock for long-term investment.

Note: 
In addition to the disclaimer in the preamble to my blog, I hereby confirm that I do not have any relevant interest in, or any interest in the acquisition or disposal of, Sign.

Takaful: Share split timed to perfection

Results Update

For QE31/13/2015, Takaful's net profit increased by 55% q-o-q or 34% y-o-y to RM46 million while revenue rose by 40% q-o-q or 30% y-o-y to RM562 million. Revenue increased 40% y-o-y mainly attributable to higher sales generated by both Family Takaful and General Takaful business as well as higher net investment income. Profit before zakat and taxation increased by 39.1% y-o-y due to higher wakalah fee income and lower expense reserves.


Table: Takaful's last 8 quarters' results

From the Chart 1 below, we can see that the revenue is on the uptrend. Profit margin took a dip in the last 2 quarters. Despite the erosion in profit margin, profit soared last quarter due to the surge in revenue.


Chart 1: Takaful's last 36 quarters' results

Valuation

Takaful closed at RM15.45 yesterday. After adjusting a 1-to-5 share split, the revised closing share price would be RM3.09. This means that Takaful is now trading at a PE of 16.6 times (based on the last 4 quarters' EPS of 18.6 sen). At this PE multiple, Takaful is deemed fully valued.

Technical Outlook

The stock has been in an uptrend. On weakness, it may pullback to find support at the horizontal line RM2.75.


Chart 2: Takaful's monthly chart as at May 25, 2015 (Source: BTX)

Conclusion

Based on improved financial performance & bullish technical outlook, Takaful is still a good stock for long-term investment. However, its upside potential is limited as the valuation is fairly demanding.

Note:
In addition to the disclaimer in the preamble to my blog, I hereby confirm that I do not have any relevant interest in, or any interest in the acquisition or disposal of, Takaful.

Monday, May 25, 2015

Hevea: Earning improved

Results Update

For QE31/3/2015, Hevea's net profit increased by 57% q-o-q or 75% y-o-y to RM14 million while revenue increased 1% q-o-q or 11% y-o-y to RM116 million.

Revenue increased y-o-y due to increased revenue from the particleboard sector, due to higher volume and higher average selling price as a result of sales of higher grade, value added products and strengthening of USD.

Profit before taxation increased y-o-y due to the improved performance in the particleboard sector, despite being impacted by unrealised exchange loss of RM2.97 million from the translation of the USD denominated term loan.


Table: Hevea's last 8 quarterly results


Chart 1: Hevea's last 30 quarterly results

Valuation


Hevea (closed at RM3.08 in the morning session) is now trading at a PE of 8.1 times (based on last 4 quarters' EPS of 38 sen. At this PE multiple, Hevea is deemed fairly attractive.

Technical Outlook

Hevea has been on an uptrend since it broke above the horizontal line at RM0.85 in 2013. In early January this year, the stock broke into a new high- above RM2.00.I believe that the target price for the current rally is likely to be RM3.50.


Chart 2: Hevea's weekly chart as at May 25, 2015_12.30pm (Source: ShareInvestor)

Conclusion

Based on improved financial performance, attractive valuation & positive technical outlook, Hevea remains a good stock for long-term investment.

Note:
In addition to the disclaimer in the preamble to my blog, I hereby confirm that I do not have any relevant interest in, or any interest in the acquisition or disposal of, Hevea.

PetronM: Bottoming soon?

Background

Petron Malaysia Refining & Marketing Bhd ("PetronM") is involved in the manufacture and marketing of petroleum products in Malaysia. Its products include gasoline, diesel, liquefied petroleum gas, industrial and commercial fuels, and aviation fuel.

PetronM, formerly Esso Malaysia Bhd, is a subsidiary of San Miguel Corp ("SMC") of the Philippines. SMC bought over the company from Exxon Mobil Corp in 2011 for USD600 million.

Latest Quarterly Results

After six consecutive quarters of losses, PetronM returned to the black in QE31/3/2015. It reported a net profit of RM47 million on lower revenue of RM1.84 billion.

Revenue dropped 38% due to the lower selling prices as a result of lower oil prices. Sales volume remained flat at 7.2 million barrels. Product mix changed with higher sales of gasoline, LPG & aviation fuel & lower sales of retail diesel & exports.

Due to lower input costs (processed crudes) and its output (finished products), its gross profit & operating income improved significantly. This led to a net profit of RM57 million ( as compared to a net loss of RM48 million in QE31/12/2014 or RM7 million in QE31/3/2014).


Table: PetronM's last 11 quarterly results


Chart 1: PetronM's last 11 quarterly results

Financial Position

As at 31/3/2015, PetronM's financial position is deemed adequate, with current ratio at 1.2 times & gearing ratio at 1.6 times.  

Valuation

PetronM (closed at RM2.80 on May 22, 2015) is now trading at a PB of 0.93 times (based on NTA of RM3.02 p.s.). With a positive bottom-line and dividend, we can't compute PetronM's PER and DY. Unless PetronM's earning continues to recover, PetronM's valuation is deemed unattractive.

Technical Outlook

PetronM is resting at the lower line of its irregular upward channel at RM2.50. Unless the tentative earnings recovery frizzles out, this could be a good entry level for the stock.


Chart 2: PetronM's monthly chart as at May 22, 2015 (Source: ShareInvestor,com)

Conclusion

Based on tentative turnaround  & technical support sighted at present price, PetronM could be a good stock for a recovery play.

Note: 

In addition to the disclaimer in the preamble to my blog, I hereby confirm that I do not have any relevant interest in, or any interest in the acquisition or disposal of, PetronM.

POS: Bottom-line plunged (UPDATED)

Results Update

For QE31/3/2015, POS's net profit dropped by 57% q-o-q or 62% y-o-y to RM20 million while revenue was mixed- up 10% q-o-q but down 7% y-o-y _ at RM396 million.

Profit dropped due to lower volume of international business mail & registered mail; increased operating expenses in the courier segment despite higher sales volume; increased losses in the retail segment due to lower bill payment & financial services; and losses of RM0.4 million (compared to profit of RM6.6 million) in the Other segment (which covers sales of digital certificates, printing and insertion business and rental income).


Table: POS's last 8 quarterly results


Chart 1: POS's last 35 quarterly results

Valuation

POS (closed at RM4.94 on May 22, 2015) is now trading at PE of 21 times (based on last 4 quarters' EPS of 23.7 sen). With earnings growth receding into distance memory, this PE multiple is not justifiable. This may explain the steady selling by Aberdeen Asset Management & Mitsubishi UFJ Financial Group. However, this selling was absorbed by buying by EPF & KWAP. For Changes in Substantial Shareholders, go here.

Technical Outlook

For the medium-term, POS is likely to trade sideways between RM4.50 & RM5.50. A break below RM4.50 could see the stock testing its long-term uptrend line at RM4.00. That's good entry level to this stock as its management team works overtime to reverse its recent profit downturn.


Chart 2: POS's monthly chart as at May 22, 2015 (Source: ShareInvestor.com)

Conclusion

Based on poorer financial performance & unattractive valuation, I would rate POS a SELL INTO STRENGTH.

Note:
In addition to the disclaimer in the preamble to my blog, I hereby confirm that I do not have any relevant interest in, or any interest in the acquisition or disposal of, POS.

GCB: Losses reduced

Results Update

For QE31/3/2015, GCB reported a small net loss of RM1.9 million as compared to a net loss of RM8.7 million in the immediate preceding quarter or a net profit of RM5.3 million last year. Revenue decreased by 11% q-o-q or 8% y-o-y to RM442 million.

Pre-tax losses decreased q-o-q mainly due the increased sales volume and selling price of cocoa butter, while sales price of cocoa cake and powder picked up. The higher net gain on commodity future and option contract also contributed to the decrease of loss before tax for current quarter.


Table: GCB's last 8 quarterly results

GCB's profit & profit margin seems to have bottomed. They are both poised for recovery.


Chart 1: GCB's last 41 quarterly results

Financial Position


As at 31/3/2015, GCB's financial position is fairly tight with current ratio at 1 time and gearing ratio at 3.8 times. The high gearing is the result of high borrowings to finance its inventory which is equivalent to 160 days of sales. This maybe due to the nature of business where you may choose to take advantage of low prices of cocoa bean by stocking up or you may choose not to sell processed cocoa products due to lower prices.

Cocoa Prices


As a grinder, GCB processes cocoa beans to yield roughly equal parts butter, which gives chocolate its melt-in-the-mouth texture, and powder, which is used in cakes, biscuits and drinks. For more on cocoa business, check out this link.

As a downstream commodity player, GCB's bottom-line is determined to a large extend by its hedging strategy and the movement in the cash market. If it has not hedged its cocoa bean purchases, lower cocoa bean prices works in its favor. Conversely, if it has not hedged its cocoa butter & powder sales, rising prices would work in its favor. That's what happened in the past few months and it may explain why GCB's bottom-line has improved.


Chart 2: Cocoa bean price chart as at May 22, 2015 (Source: ICCO.org)


 Chart 3: Cocoa price chart as at May 22, 2015 (Source:Tradingeconomics.com)

Valuation

GCB (closed at RM0.84 on May 22, 2015) is now trading at 1.2 times its NTA (of 68 sen as at 31/3/2015). Due to losses incurred, we can;t compute its PE multiple, nor can we compute its DY as it did not pay any dividend. Thus, it is hard to gauge whether the current price is a fair price for this stock.

Technical Outlook

GCB has been on a downtrend since it peaked in 2012. The strong support would be at RM0.40-0.50. Indicators have not given any signal that the stock may be bottoming soon.


Chart 3: GCB's monthly chart as at May 22, 2015 (Source: ShareInvestor)

Conclusion

Based on poor financial performance & tight financial position, bearish technical outlook & unattractive valuation, GCB is a stock to be avoided. It is worth watching for the next 1-2 quarter(s) to determine whether the bottom-line would improve along with recent improvement in cocoa prices. When that happens, GCB's share prices should recover.

Note:
In addition to the disclaimer in the preamble to my blog, I hereby confirm that I do not have any relevant interest in, or any interest in the acquisition or disposal of, GCB.

Friday, May 22, 2015

Airasia: A strong support broken

Airasia broke the horizontal support at RM2.20 yesterday and closed at RM2.16 (see Chart 1). Instead of recovering, it went down further to RM2.04 as at 4:00pm today. The stock is likely to test RM2.00 next week. I will be very surprise if the RM2.00 psychological mark were to fail if a decent fight. Having said that, I believe the strong support will surface when the stock reach the RM1.80 mark. This is the confluence of the horizontal support and the lower line of the downward channel that dates back to 2011.


Chart 1: Airasia's weekly chart as at May 22, 2015_3.55pm (Source: ShareInvestor)


Chart 2: Airasia's monthly chart as at May 22, 2015_3.55pm (Source: ShareInvestor)

I expect more weakness or downside for Airasia for near term. Good entry will be at RM1.80. For the braveheart, you can try a bit at RM2.00.


Note:
In addition to the disclaimer in the preamble to my blog, I hereby confirm that I do not have any relevant interest in, or any interest in the acquisition or disposal of, Airasia.

Market Outlook as at May 22, 2015

FBMKLCI & FBMEMAS are again back to the low recorded two weeks ago (point 'A'). If they go below this level, then a medium-term downtrend could begin. This would be the end of the 5-month rally that dated back to December last year. Even the support at 1770-1780 for FBMKLCI or 12100-12300 for FBMEMAS would be a poor consolation if the downtrend starts. 


Chart 1: FBMKLCI's daily chart as at May 21, 2015 (Source: ShareInvestor.com)


Chart 2: FBMEMAS's daily chart as at May 21, 2015 (Source: ShareInvestor.com)

The sharp drop in the market today seems to coincide with the news reports that Deputy Prime Minister ('DPM') has called for the sacking of the Board of Directors of 1MDB. Is this the breaking of rank between our DPM & the PM on the issue of 1MDB? Would this lead to a bigger riff and a challenge for the Presidency in UMNO?

Stock markets abhor uncertainty, especially political uncertainty. This will add to the growing list of concerns, which includes poor consumer sentiment, uncertainty in the Euro-zone, heightened geopolitical risk in the Middle East and weak global economy. Despite all these, the stock market is in its 7th year high- thanks to the unconventional monetary policies from US Federal Reserve, ECB, Japanese central bank and a host of other central banks. Where will we be without easy money?!

Kossan: Earnings continued to rise

Result Update

For QE31/3/2014, Kossan's net profit increased 20% q-o-q or 23% y-o-y to RM45 million while revenue increased 2% q-o-q or 21% y-o-y to RM369 million. Bottom-line increased due to higher pre-tax profit contribution from the Gloves division, which had more than offset the decline in pre-tax profit contribution from the Technical Rubber division.

The Gloves division saw higher revenue due to higher volume sold (increase of 4.5%) & higher selling prices (increase of 2.5%). Higher  sales,  better product mix and improved production efficiency led to a  28.1%-increase in profit before taxation.

The Technical Rubber Products division saw lower Revenue and PBT due to softer demand as a result of weak world economy & local market uncertainty (caused by GST implementation) plus completion of projects to supply infrastructure projects.

Finally, Kossan's Clean-room division managed to record improved pre-tax profits of 24.8% (to RM0.88 million) despite a marginal 7.2%-decline  in  revenue.


Table: Kossan's last 8 quarterly results

Kossan's top-line & bottom-line continued their steady growth. Due to its efficient production process, the profit margin is also on the upward trend.


Chart 1: Kossan's last 35 quarterly results

Valuation

Kossan (closed at RM6.20 yesterday) is now trading at a PE of 26 times (based on last 4 quarters' EPS of 23.8 sen). At this PE multiple, Kossan is deemed fully valued.

Technical Outlook

Kossan is in a long-term uptrend, with share prices moving higher within a channel. The strong momentum could send the share prices to test the upper line.


Chart 2: Kossan's weekly chart as at May 21, 2015 (Source: ShareInvestor.com)

Conclusion

Based on improved financial performance & positive technical outlook, Kossan is a good stock for long-term investment. However, its demanding valuation could cap its upside potential.

Note:
In addition to the disclaimer in the preamble to my blog, I hereby confirm that I do not have any relevant interest in, or any interest in the acquisition or disposal of, Kossan.

Tuesday, May 19, 2015

Shell: Green Shots of Recovery?

Background

Shell Refining Co. (F.O.M.) Berhad (“Shell”) is involved in the refining and manufacturing of petroleum products in Malaysia. Its 125,000 barrels/day refinery is located in Port Dickson. Due to low margin, the company is examining long-term options, which may include the potential sale of the refinery or its conversion to a storage terminal. For more, go here.

Latest Quarterly Results

For QE31/3/2015, Shel reported a net profit of RM84 million on a revenue of RM2.48 billion. Bottom-line recovered from a net loss of RM916 million recorded in the immediate preceding quarter, QE31/12/2014 or a net loss of RM44 million recorded in the same quarter last year, QE31/3/2014. Improved bottom-line is contributed by improved refining margins and losses in Q4 2014 due to stockholding losses of RM445.8 million and impairment losses of RM 461 million. Revenue dropped q-o-q by 15% to RM2.5 billion due to decreasing product prices.


Table: Shell's last 8 quarterly results


Chart 1: Shell's last 35 quarterly result

Financial Position

As at 31/3/2015, Shell's financial position is deemed challenging, with current ratio at 1.03 times & gearing ratio at 6.31 times. If not for the confidence in its major shareholder, Shell Overseas Holdings Ltd (a part of the Royal Dutch Shell plc, ahich is in turn one of the six Oil & Gas supermajors as well as the 4th largest company in the world in 2014 in term of revenue).

Valuation

Shell (closed at RM4.90 yesterday) is now trading at 3.6 times its book value (based on NTA of RM1.36 as at 31/3/2015). We can't compute its PE multiple as the company made a loss of RM3.53 per share in the last quarters. In addition, Shell has ceased paying dividend since FY2013. Thus, Shell's valuation is deemed demanding based on these models (PBR, PER & DY). The only justification to get into this stock is that its earning could be reaching its trough. As the saying goes, what goes up must coming down. Conversely, what goes down must come up.

Technical Outlook

Shell has been in a steady & sharp decline for the past 4 years.

 
Chart 2: Shell's monthly chart as at May 18, 2015 (Source: ShareInvestor,com)

If we put Shell's monthly chart next to its earning chart for the past 10 years, we can see that the price  movement tracks the earning trend fairly well. To gauge when to buy, we need to know when the earning has bottomed. The over-sized loss in QE31/12/2014 & the small profit in QE31/3/2015 could mark the bottom & recovery in the earning.


Chart 3: Shell's monthly price chart & earning chart from FY2005 until today  

Conclusion

Based on improved financial performance, Shell could be a good stock for long-term investment. However, any entry should be carried out very slowly as the earning recovery is still very tentative.

 Note:
In addition to the disclaimer in the preamble to my blog, I hereby confirm that I do not have any relevant interest in, or any interest in the acquisition or disposal of, Shell.

Monday, May 18, 2015

GLBhd: Upside Breakout

Golden Land Bhe ("GLBhd", formerly Tanah Emas Corporation Bhd) has broken above the line connecting its recent peaks, RR at RM1.35 last Friday. With this bullish breakout, the stock may rise to its potential target price of RM1.75.

Based on technical breakout, GLBhd could be a trading BUY.


Chart: GLBhd's monthly chart as at May 15, 2015 (Source: ShareInvestor.com)

Note: 
In addition to the disclaimer in the preamble to my blog, I hereby confirm that I do not have any relevant interest in, or any interest in the acquisition or disposal of, GLBhd.

Friday, May 15, 2015

YSPSAH: Bottom-line soared

Background

Y.S.P.Southeast Asia Holding Berhad (“YSPSAH”) is involved in the importation, export, and tradeing of various kinds of pharmaceutical products as well as the manufacturing of pharmaceutical products.

Latest Quarterly Results

For QE31/3/2015, YSPSAH's net profit rose 33% q-o-q or 71% y-o-y to RM9.3 million while revenue rose 8% q-o-q or 15% y-o-y to RM59.3 million. revenue rose q-o-q due to higher demand of the Group's products especially from export segment. Bottom-line improved due to higher revenue, more efficient operations and lower cost margin for product mix during the quarter under review.

 
Table: YSPSAH's last 8 quarterly results

/
Chart 1: YSPSAHs last 11 quarterly result


Chart 2: YSPSAH's last 11 yearly result

Financial Position

As at 31/3/2015, YSPSAH's financial position is deemed satisfactory, with current ratio at 4.4 times & gearing ratio at 0.3 times. Cash balances stood at RM56 million before deducting loan & borrowings totaling RM17 million & finance leases totaling RM7 million. After netting off, the net cash balances stood at RM32 million (or, 24 sen p.s.).

Valuation

YSPSAH is rallying in early morning trades now. As at 9.30am, it trading at RM1.80 or at a PE of 9 times (based on last 4 quarters' EPS of 20.4 sen). At this PE, YSPSAH is deemed undervalued. It could command a PE multiple of 10-12 times for a smallcap pharmaceutical stock in the current environment.

Technical Outlook

YSPSAH broke above its horizontal line at RM1.25 in June 2013 & rallied to a high of RM1.85 in May 2014. Further upside would only come if YSPSAH can break above the RM1.85 mark.


Chart 3: YSPSAH's monthly chart as at May 14, 2015 (Source: ShareInvestor,com)

Conclusion

Based on improved financial performance, healthy financial position & attractive valuation, YSPSAH could be a good stock for long-term investment.

 Note:
In addition to the disclaimer in the preamble to my blog, I hereby confirm that I do not have any relevant interest in, or any interest in the acquisition or disposal of, YSPSAH.

Thursday, May 14, 2015

Tienwah: Bottom-line worsened

Result Update

For QE31/3/2015, Tienwah's net profit rose 167% q-o-q to RM2.1 million while revenue was only marginally higher at RM87.5 million. Compared to the same quarter last year, net profit was 52% lower while revenue was 5% higher.

Tienwah's PBT dropped q-o-q from RM1.5 million to RM1.2 million. While the drop is small, it must be noted that PBT for QE31/12/2014 was significantly impacted by a series of one-off  items, such as sales  rebate  of RM3.9  million, redundancy  expenses  of  RM2.0 million  and  write -down  of inventories to net realizable value of RM2.2 million. If these exceptional items were excluded, PBT for QE31/12/2014 would have been much higher at RM9.5 million. And, the q-o-q drop in PBT would have been RM8.5 million (instead of only RM0.3 million). Thus, Tienwah's financial performance has worsened contrary to my earlier expectation.


Table: Tienwah's last 8 quarterly results


Chart 1: Tienwah's last 32 quarterly results

Valuation

Tienwah (closed at RM1.86 yesterday) is trading at a PE of 16 times (based on my projected EPS 11.7 sen). If the one-off items booked in QE31/12/2014 were excluded, the last 4 quarters' EPS would be higher at 20.0 sen and the PE multiple would be lower at 9.3 times. Since Tienwah's earnings showed no improvement in QE31/3/2015, there is no point in worrying about under-estimating its earnings going forward... for now. At the PE multiple of 16 times, Tienwah is deemed fairly valued.

Technical Outlook

As noted previously, Tienwah has been in a gradual downtrend since the beginning of 2014. It seems to have found its support at RM1.85-1.87.


Chart 2: Tienwah's weekly chart as at May 14, 2015_10.30am (Source: Share Investors)

From the monthly chart, we can see that the stock is however in a long-term uptrend with support at RM1.70.

 
Chart 3: Tienwah's monthly chart as at May 14, 2015_10.30am (Source: Share Investors) 

Conclusion

Despite the poor financial performance, Tienwah could be a good stock for long-term investment based on its mildly positive technical outlook.

Note: 
In addition to the disclaimer in the preamble to my blog, I hereby confirm that I do not have any relevant interest in, or any interest in the acquisition or disposal of, Tienwah.

SEG: Earnings improved

Result Update

For QE31/3/2015, SEG's net profit rose 131% q-o-q or 50% y-o-y to RM10.8 million while revenue increased by 14% q-o-q or 10% y-o-y to RM67 million. The improvement is due to seasonally factor.


Table: SEG's last 8 quarterly results


Chart 1: SEG's last 28 quarterly results

Valuation

SEG (closed at RM1.46 yesterday) is now trading at a PE of 36 times (based on last 4 quarters' EPS of 4.11 sen). At this PE multiple, SEG is deemed over valued.

SEG paid out dividend totaling 11 sen for FY2014. For FY2015, the interim dividend of 7 sen is higher than FY2014 interim of 5 sen. Assuming the final dividend is similar to the interim dividend, FY2015 dividend will amount to 14 sen. Thus, SEG's DY is very attractive at 10%.

Technical Outlook

SEG broke above its intermediate downtrend line, RR at RM1.45-1.46 in April. The upside is capped by the horizontal line at RM1.48. See Chart 2.


Chart 2: SEG's weekly chart as at May 14, 2015_10.30am (Source: ShareInvestor.com)

If SEG can surpass the resistance at RM1.48 (preferably, the psychological RM1.50 too), the stock may revisit its high at RM2.00.


Chart 3: SEG's monthy chart as at May 14, 2015_10.30am (Source: ShareInvestor.com)

Conclusion

Based the improved financial performance & mildly positive technical outlook, SEG could be a good stock for a trading BUY. Its high DY would certainly make it an income stock.

Note: 
In addition to the disclaimer in the preamble to my blog, I hereby confirm that I do not have any relevant interest in, or any interest in the acquisition or disposal of, SEG.