Saturday, March 29, 2008

Weekend reading

This week has been a pretty good week for investors who have gone long on stocks earlier. Still, one could come across many gloom & doom stories that argue for caution. The case for buying stocks in the market now is, however, gaining ground.

If you like something for weekend reading- something that is cautiously bullish on the equity market- then I may have just the thing for you. The first story is entitled 'The Great Deleveraging' from Henry To, which will remind us of two old adages, i.e. 'Don't fight the Fed' and 'Don't fight the Tape'. The second article is the 4th Quarter 2007 commentary from Bill Miller, the Chairman & Chief Investment Officer of Legg Mason. Bill Miller, who is regarded as one of the greatest funds manager in the US, did not have a good year in 2006 & 2007. A few of the points made in this commentary are very interesting, but the most captivating comment is this:

The monetary and fiscal authorities have now begun to move with alacrity, with the Fed cutting the funds rate to 3.0% (with likely more to come), and the administration and Congress coming up with a fiscal stimulus package estimated at around $150 billion dollars.

Will it be successful? Yes. More precisely, if these measures aren’t enough to free up credit and stimulate spending sufficient to set the economy on a growth path, then additional measures will be taken until that is accomplished. The important point is that the monetary and fiscal policy makers are focused and engaged, and will do what is necessary to stabilize the markets and restore confidence. This does not mean that the recovery will be swift, or seamless, or without additional trauma. But there will be a recovery, and I think the market abounds with good value. Those values may get even better if the markets get more gloomy, but they are good enough now for us to be fully invested. (The italic & bold letterings are mine).

Yes, the market is abound with stocks trading at very attractive multiples. If you haven't bought for your portfolio, I think it is still not too late to buy. The top blue chips, like Tenaga, Maybank & Sime Darby are very attractive. In the property sector, you can buy into stocks like IGB, Sunrise, Suncity and Mah Sing. Construction & construction-related stocks like IJM, MMC, MRCB and WCT had been beaten down badly & may recover after the Malaysian political scenario has stabilized.

Happy reading & have a good weekend.

Friday, March 28, 2008

VS maintained its net profit track record

VS has just announced its results for 2Q2008 (which ended 31/1/2008). Its net profit increased by 0.6% q-o-q or 27.8% y-o-y to RM21.2 million. Turnover has also increased by 14.7% q-o-q or 25.6% y-o-y to RM333 million.


VS (closed at RM2.84 yesterday) is now trading at a trailing PE of 5.0 times (based on last 4 quarters' EPS of 57 sen) or at a P/Book of 1.3 times (based on its NTA per share of RM2.22 as at 31/1/2008). At these multiples, VS is deemed inexpensive.

In December last year, I have recommended taking profit on this stock at the then-prevailing price of around RM3.90. Since then, the share price has eased off a bit. From the chart below, the share price's uptrend had accelerated twice from A-A to A1-A1, then to A2-A2. The A2-A2 uptrend line was violated in January this year. The stock appears to have found some support at the A1-A1 uptrend line. Horizontal supports can be seen at RM2.50 & RM2.30, while overhead horizontal resistance levels are at RM2.80 & RM3.10.


Chart: VS' weekly chart as at March 26, 2008 (courtesy of Quickcharts)

Based on attractive valuation & tentative improvement in technical outlook, VS could be a BUY for the medium-term.

While most investors know VS as a manufacturer & assembler of electronic and electrical products and plastic moulded components and parts, not many are aware that it has an associate, VS Mining which is involved in the supply of coal to Tenaga's Manjung plant as well as to Indonesia Power. In addition, VS Mining has a subsidiary, PT Berkat Banua, which has 5 licences for coal extraction in a 902-hectare area in Kalimantan, Indonesia (with estimated reserves of 50 million tonnes). It will be interesting to see how the recent increases in coal prices will benefit VS. You can read more about VS' coal business in this report from the EdgeDaily.

Thursday, March 27, 2008

Tranmil rebounding...

Tranmil has a very strong rally yesterday. The company has announced that it is not aware of the reason for the sharp price rise.

From the chart below, we can see that the share price has broken above the immediate downtrend line resistance at RM1.60 about 4 days ago. The longer term downtrend line is still intact. The share's further rise should encounter resistance at RM2.60 & RM3.00.


Chart: Tranmil's daily chart as at March 26, 2008 (courtesy of Quickcharts)

Haio's net profit increased

Haio has just announced its results for 3Q2008 (which ended 31/1/2008). Its net profit increased by 47% q-o-q or 170% y-o-y to RM13.4 million. Turnover has also increased by 25% q-o-q or 95% y-o-y to RM100.5 million. The company attributed its improved performance to higher sales from the MLM division and higher margin achieved by the wholesale and retails divisions.


Haio (closed at RM3.00 as at March 26th) is now trading at a trailing PE of 5.8 times (based on last 4 quarters' EPS of 52 sen) or at a P/Book of 1.9 times (based on NTA per share of RM1.57 as at 31/1/2008). At this rate of growth, Haio's current price is deemed undemanding.

The share price has recently corrected like the rest of the market. It had eased off the high of RM3.40 to a low of RM2.71. A few rebounds off this low were blocked by the RM3.00 resistance level.


Chart: Haio's weekly chart as at March 26, 2008 (courtesy of Quickcharts)

Wednesday, March 26, 2008

Tenaga- a quicktake

Tenaga share price has suffered badly from the fear that it might not be able to pass on recent cost increases to the consumers in the form of higher tariff rates. As a result, the share price has dropped sharply & broke below its strong horizontal support at RM6.80 (making a low of RM6.60 on March 13th). Yesterday, the stock rebounded to close at RM7.35.

From the monthly chart below, we can that Tenaga has strong horizontal support at RM6.80-7.00, with next support at RM6.00. On the upside, Tenaga would encounter resistance at RM7.80-800 and thereafter at RM9.00-20.

For the 1Q2008 (i.e. QE30/11/2007), Tenaga reported a net profit of RM1.52 billion on a turnover of RM6.21 billion. For FYE31/8/2007, Tenaga reported a net profit of RM4.06 billion on a turnover of RM23.23 billion.

Based on yesterday's closing price of RM7.35, Tenaga is now trading at a PE of 7.7 times (using its 2007 EPS of 94.9 sen) or at a P/Book of 1.25 times (using its NTA per share of RM5.90 as at 30/11/2008). For a blue-chip utilities stock, Tenaga is fairly attractive.

I believe that Tenaga could be a good BUY for long-term investment. Try buying this stock at RM7.00 level.


Chart: Tenaga's monthly chart as at March 25, 2008 (courtesy of Quickcharts)

MMCCorp- a quicktake

MMCCorp needs no introduction. It is a well-diversified group involved in transport & logistics; energy & utilities; and engineering & construction. For more details, do visit their website (here).

The stock had broken below its accelerated uptrend line support at RM4.10 in late February this year. The share price dropped sharply to hit a low of RM2.69 on March 19th (compared to a high of RM4.92 on January 14th). The share price has recovered over the past few days to close at RM3.10 yesterday. At 10.00 am this morning, it is at RM3.30.

The immediate horizontal support for this stock is at RM3.00 while the longer term uptrend line support is at RM2.50. The immediate horizontal resistance is RM3.60.

For the FYE31/12/2007, MMC reported a net profit of RM187 million on a turnover of RM1.845 billion. At the present price of RM3.30, MMC is trading at a PE of 9.1 times (based on 2007EPS of 36.2 sen) or at a P/Book of 0.9 times (based on NTA per share of RM3.85 as at 31/12/2007).

I believe that MMC could be a good BUY for the medium-term if the share price were to ease back to RM3.00-10.


Chart: MMCCorp's weekly chart as at March 25, 2008 (courtesy of Quickcharts)

Tuesday, March 25, 2008

What's a "Double Nine-to-One" Bullish Signal?

In his latest article entitled "1-2-3", Jeffrey Saut wrote that the US market had recently witnessed a very bullish "Double Nine-to-One" signal. What is a Double 9:1 day? For that matter, what is the difference between a 9:1 day & a 90% day? Read up this article (go here or here) to learn more about this bullish signal.

Jeffrey Saut concluded his artcle by stating:

How bullish are “Double Nine-To-One” signals? According to professor David Aronson, as reprised by Mark Hulbert, “[we used] data from the beginning of 1942 through fall of 2006, and looked at what happens in the stock market in the 60-trading-day period following a . . . Double Nine-To-One signal, versus what happens the rest of the time. In those 60-trading-day windows, the S&P 500 index produced an average annualized return of over 22%, on the assumption that an investor entered the market on the close the day after the Double Nine-To-One signal was triggered and held until the end of the 60th trading day.
Now, you know why the market is so bullish today.

Market Outlook as at March 24, 2008

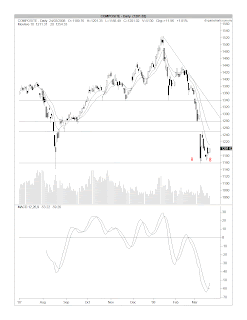
On March 21st, I have commented that a fat pitch is likely to come our way soon & we may swing for the fences. How far could this market run? I think the immediate resistance would be 1251, which is the high recorded on March 12th. The market may surpass this resistance & close the gap at 1277-80. Thereafter, the market may test the psychological resistance of 1300.

On the downside, I expect support at the psychological 1200 level and thereafter at the recent low of 1157 recorded on March 10th (marked as 'A'). You can see that the KLCI did a 'Test of the Low' on March 18 when it recorded a low of 1167 (marked as 'B'). The failure to make a new low & the subsequently recovery are positive signs for our market. I shall treat the March 10th low as an 'internal' low and hopefully a low that will stand up in the event of subsequent downside retest.


Chart: KLCI's daily chart as at March 24, 2008 (courtesy of Quickcharts)

Note: As at 9.30 am, the KLCI has gained 17 points and stood at 1218.

Friday, March 21, 2008

CPO prices testing its medium-term uptrend line

In line with the correction in the prices of many commodities, our CPO has similarly given up some of its recent gain. From Chart 1 below, we can see CPO prices have dropped from its recent high of RM4500 per tonne to RM3250 per tonne. Currently, CPO prices are holding onto its medium-term uptrend line.


Chart 1: CPO's daily chart as at March 20, 2008 (source: ifs.marketcenter.com)

Another edible oil, soya oil has broken below its medium-term uptrend line yesterday. See the chart below.


Chart 2: Soya Oil's daily chart as at March 20, 2008 (source: futures.tradingcharts.com)

As noted in the earlier post, the correction in commodity prices is now underway, due to the strengthening of the USD. I believe that our CPO index will follow closely the trend of CRB index. Nonetheless, I hope that the CPO index can maintain above the uptrend line at RM3250 per tonne. A failure to do so will lead to further downside and will also lead to further correction in the prices of plantation stocks.

Commodities' strength sapped by USD rebounce

Recently, there were a number of warning that the big rise in commodity prices might be peaking. One such warning was from David Roche, the President of Independent Strategy, a London-based investment consultancy, who wrote in the Financial Times (go here).

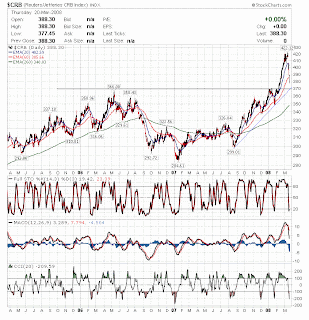
Looking at Chart 1 below, we can see that the Reuters-CRB Index has indeed corrected very sharply in the past 6 days, dropping from a high of 422 (recorded on March 13) to an intra-day low of 377 yesterday (before closing at 388). The drop in CRB index coincides with the sharp rebounce in USD index (see Chart 2 below). The correction in the CRB index has also affected many commodity prices, including CPO.

If we examine the CRB index, we can see that the immediate medium-term uptrend line support is at 370 level. This also coincides with the horizontal support at 366-370 level.


Chart 1: CRB's 3-year daily chart as at March 20, 2008 (source: Stockcharts.com)


Chart 2: USD Index's 3-year daily chart as at March 20, 2008 (source: Stockcharts.com)

The floodgates are opened

Last few days, Morgan Stanley revisited the arguments contained in its article entitled The Great Monetary Easing of 2008 (dated January 3, 2008), where it opined that that many central banks, led by an aggressive Fed, would shift towards an easier monetary policy stance in 2008, thus starting a new global liquidity cycle. While anticipating global inflation pressures to remain high, Morgan Stanley expected many central banks to eventually put concerns about economic growth and financial stability above inflation worries.

The Fed’s current easing cycle, which involves taking the real rate of interest to zero, would be carried out in 3 phases:

  • In Phase 1, which lasted from the summer to December of last year, policymakers returned the fed funds rate from a restrictive 5.25% to a broadly neutral level of 4.25%.
  • In Phase 2, rates were reduced by a total of 125bp to the current level of 3% in two steps in January, which turned monetary policy expansionary.
  • Phase 3, which we are entering now, is about pushing the real policy rate to and below zero.

In response to the rising strains in the financial system, further dollar weakness and the large Fed rate cut, other central banks are now more likely to ease (or tighten by less) too:

  • The ECB is expected to cut rates by 25bp later this year & once again at the beginning of next year.
  • The BoJ may go for a 25bp rate cut in the April-June quarter, once the BoJ leadership issue is resolved.
  • In the UK and Canada, Morgan Stanley expects central banks to cut rates at the next meeting in April.
  • In Australia, RBA's rate hike is expected to be less likely.
  • In China, further interest rate increases are less likely in an environment where the Fed is slashing rates.

Taken together, Morgan Stanley feels that the Fed’s and other central banks’ recent and prospective action is likely to bring an end of the bear market in credit and eventually a recovery of asset markets and the global economy in 2009. You can read Morgan Stanley's recent updates on the Great Monetary Easing (here & here).

It is debatable whether an end to the credit crunch is near. Some, like Jeremy Grantham, feel that the credit crisis still has a long way to run. With poor employment data & increased home foreclosures, the US economy is considered by many to be in a recession ( go here & here). Thus, the outlook for US equity is grim (see this article).

Nevertheless, I believe that the moment is at hand for those who have been waiting for the fat pitch. In a recent article entitled Wait for the fat pitch, Jeffrey Saut wrote:
Warren Buffett has often quoted legendary baseball player Ted Williams, who stated, “Waiting for the right pitch is the most important thing for a batter.” Of course, Mr. Buffett modifies Williams’ quote for the investing world by noting, “There are no called strikes so you can watch stocks come by and wait and wait until the right pitch and no one is going to call a strike (on you).” Buffett goes on to say, “Wait for the fat pitch and then swing for the fences!”
With the floodgates opened wide, I believe the US equity market is likely to experience a fairly strong rally for the next 2-3 weeks. Whether this rally is enough to change the medium- to long-term outlook of the equity market is yet unknown. It is likely to push the Dow up 1000 points from the recent lows. In the process, most equity markets will enjoy a similar rally. Despite our political uncertainties, I believe our Malaysian stock market will also firm up during this period.

Wednesday, March 19, 2008

Plywood prices recovering?

Recently, there was a report in the Edge Daily that plywood prices have rebounded after dropping for much of 2007 (go here). That article quoted a recent Credit Suisse research report, which notes: "Plywood prices have bottomed out and are beginning to pick up. We expect this good news to trigger a sector re-rating, especially since share prices have collapsed." Could this be the reason why Ta Ann's share price has been firming up (see my earlier post). However, the same share price recovery was not observed for other timber stocks, such as Lingui, JTiasa & Subur.

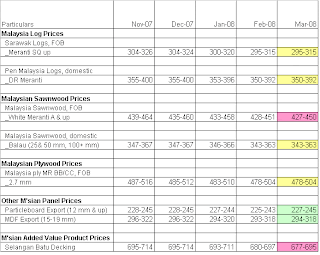
I have just received the latest ITTO report for March 2008 (an extract is tabulated below). From this table, we can see that there is some improvement in the prices of particleboards & MDF, while some sawnwood prices are still sliding. The prices of plywood and logs remained unchanged.


Source: The ITTO Tropical Timber Market Reports

Based on the above, it is still too early to call a Buy on the Timber sector, with a possible exception of Ta Ann. The improved prices for particleboards & MDF could be good news for Evergreen.

Tuesday, March 18, 2008

FT Alphaville- a new link added

I have added a new link, i.e. FT Alphaville, which is a "blog" affiliated to the Financial Times. It is "a free daily news and commentary service giving financial market professionals the information they need, when they need it".

I have been reading up on some of its articles for the past few weeks and I must say that it provides very relevant commentaries on many of the important developments in the global financial markets and economy. For example, there are 2 commentaries posted today that I believe you may like to read up. The first commentary deals with the possible big fall in commodity prices (go here) and the second commentary deals with the extreme measures that the Fed has taken & more measures that it may have to take in order to cope with the current financial crisis in the US (go here).

When I first started this blog, I used to post an entry during the weekend, where I would highlight some of the interesting articles that I had come across (with links provided). This weekend linkfest post was very time-consuming (see this example) and I had since discontinued it. I may, from time to time, point out some interesting articles, if they can provide some background as to why & how some events or developments are affecting the global financial markets and economy, and consequently, our stock market.

Wednesday, March 12, 2008

Dow rebounded

Yesterday,the Fed promised a $200 billion booster shot for ailing markets -- and Wall Street answered with its biggest bounce in more than five years. Acting in concert with the European Central Bank, the Bank of Canada and the Swiss National Bank , the Fed agreed to loan investment banks money in exchange for debt, including slumping mortgage-backed securities. The idea is to create a market for assets that investors have recently been too scared to buy. That freeze in demand had sent asset values plunging and caused huge losses for some of the world's biggest banks. (Source: Yahoo Finance)

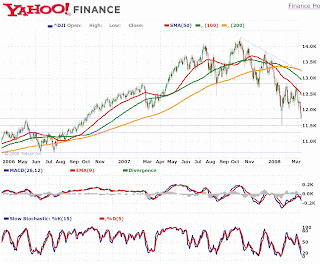
A strong rebounce in the Dow has broken the streak of losses which saw the index breaking below the psychological 12000 level last week (see Chart 1). In the next few days, Dow is likely to continue its upleg. The immediate resistance is at 12600 to 12800 level (see Chart 2 below).


Chart 1: Dow's 5-day daily chart as at March 11, 2008 (source: Yahoo Finance)


Chart 2: Dow's 2-year daily chart as at March 10, 2008 (source: Yahoo Finance)

Note: The latest move by the Fed must be viewed in the light of some very negative development, such as the failure of some investment firms to meet margin calls, sparking fears of forced selling and further deleveraging. Read more about it here and here.

Tuesday, March 11, 2008

Dow may test the January low of 11508 soon

Dow, which is currently resting on the horizontal support of 11700, may test its January 22nd low of 11508. Looking at the chart below, there is a good chance that this support may not hold. A break below this support could see the Dow testing the next support at 11300 or the psychological support of 11000. A break of the latter could send many equity markets in another tailspin. Let's hope that will not happen.


Chart: Dow's daily chart as at March 10, 2008 (source: Yahoo Finance)

Market Outlook as at March 10, 2008

What we had witnessed yesterday is called 'Panic Selling', which is defined as "a flurry of selling in a particular security or in securities as a whole... accompanied by particularly heavy volume and sharp price declines as owners scramble to sell before prices drop even more. Panic selling is generally set off by an unexpected event viewed by traders as particularly negative." (Source: Financial Dictionary). For more on this subject, check out Investopedia.com.

Normally, the price of the securities tend to recover, after the market has fully digested the unexpected event & its financial impact. However, in some cases where the event is a continuing event (eg. Transmile's fraudulent book-keeping or the US subprime & credit crunch problem), the market will revisit the problem & the selling will continue unabated.

The unexpected event is of course the shocking results of our recent General Election. Has the market absorbed the full impact of this event? I think what the market did immediately after the results was to price in a higher political risk factor. This price-finding process, which was done in a hectic fashion, could have substantially factored in the new political reality in Malaysia. Unless there is political problems over the next few weeks or months, I believe that yesterday's low of 1157 will be the internal low & one may slowly accumulate some quality stocks that had been beaten down.

From the daily chart, we can see that the immediate support is at 1140 level, while the immediate resistance will be the level where the market gapped lower yesterday, i.e. 1280.


Chart 1: KLCI's daily chart as at March 10, 2008 (courtesy of Quickcharts)

The weekly chart shows that the KLCI has broken below its uptrend line that commenced from June 2006. Unless the KLCI can recover above the uptrend line (at 1270 level), the technical outlook for the market will be bearish and we should reduce our exposure to equity.


Chart 2: KLCI's weekly chart as at March 10, 2008 (courtesy of Quickcharts)

In the event that the market continue to trend lower, we can see that KLCI should find support at the immediate horizontal support of 1090 and the next horizontal support of 1020. Longer term uptrend line support is at 1030 level. Hopefully, we will not have to see the KLCI testing these levels anytime soon.


Chart 3: KLCI's monthly chart as at March 10, 2008 (courtesy of Quickcharts)

Monday, March 10, 2008

Trading Halted at 3.58 pm

At 3.58 pm, Bursa made history. For the first time in Bursa's history, trading was halted (for 1 hour) because the KLCI has dropped 10% from last Friday's close of 1296.33.

Stocks will come under selling pressure

The shocking outcome of the 12th General Election will very likely lead to selling pressure in the days ahead. Generally, in times of uncertainties, consumers & investors are likely to be cautious and this will likely impact new business investments as well as consumers' spending on big ticket items. In addition, we can expect some big construction projects in states, now controlled by the opposition, to be delayed. Amongst the projects that could face delay, are the Pahang-Selangor Water Transfer project, the Northern Corridor & the West Coast Highway project. These delays will impact construction activities & the building materials sector.

Selling will not be easy in this market. The prices will be depressed & stay depressed. What you need to do will be guided by the level of risk that you are comfortable with.

Sunday, March 09, 2008

Malaysia decides to take a different road

After 50 years of independence, Malaysians have come to know & to accept only one approach in the management of the nation's affair. That approach, referred to as the BN way by some, is like a well-traveled highway- straight, wide & clearly drawn-out.


US Highway 285 in Colorado

Yesterday, Malaysians have decided to take a different road. A road that's less traveled...


An ancient road, converted to a hiking trail in Pasubio (Italy)

A more treacherous & winding road.


Stelvio Pass Road in the Italian Alps

A road off the beaten path & on the wild side.


The 1000-km Friendship Road from Tibet to Nepal

A road where one can't see what lies ahead.


North Yungas Road in the Bolivian Andes

Like it or not, we will be traveling on this road together. And, our nation- hopefully- will benefit from this journey.

Friday, March 07, 2008

Bursa's sharp fall compared...

The recent sharp fall in the share price of Bursa can be compared to 2 other listed regional stock exchange companies, SGX & HKEX. From Chart 1 below, we can see that SGX has been dropping since recording a high of S$16.50 in October last year. Yesterday, SGX closed at S$7.64- dropping 55% over the past 5 months. In the process, SGX has broken below its medium-term uptrend line support of S$10.50 in January this year. It is now holding onto its strong horizontal support of S$7.50.


Chart 1: SGX's daily chart as at March 5, 2008 (source: SGX)

HKEX has similarly been trending lower since its November 2007 high of HK$272. Yesterday, it closed at HK$143.10- losing 47% over the past 4 months. HKEX is now testing its medium-term uptrend line support as well as its horizontal support at around HK$135-140 level. This means that HKEX has dropped by 47% over the past 4 months.


Chart 2: HKEX's daily chart as at March 5, 2008 (source: HKEX)

In comparison, Bursa dropped from its high of RM16.90 recorded on October 30, 2007 to close at RM10.10 yesterday. That means Bursa's recent sharp decline (of 40% from its peak) was in line with those of its regional peers.


Chart 3: Bursa's weekly chart as at March 6, 2008 (courtesy of Quickcharts)

The important question is whether Bursa's fall would eventually match those of SGX & HKEX. Only time will tell.

Tuesday, March 04, 2008

WTHorse's bottomline continued to improve

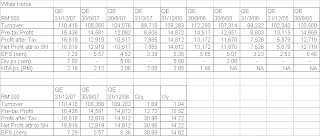
WTHorse has just announced its results 4Q2007 ended 31/12/2007. For QE31/12/2007, WTHorse's net profit increased by 31.0% q-o-q or 14.2% y-o-y to RM16.9 million. Turnover increased marginally by 1.9% q-o-q or 1.0% y-o-y to RM110 million. For FY2007, WTHorse's net profit increased marginally by 2.2% from RM47.2 million to RM48.2 million, while its turnover has dropped by 1.2% from RM418 million to RM413 million.


WTHorse (closed at RM1.21 as at Mar 3) is now trading at a trailing PE of 5.8 times (using its last 4 quarters' EPS of 20.8 sen) or at a P/Book of 0.6 times (using its NTA per share of RM2.19 as at 31/12/2007). At these multiples, WTHorse is deemed inexpensive.

Technically speaking, WTHorse is still in a bottoming phase with support at RM1.10-13 and resistance at RM1.30. Overhead downtrend line will act as a resistance at RM1.35.


Chart: WTHorse's weekly chart as at March 3, 2008 (courtesy of Quickcharts)

Based on improving performance, WTHorse could be a good candidate for contrarian investment.

Bursa poised to test its uptrend line

As at 3.30 pm, Bursa was trading at RM10.50. This means that Bursa has dropped about 40 sen from yesterday's closing price. Looking at the weekly chart below, we can see that Bursa's immediate horizontal support is at RM10.50, with the next support expected at the psychological RM10.00 level. If these supports are violated, then Bursa might test its long-term uptrend line support at RM9.70. Bursa was trading as high as RM16.30 in January this year.

I believe Bursa could be a good Trading Buy at either the RM10.00 psychological level or at the uptrend line support of RM9.70. If you do go for this trade, be sure to set a stop loss, say at RM9.50 in case the trade goes against you.


Chart: Bursa's weekly chart as at March 3, 2008 (courtesy of Quickcharts)

Ta Ann may have a bullish breakout

Ta Ann Holdings Bhd ('Ta Ann') is one of the largest timber company in Malaysia. The company has recently announced its results for for 4Q2007 ended 31/12/2007. For QE31/12/2007, its net profit dropped by 58.9% q-o-q or 73.8% y-o-y to RM12.3 million. Its turnover has also declined by 7.6% q-o-q or 17.8% y-o-y to RM161 million. For the quarter under review, the net profit has declined due to lower profit form the plywood division (due to lower selling prices as well as higher freight charges & raw material costs). In addition, Ta Ann's Tasmanian subsidiary incurred a loss of RM6.5 million during the quarter for similar reasons plus write-off of start-up expenditure. This poor performance is partially offset by the oil palm division, which saw its profit contribution increasing from 28% to 58% of the group's overall pre-tax profit.

For FY2007, Ta Ann's net profit declined by25.6% from RM130.4 million to RM97.0 million, while its turnover has dropped by 10.6% from RM637 million to RM570 million.


Ta Ann (closed at RM6.50 as at Mar 3) is now trading at a trailing PE of 14.4 times (using its last 4 quarters' EPS of 45.2 sen) or at a P/Book of 2.1 times (using its NTA per share of RM3.15 as at 31/12/2007). At these multiples, Ta Ann is deemed fairly priced.

From the next table, we can see that the timber prices have yet to show any sign of reversing. So, going forward, I believe that Ta Ann's performance will be more dependent on its oil palm division. Ta Ann may breath a sigh of relief, seeing the present sharp rise in the prices of CPO. But, how long will this persist?


Source: The ITTO Tropical Timber Market Reports

The reason for this post is that, despite the poor performance as noted above, Ta Ann has broken to the upside of a few resistances, such as the strong horizontal resistance of RM6.40-50 (which happened about 2 days ago) as well as a medium-term downtrend line at RM6.10-20 (which happened about 6 days ago). Finally, Ta Ann gained 30 sen to close at RM6.80 this morning. In the process, Ta Ann has also broken to the upside of the shorter term downward channel (starting from September last year). You will notice that the last 2 weeks' trading volume has also been quite heavy, indicating that a big buyer is now eagerly buying this stock, despite the present stock market condition.


Chart 1: Ta Ann's daily chart as at March 3, 2008 (courtesy of Quickcharts)


Chart 2: Ta Ann's weekly chart as at March 3, 2008 (courtesy of Quickcharts)

Based on the technical breakout, Ta Ann could be a Trading Buy. Nevertheless, we must note that the fundamentals of the company is not very favorable, and the stock market condition is presently very precarious.

Monday, March 03, 2008

Market Outlook as at February 29, 2008

The KLCI ended the morning session with a drop of 24.17 points to close at 1333.23. As such, the KLCI has just broken below its strong horizontal support of 1340. A quick recovery is needed, failing which the KLCI could slide further to test the psychological 1300 level, the horizontal support of 1285 level and the uptrend line support of 1265.


Chart: KLCI's weekly chart as at February 29, 2008 (courtesy of Quickcharts)

Looking at the price chart as well as the MACD indicator and the moving averages, I think the market is probably heading for further slides, possibly culminating with a selling climax sometime this week. However, with the election scheduled for March 8, I do expect some buying support, as some investors might be positioning themselves for a post-election rally.

Sunday, March 02, 2008

TGuan's net profit rebounded in QE31/12/2007

In October last year, I have posted about TGuan , a company involved in the manufacturing of plastic & paper products; plastic packaging products; and tea, coffee & other related consumer products (go here). I have noted that TGuan was a laggard trading at very attractive multiples. The word 'laggard' does not describe TGuan correctly. Its share price was clearly moving in a downtrend.

TGuan has however reported an improvement in its topline & bottomline in QE31/12/2007 (go here). This turnaround appears to be gaining traction with the announcement of the results for QE31/12/2007. For QE31/12/2007, TGuan's net profit increased by 82.6% q-o-q or 260.9% y-o-y to RM9.7 million. Turnover increased by 4.3% q-o-q or 16.1% y-o-y to RM143 million. For FY2007, TGuan's net profit only declined by 3.3% from RM21.6 million to RM20.9 million, while its turnover has increased by 11.4% from RM470 million to RM523 million. The lower net profit for FY2007 was attributable to higher raw materials cost, higher freight cost, increased interest expenses & operational losses from its newly set-up subsidiary in China,


TGuan (closed at RM0.82 as at Feb 29) is now trading at a trailing PE of 4 times (using its last 4 quarters' EPS of 19.8 sen) or at a Price to Book of 0.45 times (using its NTA per share of RM1.83 as at 31/12/2007). Thus, TGuan is deemed inexpensive.

Technically speaking, TGuan's share price is in downtrend. If we ignore the extreme prices, a downtrend line (in red) can be drawn. One might also draw a downward channel (including the extreme prices, like the 2 parallel black lines drawn by me). A recovery above the psychological RM1.00 level could be the beginning of the bottoming-out process. To follow the technical rule, the worst is over when the share price breaks above the downtrend, either at RM1.30 (as per the red line) or at RM1.45 ( as per the upper channel).


Chart: TGuan's 5-year daily chart as at February 29, 2008 (courtesy of TradeSignum.com)

Based on improving financial performance & attractive valuation, TGuan is a very good candidate for a contrarian play.

Note: Some contrarians follow one rule regarding risk management, which I would like to share with you. The rule is that if the share price dropped more than 20% from the entry price (presumably at RM1.10 as per the first post), one should dispose of the share & stay on the sideline until the share price had surpassed the original entry price. This rule may be a real hassle, but one must follow some rules in investing or in trading.