Showing posts with label household goods. Show all posts

Sunday, February 28, 2021

LATITUD: Earnings Growth Continued (UPDATED)

Result Update

In QE301/12/2020, Latitud's net profit rose 103% q-o-q or 269% y-o-y to RM26.6 million while revenue rose 4% q-o-q or 17% y-o-y to RM244 million. The Group revenue rose q-o-q mainly attributable to higher sales recorded by furniture plants due to higher shipment in current quarter and higher local sales recorded by panel board lamination plant, which were offset by weakening of US Dollar (“USD”) against Ringgit Malaysia (“RM”) by 1.2%.

The Group has recorded a 80%-increase in PBT from RM16.8 million to RM30.3 million mainly attributable to the increase in gross profit; lower foreign exchange loss of RM1.1 million recorded in current quarter compared to preceding quarter; and final insurance compensation of RM7.8 million received by a furniture plant in Vietnam in current quarter for a fire incident occurred in FY2018.

The Group has recorded 26%-increase in gross profit from RM30.3 to RM38.1 million mainly attributable to the increase in revenue and higher sales of better margin products.


Table: Latitud's 8 quarterly results


Graph: Latitud's P&L  for last 62 quarterly results

Financial Position

As at 31/12/2020, Latitud's financial position is deemed healthy with current ratio at 2.2x and gearing ratio at 0.5x.

Valuation

Latitud (closed at RM4.19 last Friday) is now trading at a trailing PER of 9.4 times (based on last 4 quarters' EPS of 44.7 sen). If we exclude the one-off exceptional gain from insurance claim of RM7.8 million received by a furniture plant in Vietnam, the PE ratio is still quite attractive at 11.4 times.

Proposed Bonus Issue

Latitud has proposed a 1-for-1 bonus issue in January (here). The ex date for the bonus issue has just been fixed on 12 February (here). This will likely attract retail buying interest which will boost the share price in the near term.

Technical Outlook

Latitud is in an uptrend line with support at RM3.90. Immediate resistance is at the horizontal line at RM4.50.

Chart 1: Latitud's daily chart as at Feb 25, 2021 (Source: Malaysiastock.biz)

Looking at the monthly chart, we can see that Latitud has broken above the long term downtrend line at RM2.50 in October 2020.


Chart: Latitud's monthly chart as at Feb 25, 2021 (Source: Malaysiastock.biz)

Conclusion

Based on good financial performance & position, fairly attractive valuation and bullish technical outlook, Latitud is a good stock for long-term investment.

Note:

I hereby confirm that I do not have any direct interest in the security or securities mentioned in this post. However, I could have an indirect interest in the security or securities mentioned as some of my clients may have an interest in the acquisition or disposal of the aforementioned security or securities. As investor, you should fully research any security before making an investment decision.

Sunday, November 29, 2020

LATITUD: Earnings rebounded strongly

Result Update

In QE30/9/2020, Latitud's net profit rose 39-fold q-o-q or 99% y-o-y to RM13 million while revenue rose 70% q-o-q or 21% y-o-y to RM235 million. The Group revenue increased by 21% y-o-y mainly attributable to higher sales recorded by furniture plants in Vietnam amounting to RM40.2 million; higher orders received by panel board lamination plant amounting to RM2.7 million; strengthening of US Dollar (“USD”) against Ringgit Malaysia (“RM”) by 0.9%; offset with lower orders received by Thailand sawmill plant amounting to RM1.2 million.

Group PBT increased by more than 100.0% from RM7.9 million mainly attributable to 55.4% increase in gross profit; fair value gain on derivatives of RM0.7 million in QE30/9/2021 compared to fair value loss on derivatives of RM0.3 million in QE30/9/2020; offset with foreign exchange loss of RM2.1 million in QE30/9/2021 compared to foreign exchange gain of RM0.1 million in QE30/9/2020. The substantial increase in gross profit was mainly attributable to the increase in revenue; furniture and sawmill plants recorded higher sales of better margin products; and lower production costs due to higher production output across all divisions.


Table: Latitud's 8 quarterly results


Graph: Latitud's P&L  for last 61 quarterly results

Financial Position

As at 30/9/2020, Latitud's financial position is deemed healthy with current ratio at 2.1x and gearing ratio at 0.5x.

Valuation

Latitud (closed at RM3.94 last Friday) is now trading at a trailing PER of 16 times (based on last 4 quarters' EPS of 24.32 sen). While the PER looks fairly reasonable and possibly fully valued the earnings of the last 4 quarters, it must be pointed out that the recovery in earnings has just begun. If Latitud can achieve the same level of earnings in the next few quarters, similar to QE30/9/2020, then its PER will drop to 7 times. This would make the stock exceptionally attractive.

Technical Outlook

Latitud has broken above its downtrend line RR at RM2.50 in October. Its immediate resistance is at the horizontal line at RM4.00.


Chart: Latitud's monthly chart as atNov 27, 2020 (Source: Malaysiastock.biz)

Conclusion

Based on good financial performance & position, fair valuation and bullish technical outlook, Latitud is a good stock for long-term investment.

Note:

I hereby confirm that I do not have any direct interest in the security or securities mentioned in this post. However, I could have an indirect interest in the security or securities mentioned as some of my clients may have an interest in the acquisition or disposal of the aforementioned security or securities. As investor, you should fully research any security before making an investment decision.

Tuesday, September 29, 2020

NTPM: Higher earnings on lower revenue

Result Update

For QE31/7/2020, NTPM's net profit rose 259% q-o-q or 28-fold y-o-y to RM14.6 million while revenue dropped by 11%  q-o-q or 3% y-o-y to RM179 million. Group revenue dropped y-o-y due to the decrease in sales of Tissue paper products. The Group’s PBT increased 527% y-o-y mainly due to the lower raw material cost and overhead cost. The key factors that affect the performance of tissue products include the lower cost in raw material consumed such as virgin pulp and waste paper.

 
Table: NTPM's last 8 quarterly results


Graph: NTPM's last 55 quarterly results

Financial Position

NTPM's financial position as at 31//7/2020 is deemed adequate with current ratio at 0.96 time and total liabilities to total equity at 1.17 times.

Valuation

NTPM (closed at RM0.63 yesterday) is now trading  at a PE of 33.5 times (based on last 4 quarters' EPS of 1.88 sen). At this PER, NTPM is deemed overvalued.

Technical Outlook

NTPM broke above its long-term downtrend line, RR at RM0.40 in September 2019. Due to the sharp selldown in March, the stock revisited the downtrend line again at RM0.32. The 50-week SMA line could be a good support if NTPM share price comes under selling pressure. The breakout of the downtrend line, coupled with the recent upward movement, means that the worst is behind the stock and better days may be here.


Chart 2: NTPM's weekly chart as at Sep 28, 2020 (Source: Malaysiastock.biz)

Conclusion

Based on improved financial performance and mildly bullish technical outlook, NTPM could be a good stock for recovery play. Its upside potential is still limited due to demanding valuation.

Note:

I hereby confirm that I do not have any direct interest in the security or securities mentioned in this post. However, I could have an indirect interest in the security or securities mentioned as some of my clients may have an interest in the acquisition or disposal of the aforementioned security or securities. As investor, you should fully research any security before making an investment decision.
 

Monday, October 01, 2018

Jaycorp: Profit Recovery Began

Background

Jaycorp Berhad ("Jaycorp") is involved in 6 business segments, namely rubberwood furniture, which is engaged in the manufacture and sale of rubberwood furniture; packaging, which is engaged in the conversion of corrugated boards into carton boxes; processing of rubberwood, which is engaged in pressure treatment and kiln-drying of rubberwood; general trading, which sells construction materials, renewable energy, and others, which is engaged in the provision of transportation services, property letting and printing. 

Diagram: Jaycorp's 6 business segments

Recent Financial Result 

For QE31/7/2018, Jacorp returned to the black as it reported a net profit of RM4.6 million as compared to a net loss of RM392k in the immediate preceding quarter.


 Table 1: Jaycorp's last 8 quarterly results

The improvement in the financial performance was due to overall better profits or turnaround in all segments, especially the Furniture segment.


Table 2: Jaycorp's segmental results for QE31/7/2018


Graph: Jaycorp's last 32 quarterly results

Financial Position

Financial position is deemed healthy with current ratio at 2.5 times and gearing ratio at 0.35 time.

Valuation

Jaycorp (closed at RM0.94 last Friday) is now trading at a PE of 12.5 times (based on last 4 quarters' EPS of 7.52 sen). At this multiple, Jaycorp is deemed fairly attractive.

Technical Outlook

Jaycorp is struggling to stay at its long-term uptrend line at RM0.90.


Chart : Jaycorp's weekly chart as at Sep 28, 2018 (Source: Malaysiastock.biz)

Conclusion

Based on the improved financial performance, healthy financial position and fairly attractive valuation, I consider a good stock for long-term investment.

Note:
I hereby confirm that I do not have any direct interest in the security or securities mentioned in this post. However, I could have an indirect interest in the security or securities mentioned as some of my clients may have an interest in the acquisition or disposal of the aforementioned security or securities. As investor, you should fully research any security before making an investment decision.

Monday, July 23, 2018

LIIHEN: Attractive Furniture Stock

Recent Financial Result

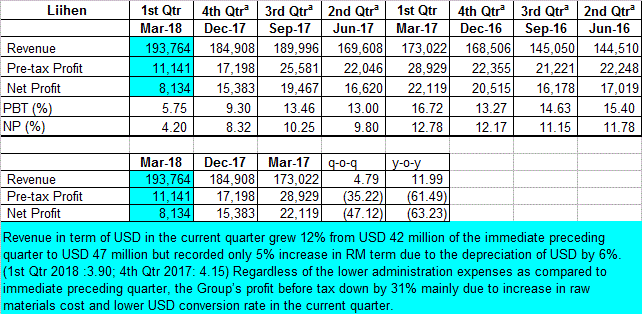
In QE31/3/2018, Liihen's net profit dropped 47% q-o-q or 63% y-o-y to RM8.1 million while revenue rose 4.8% q-o-q or 12.0% y-o-y to RM194 million. Revenue in term of USD grew 12% from USD 42 million of the immediate preceding quarter to USD 47 million but recorded only 5% increase in RM term due to the depreciation of USD by 6%. (1st Qtr 2018 :3.90; 4th Qtr 2017: 4.15) Regardless of the lower administration expenses as compared to immediate preceding quarter, the Group’s profit before tax down by 31% mainly due to increase in raw materials cost and lower USD conversion rate in the current quarter. With the USD strengthening in the past 3 months, Liihen's profits for QE30/6/2018 may enjoy a boost. [Note: Liihen's result for QE31/3/2018 was released on May 24, 2018.]


Table: Liihen's last 8 quarterly results


Graph: Liihen's last 22 quarterly results

Financial Position

As at 31/3/2018, Liihen's financial position is deemed healthy with current ratio at 2.2 times and total liabilities to total equity of 0.47 times. It has net cash of RM85.7 million or RM0.476 per share).

Valuation

Liihen (closed at RM2.84 at the end of the morning) is now trading at a trailing PER of 8.6 times (based on last 4 quarters' EPS of 33.1 sen). If the net cash is deducted from the share price, then the trailing PER would be lowered to 7.1 times. It paid total dividend of 18.5 sen last 4 quarters, which gives a dividend yield of 6.5%. The PER and DY numbers show Liihen to be an attractive stock.

Technical Outlook

Liihen has been in an intermediate downtrend from November last year. It could have broken above that downtrend line at RM2.75.


Chart 1: Liihen's daily chart as at July 23, 2018_12.30am (Source: Shareinvestor.com)

Liihen is still in a long-term uptrend line, with support at RM2.20.


Chart 2: Liihen's monthly chart as at July 23, 2018_12.30am (Source: Shareinvestor.com)

Conclusion

Despite weaker financial performance, Liihen is a good stock for long-term investment based on its healthy financial position, attractive valuation & bullish technical outlook.

Note:
I hereby confirm that I do not have any direct interest in the security or securities mentioned in this post. However, I could have an indirect interest in the security or securities mentioned as some of my clients may have an interest in the acquisition or disposal of the aforementioned security or securities. As investor, you should fully research any security before making an investment decision.

Wednesday, June 27, 2018

Pohuat: Earning Stabilized

Results Update

For QE30/4/2018, Pohuat's net profit rose 73% q-o-q or 2% y-o-y to RM11 million while revenue dropped 23% q-o-q or 2% y-o-y to RM126 million. Revenue dropped y-o-y due to 12.4%-decline in turnover for the Vietnamese operations, due to lower exchange rate for VND to MYR, which was partially offset by a 16.3%-increase in turnover for the Malaysian operation due to strong orders for our panel-based bedroom sets for the US market.

Despite higher sales, the Malaysian operations reported a lower gross profit margin of 18.1% in the current reporting period against 26.9% in the previous corresponding reporting period due to the
progressive increase in raw material costs as well as the weakening of the USD against the Ringgit which has resulted in lower Ringgit selling prices for our products.

In line with the lower sales, the Vietnamese operations reported a lower profit before tax of RM4.00 million as Profit before tax margin weakened to 5.84% against 9.39% previously due to the shift in our product mix to the affordable ranges and progressive increases in raw material and labor costs over the last 12 months.

During the quarter, Pohuat recorded exceptional gains from fire insurance compensation of RM1.27 million (for its Malaysian operation) as well as a net income of RM3.95 million being the final payment under the Settlement of Enforcement Proceedings Agreement for the disposal of our former subsidiary, Poh Huat Furniture Industries (Qingdao) Co Ltd. If these 2 one-off exceptional items were excluded, Pohuta's profit before tax would be lowered to RM7.4 million. Thus, Pohuat's profit before tax would show a decline compared to the immediate preceding quarter.


Table 1: Pohuat's last 8 quarterly results


Graph: Pohuat's last 46 quarterly results

Valuation

Pohuat (closed at RM1.31 at the end of the morning session) is now trading at a trailing gross PER of 6.4 times (based on last 4 quarters' EPS of 20.65 sen). At this PER, the stock is fairly attractive. In addition, the stock pays dividend totaling 8 sen in last 4 quarter, which translates to an attractive Dividend Yield of 6.1%.

Technical Outlook

In January this year, Pohuat broke its 20-month EMA line at RM1.70, which effectively signaled the end of its uptrend.


Chart 1: Pohuat's monthly chart as at Jun 27, 2018_12.30 (Source: Shareinvestor.com)

After a steady decline over the past 6 months, Pohuat has recently broken above its downtrend line, RR at RM1.30. This means the share price is likely to at least form a base around the RM1.30 level before it may begin its recovery.


Chart 2: Pohuat's weekly chart as at Jun 27, 2018_12.30 (Source: Shareinvestor.com)

Conclusion

Based on good financial performance (albeit weaker than before) and fairly attractive valuation, Pohuat is a good stock for long-term investment.

Note:

I hereby confirm that I do not have any direct interest in the security or securities mentioned in this post. However, I could have an indirect interest in the security or securities mentioned as some of my clients may have an interest in the acquisition or disposal of the aforementioned security or securities. As investor, you should fully research any security before making an investment decision.

Tuesday, June 26, 2018

NTPM: Earnings Plummeted

Result Update

For QE310/4/20187, NTPM's net profit dropped 88% q-o-q or 87% y-o-y to RM1.2 million while revenue was mixed - dropped by 9%  q-o-q but rose 3% y-o-y - to RM165 million. Revenue increased y-o-y mainly due to the increase in sales of Tissue and Personal Care Products, especially Personal Care products. The decrease in profit before taxation was mainly due to the higher raw material cost.

 
Table: NTPM's last 8 quarterly results


Graph: NTPM's last 51 quarterly results

Valuation

NTPM (closed at RM0.585 yesterday) is now trading  at a PE of 22 times (based on last 4 quarters' EPS of 2.7 sen). At this PER, NTPM is deemed overvalued.

Technical Outlook

NTPM broke its long-term uptrend line, with support at RM0.60 in January this year. Recent rally brought the share price above this uptrend line in May. However it has since dropped below the uptrend line again,


Chart 1: NTPM's monthly chart as at Jun 25, 2018 (Source: Shareinvestor.com)

In addition, we can see that the recent rally failed to surpass its immediate downtrend line, RR at RM0.65.


Chart 2: NTPM's weekly chart as at Jun 25, 2018 (Source: Shareinvestor.com)

Conclusion

Based on poor financial performance, demanding valuation and bearish technical outlook, I downgrading NTPM from a HOLD to a SELL.

Note:

I hereby confirm that I do not have any direct interest in the security or securities mentioned in this post. However, I could have an indirect interest in the security or securities mentioned as some of my clients may have an interest in the acquisition or disposal of the aforementioned security or securities. As investor, you should fully research any security before making an investment decision.

Tuesday, May 22, 2018

PANAMY: A Bumper Dividend Coming

Results Update

For QE31/3/2018, Panamy's net profit dropped 41% q-o-q or 6% y-o-y to RM27 million while revenue was mixed- dropped by 13% q-o-q but rose 12% y-o-y to RM277 million. Revenue dropped q-o-q mainly due to lower sales from Home Shower products which was seasonally higher in the preceding quarter. As a result, its PBT dropped 34% to RM33.6 million from RM50.9 million in the preceding quarter.


Table: Panamy's last 8 quarterly results


Graph: Panamy's last 52 quarterly results

Valuation

Panamy (closed at RM38.30 yesterday) is trading at a PE of 17.7 times (based on last 4 quarters' EPS of 216 sen). At this PER, Panamy is deemed fairly attractive. In addition, Panamy pays a decent dividend- with DY of 6.5% (including special dividend of RM1.00 per share) or.3.9% (excluding special dividend).

Technical Outlook

Panamy has been range-bound for the past 2 years. Its immediate support & resistance are at RM33 & RM41.


Chart: Panamy's weekly chart as at May 21, 2018 (Source: ShareInvestor.com) 

Conclusion

Despite the weaker financial performance, Panamy is still a good stock for long-term investment based on attractive valuation and positive technical outlook.

Note:
I hereby confirm that I do not have any direct interest in the security or securities mentioned in this post. However, I could have an indirect interest in the security or securities mentioned as some of my clients may have an interest in the acquisition or disposal of the aforementioned security or securities. As investor, you should fully research any security before making an investment decision.

Friday, December 15, 2017

NTPM: Earnings Dropped Sharply


Result Update

For QE31/10/2017, NTPM's net profit dropped by 48% q-o-q or 60% y-o-y to RM6.4 million while revenue was mixed - dropped by 4%  q-o-q but rose 3% y-o-y - to RM169 million. Revenue increased y-o-y mainly due to the increase in sales of Tissue and Personal Care Products, especially Tissue segment. The Group’s profit before taxation dropped 54% y-o-y mainly due to the higher raw material cost and labor cost.

 
Table: NTPM's last 8 quarterly results


Graph: NTPM's last 49 quarterly results

Valuation

NTPM (closed at RM0.675 yesterday) is now trading  at a PE of 17 times (based on last 4 quarters' EPS of 3.9 sen). At this PER, NTPM is deemed fully valued.

Technical Outlook

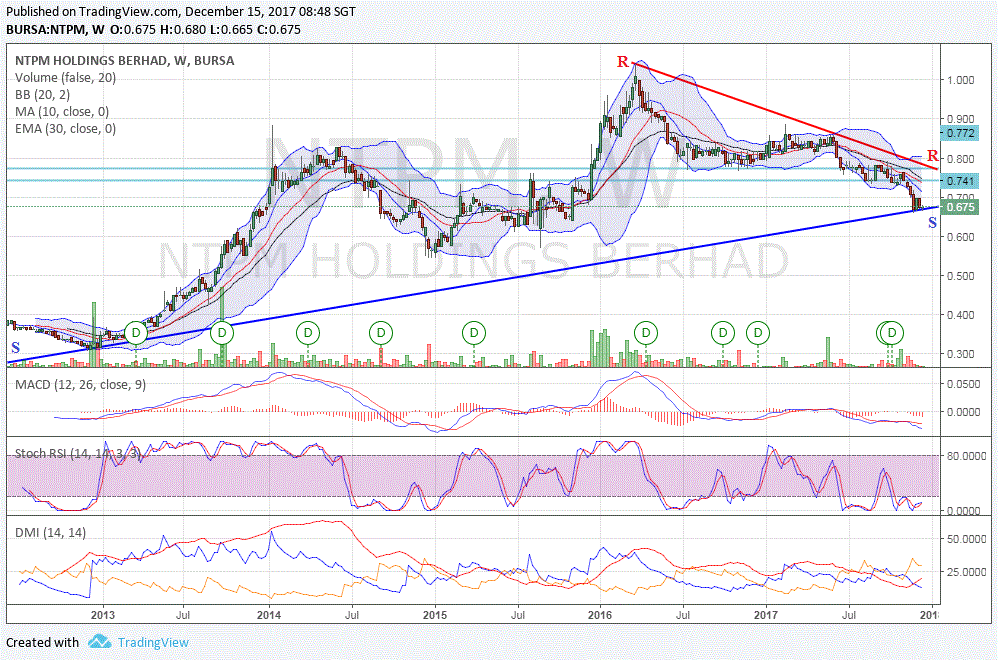
NTPM is in a long-term uptrend line, with support at RM0.68.


Chart 1: NTPM's weekly chart as at Dec 14, 2017 (Source: Malaysiastock.biz)

NTPM is however in an intermediate downtrend line with resistance at RM0.77.


Chart 2: NTPM's chart as at Dec 14, 2017 (Source: Malaysiastock.biz)

Conclusion

Based on poor financial performance & full valuation, I rate NTPM as a HOLD. It is important that the share price remains above the long-term uptrend line at RM0.68.

Note:

I hereby confirm that I do not have any direct interest in the security or securities mentioned in this post. However, I could have an indirect interest in the security or securities mentioned as some of my clients may have an interest in the acquisition or disposal of the aforementioned security or securities. As investor, you should fully research any security before making an investment decision.

Monday, September 25, 2017

NTPM: Earnings rose

Result Update

For QE31/7/2017, NTPM's net profit increased by 35% q-o-q or 29% y-o-y to RM12 million while revenue increased by 11% q-o-q or 16% y-o-y to RM176 million. Revenue increased y-o-y mainly due to the increase in sales of Tissue and Personal Care Products, especially Tissue segment. The increased revenue led to higher profits.

 
Table: NTPM's last 8 quarterly results


Graph: NTPM's last 48 quarterly results

Valuation

NTPM (closed at RM0.785 last Thursday) is now trading  at a PE of 16.7 times (based on last 4 quarters' EPS of 4.7 sen). NTPM pays a decent dividend, with dividend yield at 3%. At this PER, NTPM is deemed fairly valued.

Technical Outlook

NTPM is in a medium-term uptrend line, with support at RM0.75. It is also in a long-term uptrend line since 2006.


Chart 1: NTPM's weekly chart as at Sep 21, 2017 (Source: Malaysiastock.biz)


Chart 2: NTPM's chart as at Sep 21, 2017 (Source: Malaysiastock.biz)

Conclusion

Based on satisfactory financial performance & positive technical outlook, NTPM is a good long-term investment.

Note:

I hereby confirm that I do not have any direct interest in the security or securities mentioned in this post. However, I could have an indirect interest in the security or securities mentioned as some of my clients may have an interest in the acquisition or disposal of the aforementioned security or securities. As investor, you should fully research any security before making an investment decision.

Sunday, June 04, 2017

Panamy: Earnings Dropped

Results Update

For QE31/3/2017, Panamy's net profit dropped by 14% q-o-q or 26% y-o-y to RM27 million while revenue dropped by 13% q-o-q or 1% y-o-y to RM247 million. Revenue dropped q-o-q due to slower demand for Home Appliances products for both domestic and export market. The slowdown in market demand was mainly due to volatility of Middle East region, shortfall from Thailand sales and stiffer competition. PBT decreased by 33.6% or RM13.4 million as compared to combined profit before tax of RM39.7 million in the preceding quarter. (Panamy's latest result was announced on May 30.)


Table: Panamy's last 8 quarterly results


Graph: Panamy's last 48 quarterly results

Valuation

Panamy (at RM35.04 last Friday) is trading at a PE of 16.8 times (based on last 4 quarters' EPS of 209 sen). Notwithstanding a drop in dividend, Panamy still pays a decent DY of 3.3%.

Technical Outlook

Panamy is a long-term upward channel, with support at RM26.00.


Chart 1: Panamy's monthly chart as at Jun 2, 2017 (Source: ShareInvestor)

Panamy is now hanging onto the horizontal line at RM35.00.


Chart 2: Panamy's daily chart as at Jun 2, 2017 (Source: ShareInvestor) 

Conclusion

Despite the weaker financial performance, Panamy is still a good stock for long-term investment based on attractive valuation and positive technical outlook.

Note:
I hereby confirm that I do not have any direct interest in the security or securities mentioned in this post. However, I could have an indirect interest in the security or securities mentioned as some of my clients may have an interest in the acquisition or disposal of the aforementioned security or securities. As investor, you should fully research any security before making an investment decision.

Monday, March 13, 2017

NTPM: Earnings Dipped Marginally

Result Update

For QE31/1/2016, NTPM's net profit increased by 4% q-o-q or 33% y-o-y to RM17.7 million while revenue was increased by 6% q-o-q or 13% y-o-y to RM161 million. Revenue increased 3.7% q-o-q by RM6.2 million while profit before taxation increased by 5.1% q-o-q or RM1.1 million. The increase in profit before taxation was mainly attributable to higher sales revenue.

 
Table: NTPM's last 8 quarterly results


Graph: NTPM's last 46 quarterly results

Valuation

NTPM (closed at RM0.85 last Friday) is now trading  at a PE of 18.9 times (based on last 4 quarters' EPS of 4.5 sen). At this PER, NTPM is deemed fairly valued.

Technical Outlook

NTPM is in a medium-term upward channel, with support at RM0.85. It is also in a long-term uptrend line since 2006.


Chart 1: NTPM's daily chart as at Mar 10, 2017 (Source: MalaysiaStock.Biz)


Chart 2: NTPM's monthly chart as at Mar 10, 2017 (Source: MalaysiaStock.Biz)

Conclusion

Based on satisfactory financial performance & positive technical outlook, NTPM is a good long-term investment.

Note:

I hereby confirm that I do not have any direct interest in the security or securities mentioned in this post. However, I could have an indirect interest in the security or securities mentioned as some of my clients may have an interest in the acquisition or disposal of the aforementioned security or securities. As investor, you should fully research any security before making an investment decision.

Friday, September 30, 2016

Tekseng: There's Something Going On!

Yesterday evening, Tekseng made this announcement on Bursa website:

We refer to the above article that appeared in New Straits Times on 27 September 2016, with particular reference to the statement in the 1st paragraph reproduced as follows:


“Another wave of retrenchments has apparently hit Penang’s manufacturing sector, with a sudden announcement to over 200 employees that they are out of jobs.”

We wish to clarify that the above measures undertaken by TS Solartech Sdn Bhd, a 50.69% owned subsidiary of Tek Seng Holdings Berhad (“Tek Seng” or “the Company”) is to optimize manpower to enhance productivity efficiency and to reduce its operating cost over the longer term.

The cost saving measures will not have any operational impact on TS Solartech Sdn Bhd or the Group. TS Solartech Sdn Bhd still has sufficient manpower of around 500 employees to fulfill the operation lines and is operating as usual in Penang Science Park. The Management of TS Solartech Sdn Bhd had resolved the issue by compensating monetarily. Despite that, the financial impact of manpower retrenchment is minimal.

The last line- the financial impact of manpower retrenchment is minimal - raised the question: How minimal is that? Does the management expect the company to still have a satisfactory performance this year?

From the chart below, we can see that the solar segment - Tekseng's most profitable - had suffered a drop in PBT from RM20 million in QE31//3/2016 to RM13 million in QE30/6/2016. Its contribution to overall revenue had also declined from 68% to 63%. The drop in revenue & profit could be a developing negative trend which prompted the drastic action to retrench 200 workers.


Chart 1: Tekseng's segmental results for QE30/6/2016, QE31/3/2016 & QE30/6/2015

Chartwise, Tekseng is now enjoying a tepid rebound from the announcement. I don't think the rebound will go far. At best, it may touch RM1.10. In any event, I seriously doubt it can surpass the horizontal line at RM1.15.


Chart 2: Tekseng's 120-min intra-day chart as at Sep 30, 2016_11.20am (Source: Shareinvestor.com)

Based on the uncertain prospects of the Solar segment, I recommend to avoid Tekseng.

Note:

I hereby confirm that I do not have any direct interest in the security or securities mentioned in this post. However, I could have an indirect interest in the security or securities mentioned as some of my clients may have an interest in the acquisition or disposal of the aforementioned security or securities. As investor, you should fully research any security before making an investment decision.